
If you’ve looked around the internet at the income investing world, you’ve pretty much heard the words JEPQ and SPYI used interchangeably. They’re not. Both are covered-call ETFs designed to give you a fat monthly check, but they are based on different indexes, they generate their income differently, and — something people rarely explain clearly — they are taxed differently.
The short answer is JEPQ (JPMorgan Nasdaq Equity Premium Income ETF) offers a higher total return, lower expense ratio and a growth bias with the Nasdaq-100, with the income being taxable as ordinary income.
SPYI (NEOS S&P 500 High Income ETF) is built on the broader S&P 500 and also carries a lower beta, and the option income is structured under Section 1256 with approximately 90% of distributions being return of capital.
SPYI’s tax advantage matters most in a taxable account; in a Roth or traditional IRA it disappears, which is where JEPQ’s lower fee and higher yield make it the better pick.
JEPQ vs SPYI at a Glance
Here’s the full side-by-side, reconciled to a single source and date.
| Metric | JEPQ (JPMorgan) | SPYI (NEOS) |
| Full name | JPMorgan Nasdaq Equity Premium Income ETF | NEOS S&P 500 High Income ETF |
| Underlying index | Nasdaq-100 | S&P 500 |
| Inception date | May 3, 2022 | August 30, 2022 |
| Income mechanism | OTM Nasdaq-100 index calls via ELNs | SPX index options (Section 1256) |
| Tax character | Mostly ordinary income | ~90% return of capital + 60/40 |
| Expense ratio | 0.35% | 0.68% |
| AUM | $39.01B | $10.54B |
| Price (52-week range) | $60.53 ($53.51 – $61.72) | $53.69 ($47.77 – $54.11) |
| Dividend yield (ttm) | 10.35% | 11.72% |
| 30-day SEC yield | 11.98% (3/31/26) | 0.48% (6/30/26) |
| 1-year total return | 24.10% | 19.27% |
| 3-year total return (annualized, official) | 19.14% (3/31/26) | 15.50% (6/30/26) |
| Since-inception return (annualized) | 16.84% | 14.90% |
| Beta (vs. market) | 0.83 | 0.71 |
| Top-10 concentration | 41.1% | 36.4% |
| Number of holdings | 111 | 514 |
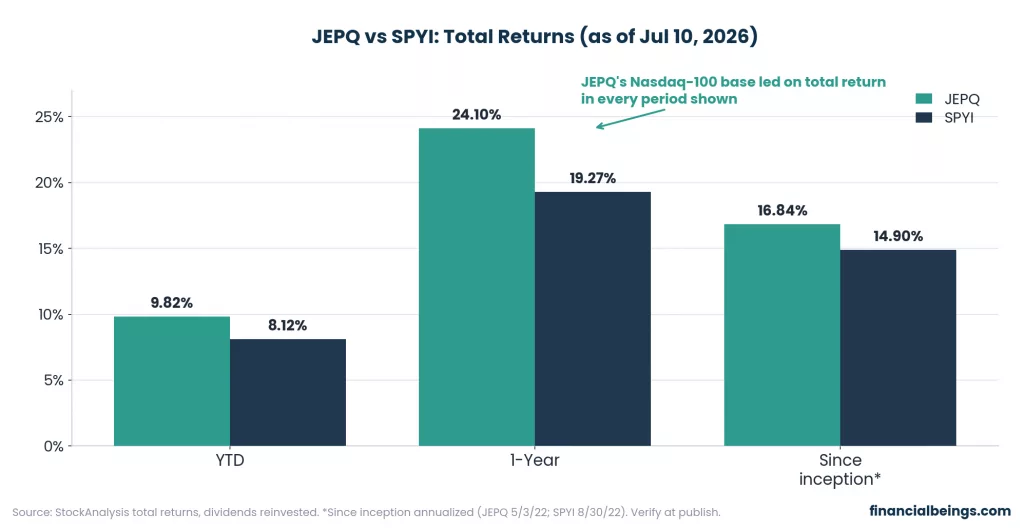
Figure 1: JEPQ vs SPYI total returns for YTD, 1-year, and since inception, showing JEPQ ahead in every period
Pay attention to the pattern: JEPQ has been a positive leader for all the trailing return windows displayed here. This is not a coincidence; it is a result of the choice of indexes. The Nasdaq-100 has simply outpaced the S&P 500 over this period, and JEPQ’s covered-call overlay was not a strong enough drag to erase that gap.
However, there’s only one axis here to compare, and every data-table site compares it. The more interesting, higher-stakes questions concern the income mechanism and tax treatment, and whether either fund’s eye-popping yield is sustainable.
What Are JEPQ and SPYI?
JEPQ launched in May 2022 and is managed by J.P. Morgan Asset Management. It’s an equity-linked note (ELN) based portfolio which sells out-of-the-money call options to receive premiums on top of any price gains in the tech-heavy index. It has $39 billion in assets and is one of the biggest actively managed option-income ETFs available.
SPYI is operated by NEOS Investments and began around four months later, in August 2022. SPYI sells call options on the S&P 500 index (SPX) directly, rather than through ELNs, with cash-settled index options. This one structural preference is the basis of almost all of the other tax and mechanics differences. SPYI currently oversees approximately $10.5 billion.
Both funds pay monthly distributions and are aimed at the same type of investors: those who wish to get at least some additional income over a plain index fund, but not lose all their equity exposure.
How Each Fund Generates Income
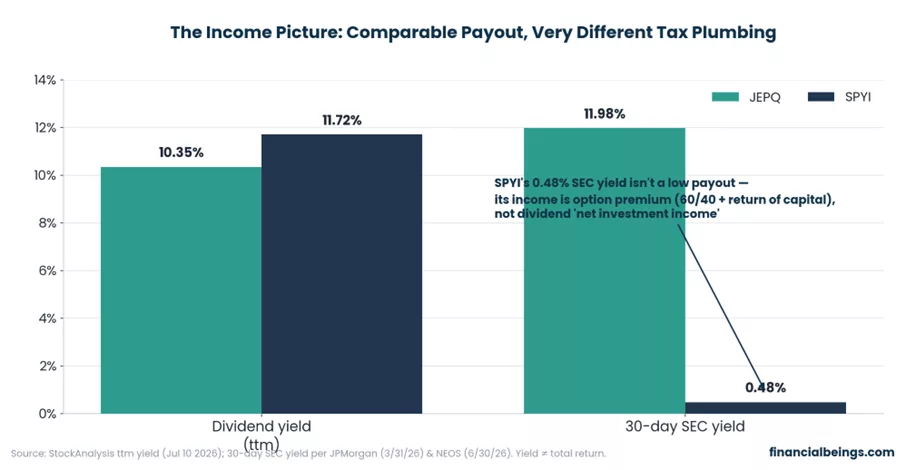
Figure 2: Grouped bar chart comparing JEPQ and SPYI on dividend yield and 30-day SEC yield, highlighting the gap driven by income mechanism
| Metric | JEPQ | SPYI |
| Dividend yield (ttm) | 10.35% | 11.72% |
| 30-day SEC yield | 11.98% | 0.48% |
| Monthly income on $10,000 | ~$86 | ~$98 |
At first glance, that graph doesn’t make sense. SPYI’s trailing distribution rate is 11.72%, which is much higher than its 0.48% 30-day SEC yield. It is not a mistake; it does not imply that SPYI is discreetly reducing your payment. It reflects a quirk of the SEC yield formula, which counts dividend and interest “net investment income” but not option premium.
A fund whose income is overwhelmingly option premium, such as SPYI, will show an SEC yield in a completely different range from its reported distribution rate. JEPQ’s 11.98% SEC yield is much more in line with its real payout, because its ELN-based income does count.
It’s not just the confusion over yields. JEPQ issues options based on stocks in the Nasdaq-100, providing income that becomes ordinary income for shareholders. SPYI writes straight on the S&P 500 index. Since it is a broad-based index option, IRS Section 1256 is in effect and that one classification trickles down to all the other stuff that follows.
JEPQ vs SPYI: Tax Efficiency
This is the piece the comparison sites skip, and it’s probably a more significant factor than the headline yield.
SPYI’s Section 1256 treatment. Options on the broad-based index (SPX) are subject to IRS Section 1256, which requires their gains to be split 60% long-term / 40% short-term, regardless of the fund’s actual holding period. On top of that split, SPYI has classified about 90-95% of its distributions as “return of capital” (ROC). It is not taxable income, but it will lower your cost basis, which means that you will still owe taxes once you sell (or once your basis is gone), and for most investors, delaying those taxes beats paying them now.
JEPQ’s ordinary-income treatment. JEPQ’s income comes through equity-linked notes rather than broad-based index options, so it flows to shareholders primarily as ordinary income (taxed at your federal marginal rate). For anyone in the 24% bracket or higher, that’s a real drag relative to SPYI’s blended structure.
After-Tax Income on $100,000, by Bracket
Here is the dollar difference if they were both $100,000 funds with recent trailing yields.
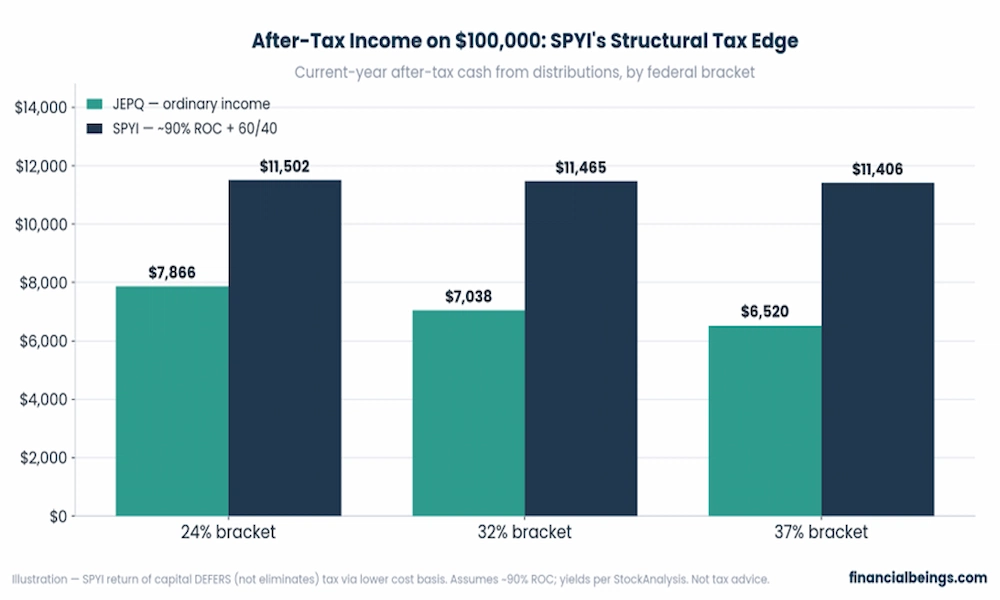
Figure 3: Grouped bar chart of current-year after-tax income from JEPQ vs SPYI on $100,000 across 24%, 32%, and 37% federal brackets, with SPYI ahead in each
| Federal bracket | JEPQ (after-tax) | SPYI (after-tax) |
| 24% | $7,866 | $11,502 |
| 32% | $7,038 | $11,465 |
| 37% | $6,520 | $11,406 |
As the bracket rises, the gap widens — and it is wider than most investors realize, given that SPYI carries the higher expense ratio. 0.68% seems a lot costlier than JEPQ’s 0.35% until you consider what remains after the IRS gets a slice. However, SPYI’s tax plumbing can often more than compensate for its fee disadvantage, particularly outside of the 24% tax bracket.
Which Belongs in a Roth or an IRA vs. a Taxable Account?
In a Roth IRA, qualified distributions are never taxed; in a traditional IRA, they are taxed as ordinary income only when you withdraw them. The 60/40 split and return of capital treatment make no difference, as nothing is being taxed. There, JEPQ — with its lower 0.35% fee and stronger total-return record — is the more sensible choice. If you’re still weighing whether to pick funds actively or just ride a plain index long-term, that’s a foundational tradeoff worth understanding first.
The inverse is true of a taxable brokerage account: that’s where SPYI’s Section 1256 and return of capital structure benefits. If the other numbers are equal: SPYI (taxable) / JEPQ (tax-sheltered).
Are the Distributions Sustainable? (NAV Erosion)
When any fund pays 10-12% per year, the question worth asking is: is that premium and appreciation, or is the fund handing back your own principal every month?
To date, both funds have held or grown their share price since inception rather than eroding it. While the price of SPYI has remained approximately $48-$54 through mid-2026, the distributions have been made from option premium and equity appreciation, not from the net asset value. JEPQ’s share price has followed a similar pattern, rising from its launch level while paying out monthly income.
But no erosion yet is not a promise, as both are relatively young funds and neither has experienced a truly prolonged bear market. The distribution coverage is dependent on the premium remaining high (more likely to occur when volatility is high) and on the underlying index not falling at a rate that is faster than the premium income.
It is also important not to conflate two things that constantly get conflated: return of capital is a tax classification, and not a sign of NAV decay. A lower cost basis for tax purposes is called ROC, whereas NAV erosion is a decrease in the fund’s actual share price relative to total return. Monitor both, but do not assume that they are connected.
Performance & Risk
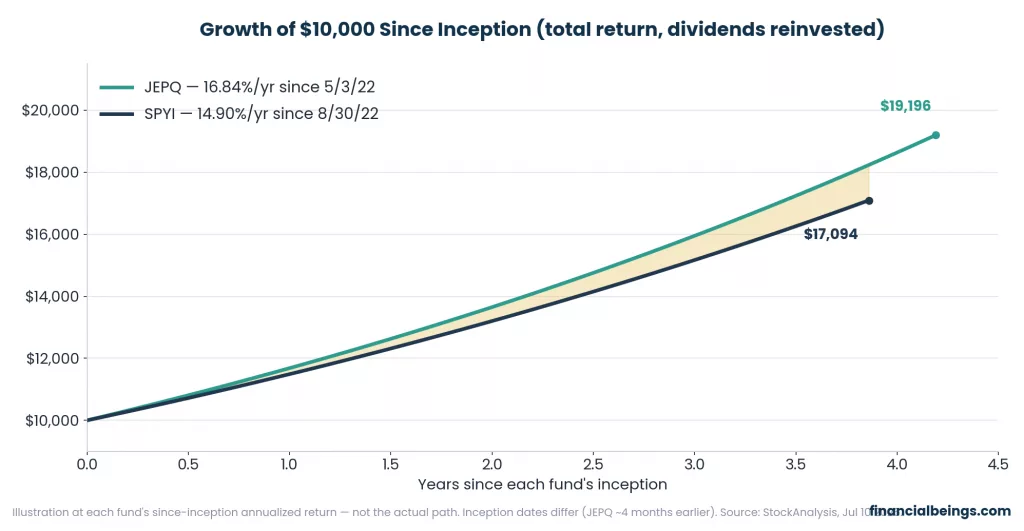
Figure 4: Line chart of $10,000 growing since each fund’s inception, showing JEPQ compounding to about $19,196 and SPYI to about $17,094
| Fund | Since-inception annualized return | $10,000 grows to |
| JEPQ | 16.84%/yr (since 5/3/22) | $19,196 |
| SPYI | 14.90%/yr (since 8/30/22) | $17,094 |
The return gap is made real with the hypothetical $10,000 invested at the beginning of each fund’s life: If you had invested in JEPQ at the start, you’d now be $2,100 richer, which is the pure strength of the Nasdaq-100 over the S&P 500 over this period, a good argument for JEPQ. If that growth tilt is what draws you in, it’s worth seeing how a dedicated growth fund performs against a plain broad-market one in our SCHG vs VOO comparison.
On the risk side, JEPQ is slightly more volatile, with a beta of 0.83 versus 0.71 for SPYI, but that’s a fair risk for focusing on a narrower index that’s geared to growth. Note: JEPQ’s beta against the stock index that it is tracking, the Nasdaq-100, is also below 1, at approximately 0.70, because it is a covered-call overlay. SPYI’s lower absolute beta is a result of the broad base of the S&P 500, together with its option overlay.
Holdings Overlap: Can You Hold Both?
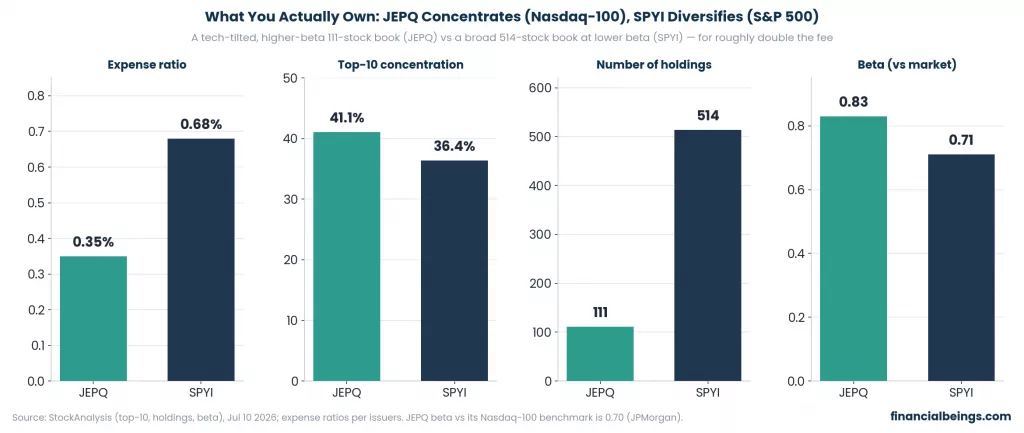
Figure 5: Four-panel bar chart comparing JEPQ and SPYI on expense ratio, top-10 concentration, number of holdings, and beta, with JEPQ higher on cost, concentration, and beta
| Metric | JEPQ | SPYI |
| Expense ratio | 0.35% | 0.68% |
| Top-10 concentration | 41.1% | 36.4% |
| Number of holdings | 111 | 514 |
| Beta (vs. market) | 0.83 | 0.71 |
JEPQ has a tech-heavy, concentrated, 111-stock book drawn from the Nasdaq-100, with mega-cap tech names dominating the top-10. SPYI has a lower beta, a materially higher number of underlying companies (514 of the S&P 500), and charges roughly double the fee. If fund structure basics like this still feel fuzzy, our breakdown of how ETFs are actually built is a good starting point.
Yes, you can hold both and many people, indeed, do hold both. The two funds’ diversification by strategy is much greater than their diversification by holdings because they both have a large concentration of mega-cap technology stocks. In a serious downturn, expect the two to move closely together. Holding both does give you two different income mechanisms and tax treatments — SPYI in a taxable account, JEPQ in a Roth, for example — which is a valid reason to split them between account types.
Which Should You Choose?
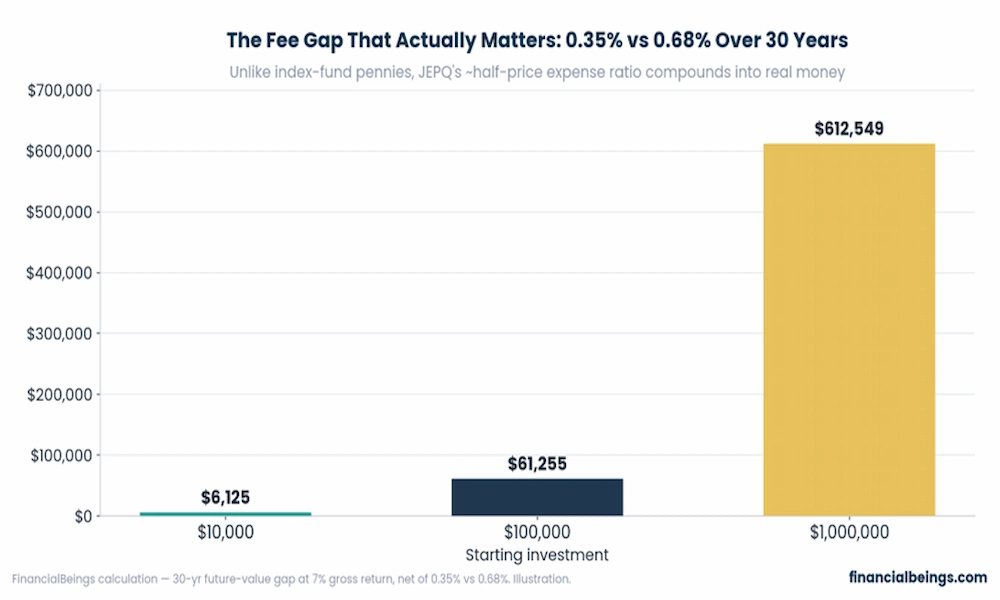
Figure 6: Bar chart showing the 30-year future-value cost of the 0.33 percentage point expense-ratio gap between JEPQ and SPYI, rising to roughly $612,000 on a $1 million starting investment
| Starting investment | 30-year fee-gap cost |
| $10,000 | $6,125 |
| $100,000 | $61,255 |
| $1,000,000 | $612,549 |
There’s no need to take the difference in fees lightly, although it might seem small in percentage terms. The difference, compounded over 30 years, comes to roughly $612,000 in extra fees on a $1,000,000 initial investment. It’s a real, measurable argument for JEPQ, especially for younger investors with a long-term horizon and, ideally, tax-deferred account space, where SPYI’s tax edge would not matter anyway.
Putting the whole picture together:
Choose JEPQ if:
- You are investing through a tax-advantaged account like a Roth IRA, a traditional IRA, or a 401(k).
- You want to pay lower fees and value a stronger total-return track record
- You want a growth/tech tilt and can tolerate some volatility
- You prefer a simpler, more liquid and larger fund ($39B AUM)
Choose SPYI if:
- You have a taxable brokerage (or regular) account and want to avoid tax drag on that account this year
- You’re looking for a more diversified exposure to 514 S&P 500 stocks instead of a book with fewer, but more focused, names on the Nasdaq-100 index
- You can afford a higher expense ratio and want the Section 1256 + return-of-capital tax treatment
- You like a bit more stability (lower beta) (0.71 vs. 0.83)
Consider holding both if: you have both taxable and tax-sheltered accounts — put SPYI in the taxable account and JEPQ in the tax-sheltered one.
And if you’re still deciding whether ETFs like these even fit your strategy better than picking individual stocks, our side-by-side look at stocks vs ETFs lays out that bigger-picture decision.
Frequently Asked Questions
Is JEPQ or SPYI more tax-efficient?
In a taxable account, SPYI will be generally more tax efficient. It sells and buys SPX index options under Section 1256 (60% long-term, 40% short-term) and the majority of distributions are deemed to be a return of capital, thereby deferring taxable events. Most income received by JEPQ is ordinary income generated from the ELN. If you’re talking about a Roth or an IRA, it doesn’t matter.
Which has the higher yield, JEPQ or SPYI?
This is dependent on the measured yield. SPYI’s current trailing 12-month dividend is higher (11.72% compared to 10.35%). On a 30-day SEC yield basis, it’s not apples-to-apples as SPYI’s 0.48% includes option-premium and return-of-capital income, and JEPQ’s 11.98% is closer to its actual payout. Always determine the methodology in a source.
Can I hold both JEPQ and SPYI?
Yes. They are based on different strategies, e.g. Nasdaq-100 vs S&P-500 option overlays. Still, their stock holdings are also very closely correlated and will probably go in tandem during a downturn in the market, as they are all heavily weighted with mega-cap technology stocks.
Does SPYI or JEPQ suffer NAV erosion?
Since inception, both funds have held or grown their share price while paying 10%+ distributions, funding those payouts from option premium and appreciation rather than from principal. Erosion risk rises if option premiums compress or if equities sell off for an extended stretch. Be careful not to conflate a tax classification with a proof of NAV decline; return of capital is a tax classification.
Which is cheaper, JEPQ or SPYI?
The expense ratios are 0.35% for JEPQ and 0.68% for SPYI — about $35 versus $68 per year on a $10,000 investment before compounding.
Is JEPQ or SPYI safer?
SPYI has a lower beta (0.71 compared to 0.83) and a much more diversified underlying book with 514 stocks, which normally means that it does not fluctuate as much as the other ETFs. JEPQ is considerably bigger ($39.0B as opposed to $10.5B AUM), which typically indicates tighter bid/ask spreads and more liquid trading.
Is JEPQ or SPYI better for retirement income?
Because of its tax-advantaged structure, in a taxable retirement account, SPYI can maintain more after-tax cash. JEPQ’s lower fee and better overall return might make sense in a Roth or traditional IRA, because the tax benefits that SPYI brings are not necessarily there. When matching the fund, match the account type, NOT the ticker.
References
- JPMorgan Asset Management. (2026). JPMorgan Nasdaq Equity Premium Income ETF (JEPQ) official fact sheet (as of March 31, 2026).
- JPMorgan Asset Management. (2026). JEPQ fund story and strategy overview.
- NEOS Investments. (2026). NEOS S&P 500 High Income ETF (SPYI) fund page (as of June 30, 2026).
- StockAnalysis.com. (2026, July 10). JEPQ vs. SPYI performance and holdings comparison.
- Dividend Vision. (2026). JEPQ vs. SPYI dividend and yield comparison.
