
IBM shares fell 23.9% from the end of 2025 to 25 September 2026. The question “is IBM a good stock to buy” now turns on what that lower price still expects from the business. A steep fall can remove optimism without removing all of it. The same gap between price moves and value shows up among the most volatile stocks in the S&P 500.
At $225.51, IBM’s share price implies 7.46% annual growth in profit above our 10% required return, sustained far into the future. That is less than the 8.13% implied at the end of 2025, but nearly twice the roughly 4% long-run pace our model eventually assumes for the economy.
The Quick Answer
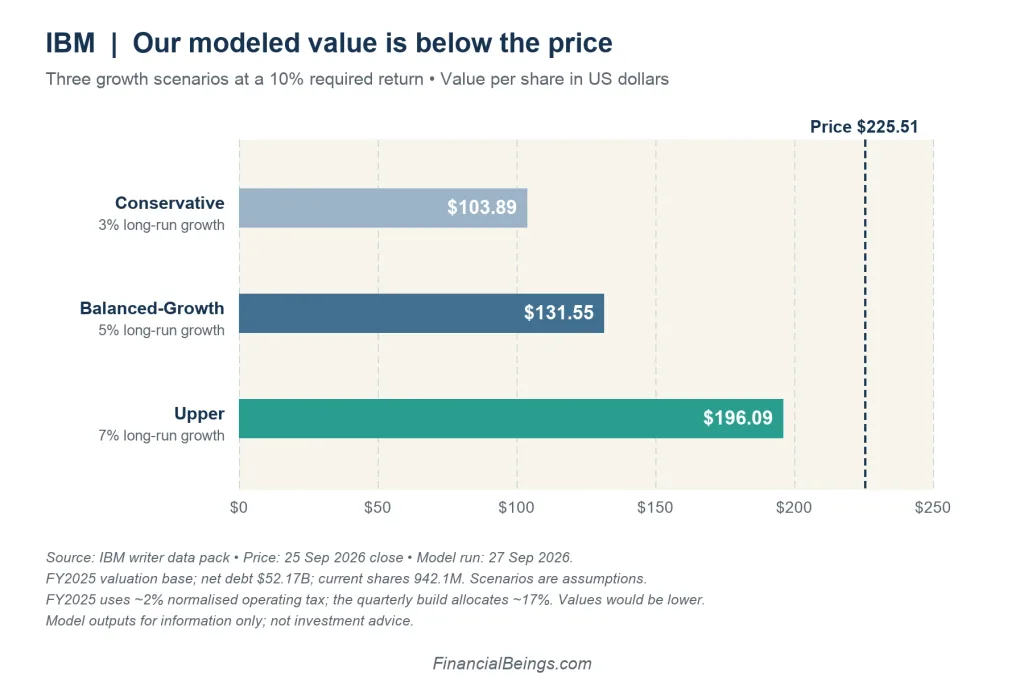
At $225.51 on 25 September 2026, the price asks for about 7.5% annual growth in IBM’s excess operating profit, far into the future. Our modeled value is $131.55 a share at 5% growth, within a $103.89–$196.09 range for 3%–7% growth. Every value in that range is below the 25 September price.
| IBM snapshot | As of 25 September 2026 |
| Share price | $225.51 |
| Market capitalisation | $212.46 billion |
| Change since 31 December 2025 | −23.9% |
| Change over 12 months | −20.7% |
The price changes are from the FinancialBeings price series; the 12-month comparison starts at the 26 September 2025 close.
What IBM Earns on Its Operating Capital
Return on Operating Assets (RNOA = PM × ATO)
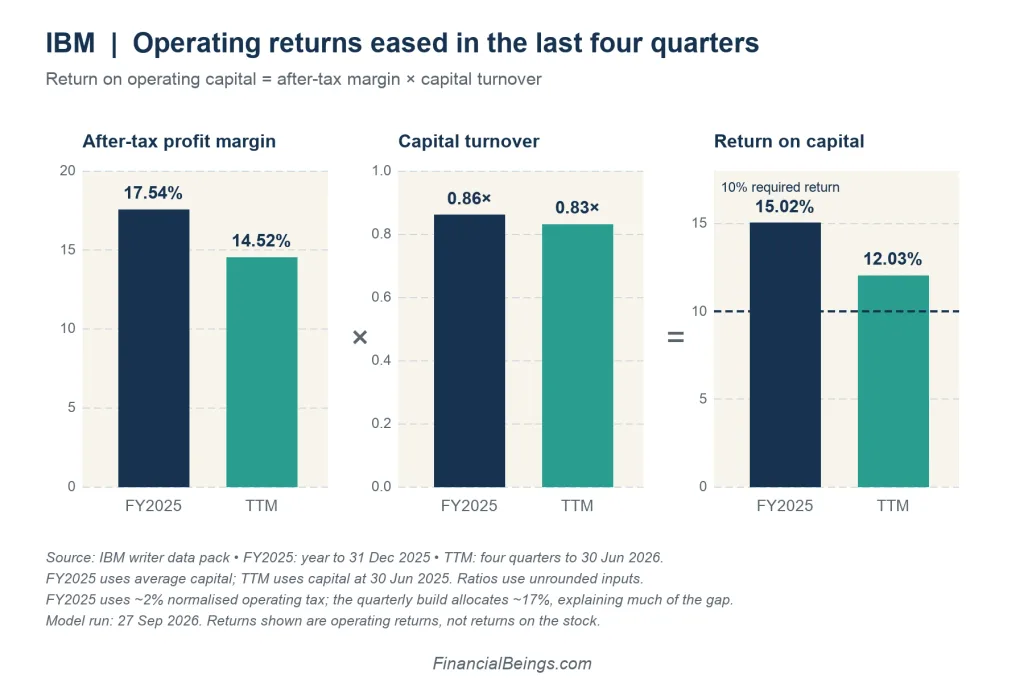
Think of operating capital as the kitchen IBM needs to serve customers. Profit margin tells us how much after-tax operating profit it keeps from each dollar of sales. Capital turnover measures sales per dollar invested in that kitchen; multiply margin by turnover and we get return on operating capital.
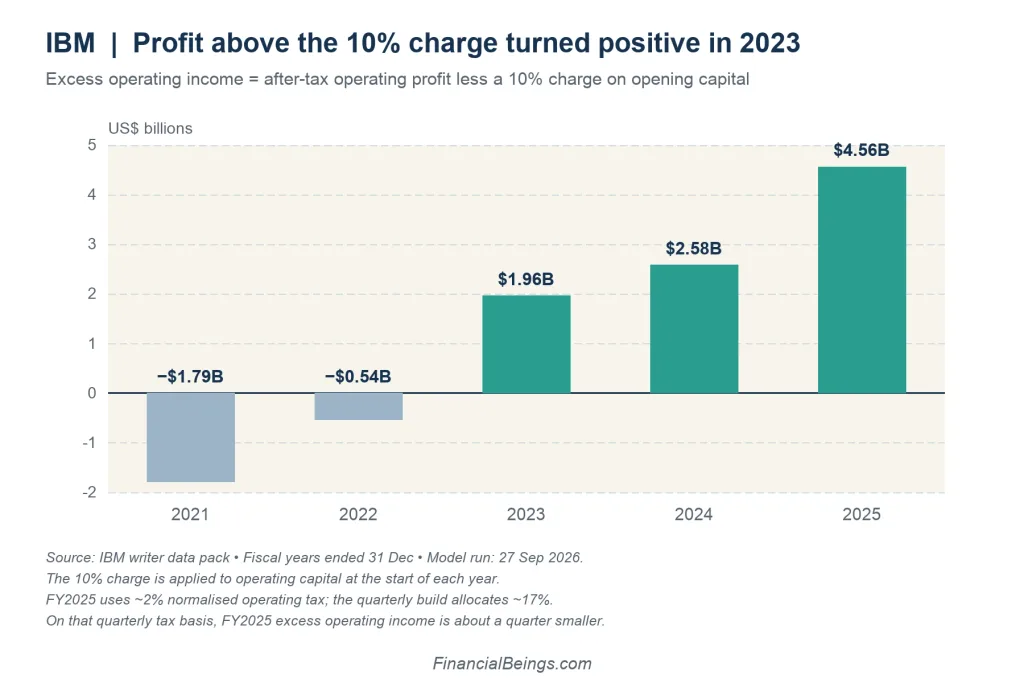
In fiscal 2025, IBM kept 17.5 cents of after-tax operating profit per $1 of revenue and turned its average capital 0.86 times. Its 15.0% return cleared our 10% required return. The profit left after that charge, which we call excess operating income, reached $4.56 billion.
For the four quarters to 30 June 2026, the return was 12.0%. That still clears the bar, but it is lower: capital grew faster than sales, and these quarters carry a fuller tax charge than the normalised 2025 annual figure. The June quarter’s annualised 11.0% return is one quarter’s reading, not a forecast.
| Year to 31 December | Revenue | Margin | Turnover | Return | Excess profit |
| 2021 | $57.35B | 9.55% | 0.82× | 7.81% | −$1.79B |
| 2022 | $60.53B | 10.28% | 0.89× | 9.15% | −$0.54B |
| 2023 | $61.86B | 14.22% | 0.89× | 12.71% | $1.96B |
| 2024 | $62.75B | 15.26% | 0.88× | 13.41% | $2.58B |
| 2025 | $67.53B | 17.54% | 0.86× | 15.02% | $4.56B |
FinancialBeings model. Annual turnover and return use average operating capital; excess profit charges capital at the start of the year. Trailing return uses capital a year earlier, and the latest-quarter return is annualised. The 2025 annual tax treatment is discussed below.
IBM has become more profitable: excess operating income has risen every year since 2020, and the 2025 margin was the highest in our 2017–2025 record. Yet turnover has edged down from 0.89 times in 2022–2023 to 0.86 times in 2025. The business earns more on each sale while requiring more capital to produce those sales.
IBM’s Balance Sheet Is Almost All Acquisitions
At the end of 2025, IBM had $67.72 billion of goodwill and $11.39 billion of net intangible assets: together, $79.11 billion, or 93% of its $84.91 billion in net operating assets. Property, plant and equipment stood at $5.90 billion. Net operating assets are operating assets less operating liabilities, so this 93% compares acquired assets with a net capital figure.
The practical point is that acquired capital must earn the same 10% charge as any other capital in our model. A 58.2% gross margin in 2025 therefore does not translate into a 58% return on all the capital committed to the business.
What IBM’s Q2 2026 Results Actually Show
The June 2026 quarter in our numbers covers the three months to 30 June 2026. Revenue rose 1.1% from a year earlier to $17.16 billion, and after-tax operating income edged up 0.9% to $2.51 billion. Operating capital, meanwhile, rose 11.1% to $92.64 billion.
That helps explain why the quarter’s annualised return declined from 12.1% to 11.0%, and why excess operating income fell 49% to $0.22 billion. A larger capital base needs more operating profit to maintain the same return.
Software
IBM reported software revenue growth of 5% in the quarter to 30 June 2026. This is IBM’s segment result, distinct from our reformulated operating-profit figures (IBM, 22 July 2026). For how other software leaders are priced, see our Microsoft vs Adobe stock comparison.
Infrastructure
IBM reported infrastructure revenue down 7% and IBM Z revenue down 42% for the same quarter. Those company figures describe where revenue changed; our return calculation measures what the enlarged operating capital earned (IBM, 22 July 2026).
Cash Flow and the Dividend
Our fiscal 2025 XBRL build shows $13.19 billion of cash from operations and $1.09 billion of capital spending, or $12.10 billion of free cash flow on our basis. At the 25 September 2026 market capitalisation, that is a 5.7% historical cash-flow yield. IBM declared a $1.69 quarterly dividend in its July 2026 release, equivalent to $6.76 annualised; at $225.51, the indicated yield is about 3.0% (IBM, 22 July 2026). To see how that compares, read our review of the highest dividend-paying stocks in the world.
Is IBM Stock Undervalued? It Depends Which Earnings You Use
A screen using IBM’s reported profit for the four quarters to 30 June 2026 shows a 19.8 times price-to-earnings multiple. That figure includes a large December 2025 quarter gain. Remove the gain and our estimate rises to about 24 times.
Value the entire operating business using 30 June 2026 net debt of $58.10 billion and trailing after-tax operating income, and the multiple is 27.0 times. These are different earnings and debt bases, so the three multiples answer different questions. The same trap appears in our Apple vs Google stock analysis, where Google’s headline multiple hides a much higher one.
| Four quarters to 30 June 2026 | FinancialBeings measure |
| Reported net income | $10.73 billion |
| After-tax operating income | $10.03 billion |
| Price / reported earnings | 19.8× |
| Price / reported earnings, gain removed | about 24× |
| Enterprise value / operating income | 27.0× |
IBM’s reported earnings for the December 2025 quarter include a one-off gain of about $1.9 billion that we leave out of operating income. The $1.9 billion is our inference from the usual gap between reported and operating income, not a figure IBM reported separately. IBM reported a $1.4 billion income-tax benefit in that quarter and attributed its 2025 tax benefit primarily to the resolution of certain tax audit matters (IBM, 28 January 2026). A one-off item reshaped the multiple in our Netflix intrinsic value 2026 analysis too.
| Quarter | Reported earnings | After-tax operating income | Gap |
| Q3 2025 | $1.74B | $2.05B | −$0.30B |
| Q4 2025 | $5.60B | $3.97B | +$1.63B |
| Q1 2026 | $1.22B | $1.50B | −$0.28B |
| Q2 2026 | $2.17B | $2.51B | −$0.35B |
| Four quarters to 30 Jun 2026 | $10.73B | $10.03B | +$0.69B |
FinancialBeings quarterly build; gaps use underlying unrounded figures. In a normal quarter, the gap is roughly −$0.3 billion, chiefly interest on debt. The December 2025 positive gap is the exception.
What Growth Is Already Priced Into IBM Stock?
Start with the 25 September 2026 market capitalisation of $212.46 billion and add $52.17 billion of net debt including leases at the end of 2025. The resulting $264.63 billion enterprise value is what the market pays for IBM’s operating business. Against $84.91 billion of year-end operating capital, that is $3.12 for every $1 of capital.
Price attributed to growth is the share price less our no-growth value. At $225.51 a share, subtracting $83.81 leaves $141.70. Dividing that difference by the share price gives 62.84%, rounded to 62.8%. In our model, about $63 of every $100 paid for IBM at that date is attributed to future growth in excess operating profit. For comparison, growth makes up an even larger share of the price in our Google intrinsic value 2026 analysis.
The no-growth figure uses 934.7 million shares at the end of 2025. The scenario values below use 942.1 million current shares, matching the workbook’s separate conventions.
| Date | IBM price | Growth implied by price | Price attributed to growth |
| 31 Dec 2025 | $296.21 | 8.13% | 71.7% |
| End-Feb 2026 | $240.21 | 7.62% | 65.1% |
| 30 Jun 2026 | $281.21 | 8.02% | 70.2% |
| 31 Jul 2026 | $223.65 | 7.41% | 62.5% |
| 25 Sep 2026 | $225.51 | 7.46% | 62.8% |
FinancialBeings model on the fiscal 2025 operating base and the dated closes shown. The model eventually moves excess profit growth toward roughly 4%, its long-run economy assumption.
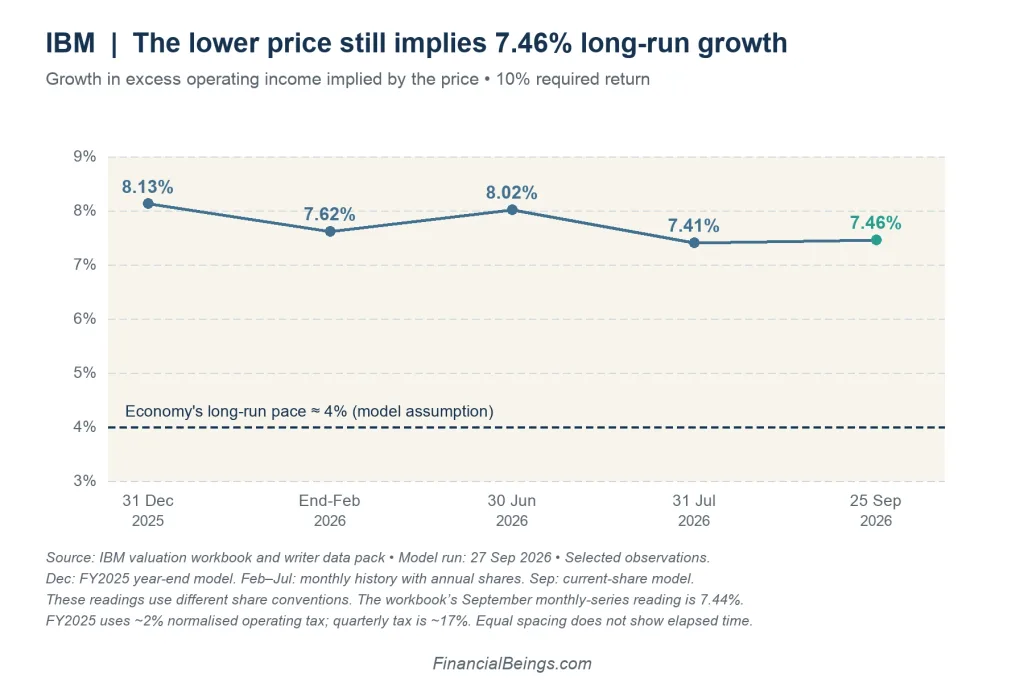
The 23.9% decline in price since year-end removed only 0.67 percentage points from the growth the price implies. July’s 7.41% was the lowest monthly reading in our post-2019 series, yet the September reading still stood well above the model’s long-run economy pace. A small change in the implied growth rate moves value sharply when that rate approaches the 10% required return.
The Growth Sensitivity Ladder
The scenarios below use a 10% required return and change the long-run growth assumed for excess operating income. They are modeled values, not forecasts of where the share price will trade.
| Long-run growth | Scenario | Enterprise value | Our modeled value / share | % of $225.51 |
| 2% | Sensitivity | $141.9B | $95.25 | 42% |
| 3% | Conservative | $150.1B | $103.89 | 46% |
| 4% | Sensitivity | $160.9B | $115.42 | 51% |
| 5% | Balanced-Growth | $176.1B | $131.55 | 58% |
| 6% | Sensitivity | $198.9B | $155.75 | 69% |
| 7% | Upper | $236.9B | $196.09 | 87% |
| 7.46% | Price-implied | $264.6B | $225.51 | 100% |
| 7.5% | Sensitivity | $267.3B | $228.35 | 101% |
| 8% | Sensitivity | $312.9B | $276.75 | 123% |
| 8.5% | Sensitivity | $388.9B | $357.42 | 158% |
FinancialBeings model, 27 September 2026 run. Scenario value per share equals enterprise value less fiscal 2025 net debt of $52.17 billion, divided by 942.1 million current shares; percentages use the $225.51 price at 25 September 2026.
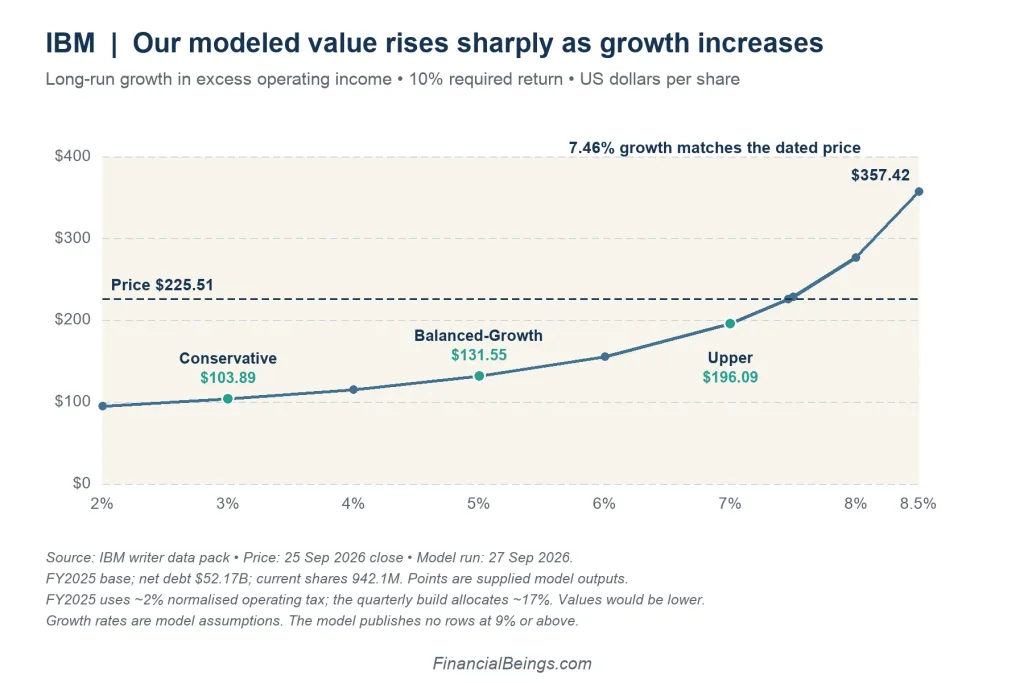
The move from 7% to 8% growth raises our modeled value from $196.09 to $276.75, about 41%, for one percentage point of additional growth. That is why a range is more honest than a single number. At the current price, break-even growth is 7.46%.
What would have to be true if growth slowed? With no growth, IBM would need roughly a 31% return on operating capital to support the September price. At a return near 21%, it needs about 5% growth. IBM’s 2025 return was 15.0% on average capital, and its best annual return in our record was 19.8% in 2018. IBM’s price is a bet on return, not just on growth.
The return-versus-growth grid uses a 15.4% valuation anchor calculated on year-end capital, rather than the 15.0% headline return on average capital. At a return equal to the 10% required return, IBM creates no excess operating profit; no growth rate in that grid supports the September price.
The Case Against Then the Case For
The 2025 tax treatment lifts the headline value. Our 2025 figures use a normalised operating tax rate because IBM’s booked 2025 tax was a net benefit; on the tax our quarterly figures allocate, IBM’s 2025 excess operating income is about a quarter smaller, and our values would be lower.
On that alternative tax estimate, the 5% growth value is about $105 and break-even growth is about 8.15%, versus $131.55 and 7.46% on the published model base. The alternative values are estimates from the model figures, not outputs of the published run.
Capital has outgrown sales. In the quarter to 30 June 2026, operating capital rose 11.1% year on year while revenue rose 1.1%. Annualised capital turnover slipped from 0.82 to 0.75 times, and the return fell from 12.1% to 11.0%.
Debt and acquired assets increase the burden on future returns. Net debt rose from $52.17 billion at 31 December 2025 to $58.10 billion at 30 June 2026. Goodwill and intangibles were 93% of year-end 2025 operating capital. In the 2017–2025 record, excess operating income fell in 2019 and 2020.
The case for starts with measurable improvement. The 2025 after-tax operating margin was the highest in our 2017–2025 record, and excess operating income has increased every year since 2020. The 25 September 2026 price also asks for less growth than the price did at the end of 2025, though the remaining expectation is still demanding.
So Is IBM a Good Stock to Buy? Our Verdict
The business is improving; the price still asks for more than the business shows.
IBM is a better business than it was — on a generous tax reading. In the year to 31 December 2025, its margin rose to 17.5%, excess operating income reached $4.56 billion, and return on operating capital was 15.0%. In the four quarters to 30 June 2026, return was 12.0%, with a fuller tax charge and more capital at work.
The price is closer to what the business can support — on one condition. Our 5%-growth modeled value represented 44% of the 31 December 2025 price and 58% of the 25 September 2026 price. The condition is that IBM lifts its return toward roughly 21% while keeping the new capital productive.
On our 10% required return, the September price has no margin of safety. It implies 7.46% long-run growth in excess operating income, and every modeled value through 7% growth is below $225.51. That is a condition in the price, not a prediction of the next quote.
| Lens | IBM reading | What it says | Data period |
| Return on capital | 15.0% | 5.0 points above required return | FY2025 |
| Trailing return | 12.0% | Above the bar; lower than FY2025 | To 30 Jun 2026 |
| After-tax margin | 17.5% | Highest in 2017–2025 record | FY2025 |
| Capital turnover | 0.86× | Below 2022–2024 | FY2025 |
| Excess operating income | $4.56B | Rising each year since 2020 | FY2025 |
| Growth implied by price | 7.46% | Near series low since 2019 | 25 Sep 2026 |
| Growth versus history | 8.45%–8.53% | Higher at prior year-ends | 2023–2024 |
| Modeled value at 5% | $131.55 | 58% of dated price | 25 Sep 2026 |
| Modeled 3%–7% range | $103.89–$196.09 | 46%–87% of dated price | 25 Sep 2026 |
| Return needed at 5% growth | about 21% | Above FY2025 return | FY2025 base |
| Price attributed to growth | 62.8% | Down from 71.7% at end-2025 | 25 Sep 2026 |
Data as of: share price and implied growth, 25 September 2026 close; annual operating figures, fiscal year ended 31 December 2025; trailing and latest-quarter figures, to 30 June 2026.
What Would Have to Be True
| Reader’s focus | Condition to examine | Basis |
| Income | The dividend uses about half of historical free cash flow; future coverage still depends on cash generation. | FY2025 cash flow; $6.76 annualised dividend |
| Growth | The price requires about 7.5% annual growth in excess operating profit, far into the future. | $225.51 at 25 Sep 2026 |
| Value | A return near 21% would reduce the growth needed to about 5%. | FY2025 model base; 25 Sep 2026 price |
What to Watch
A stronger operating case would show four-quarter return back above roughly 15% with the enlarged capital base, and excess operating income growing faster than the 7.5% annual rate implied by the September price. A return below 10% while capital keeps outgrowing sales would weaken it. The next check is IBM’s Q3 2026 report; IBM currently lists 21 October as a preliminary date (IBM investor events, checked 28 September 2026).
On our numbers, IBM is a better business than it was: in 2025 it earned 15.0% on its operating capital — its best since 2018 — and its profit above a 10% cost of capital has grown every year since 2020. But even after a 24% fall this year, at $225.51 (25 September 2026) the price still asks for about 7.5% growth a year in that excess profit, far into the future — nearly twice the economy’s long-run pace. The gap closes mainly if IBM lifts its return towards 21% while its capital stops outgrowing its sales. On our 10% bar, the price carries no margin of safety. This is not investment advice.
Frequently Asked Questions
Is IBM a good long-term investment?
On our numbers IBM earned 15.0% on its operating capital in 2025, above our 10% bar, and its excess profit has grown every year since 2020. But at $225.51 the price asks for about 7.5% growth a year, far into the future — nearly twice the economy’s pace. Not investment advice.
Why did IBM stock crash in July 2026?
IBM fell about 20% over July 2026 in our month-end prices ($281.20 to $223.70). In our numbers the June quarter showed sales up 1% while the capital running the business rose 11%, so its return slipped to 11.0% annualised. For IBM’s own explanation, see its Q2 2026 release.
What is IBM’s dividend yield?
About 3.0% at the $225.51 price on 25 September 2026. IBM’s $1.69 quarterly dividend declared in July 2026 is equivalent to $6.76 annualised. Paying it uses roughly half of the $12.10B of free cash flow in our 2025 figures.
Is IBM stock undervalued?
Not on our 10% bar. At $225.51 the price asks for 7.5% long-run growth in excess operating income — nearly twice the economy’s pace. Our value at 5% growth is $131.55, or 58% of the price; even at 7% growth it is 87%. Not investment advice.
Is IBM a quantum computing stock?
Quantum computing does not show up in IBM’s reported numbers yet. What our figures do show: about 63% of today’s price is a bet on growth that has not happened. Quantum is one of the hopes inside that 63%. IBM’s own filings describe the programme.
What growth is priced into IBM stock?
About 7.5% a year, far into the future, in the profit IBM earns above a 10% cost of capital (at $225.51, 25 Sep 2026). That is down from 8.1% at the end of 2025 and close to its lowest since 2019 — but still nearly twice the economy’s long-run pace.
Is IBM a good stock to buy after the 2026 crash?
The 25 September 2026 price of $225.51 implies 7.46% annual growth in excess operating profit. At 3%–7% growth, our modeled values are $103.89–$196.09 a share, all below that price. The main condition is a higher return on IBM’s operating capital. This is not investment advice.
Sources
FinancialBeings IBM writer data pack, condensed, 27 September 2026: model outputs, price series, scenario values and editorial conventions.
IBM second-quarter 2026 earnings release, 22 July 2026
IBM fourth-quarter 2025 earnings release, 28 January 2026
