

September 18th was a relatively calm trading day for the s&p 500 index. As reported by bloomberg, the s&p 500 closed at approximately 7,650 on that day. Moreover, the “fear gauge,” also known as the VIX, measured at 14.81. To all outward appearances, it seemed as though it were business-as-usual.
However, in that same trading session, shares of Coinbase rose approximately 11.7 percent, while Sandisk rose approximately 11 percent. This large disparity in performance — a quiet s&p 500 index versus wildly swinging individual Stocks — is precisely why high-Volatility Stocks within the s&p 500 are worth examining.
This article will rank the most volatile stocks in the S&P 500 based upon actual numbers and define what “volatility” represents. Additionally, beyond listing the high-volatility names commonly provided, I will examine each of their respective contributions toward creating positive economic value as well as negative.
There are no price targets offered nor any “buy/sell” recommendations made. Only data and a layman’s explanation of how that data reflects the underlying performance of such high-Volatility names during a seemingly tranquil period for the overall s&p 500.
Defining “Volatility”?
“Volatility” refers to how much a stock’s price fluctuates. Therefore, a highly volatile stock experiences large fluctuations, whereas a non-volatile stock’s price changes very little over time. However, there are two different methods for measuring the degree to which a stock’s price moves. Confusion arises when these two distinct methodologies are utilized interchangeably.
Defining “beta”
Beta is the most commonly referenced method for comparing the movements of a particular stock’s price to that of the entire market (i.e., the s&p 500). The market itself has a beta of 1.0. A stock with a beta of 1.0 generally moves in conjunction with the movement of the s&p 500. Conversely, a stock with a beta of 1.5 typically increases or decreases by 50% more than the market.
For example, if the s&p 500 rises by 1%, a stock with a beta of 1.5 may increase by approximately 1.5%. Similarly, if the market declines by 1%, a stock with a beta of 1.5 would likely decline by approximately 1.5%. A beta of 2.0 effectively multiplies the market’s movements by 100% in either direction. Larger betas represent greater Volatility and have benefits and drawbacks.
Defining Volatility versus defining beta – not identical concepts
While Volatility measures a stock’s overall price swings regardless of cause, beta measures only the portion of a stock’s movement caused by the broader market. An extreme example illustrates this point: a company could experience enormous price swings due to internal events such as a new product release, lawsuit, etc.
However, since those events were internal rather than related to market-wide activity, the stock would be classified as low-beta despite being highly volatile. Thus, when referring to a “high-beta” stock, it indicates that it exaggerates general market movement. Conversely, when describing a “volatile” stock, it may indicate nothing more than erratic behavior unassociated with market-wide trends.
Top ten most volatile s&p 500 Stocks by beta (mid-september)
According to my analysis performed on mid-september (2026), the top ten most volatile Stocks within the s&p 500 based upon beta rankings include several familiar companies. As a note regarding interpreting the ranking: four of the ten most volatile Stocks listed above (Sandisk, Coinbase, Robinhood and AMD) also appear on Invesco’s s&p 500 high-beta index (SPHB), an entirely independent methodology for determining beta rankings.
These four companies have strong evidence supporting their status as high-beta Stocks. The remaining six companies exhibit high-beta characteristics on wallstreetzen’s screening methodology alone; therefore, view them as “high-beta according to this screen”, not absolute truth.
| # | Company | Ticker | Beta | Independent cross-check |
| 1 | Carvana | CVNA | 2.90 | WallStreetZen only |
| 2 | Sandisk | SNDK | 2.89 | High — both methods |
| 3 | Coinbase Global | COIN | 2.75 | High — both methods |
| 4 | Qnity Electronics | Q | 2.65 | WallStreetZen only |
| 5 | Marvell Technology | MRVL | 2.38 | WallStreetZen only |
| 6 | Block | XYZ | 2.26 | WallStreetZen only |
| 7 | Robinhood Markets | HOOD | 2.24 | High — both methods |
| 8 | AppLovin | APP | 2.23 | WallStreetZen only |
| 9 | Monolithic Power | MPWR | 2.19 | WallStreetZen only |
| 10 | Advanced Micro Devices | AMD | 2.18 | High — both methods |
Beta as of mid-September 2026 (WallStreetZen). Cross-check = whether the name also appears high-beta on Invesco’s SPHB index.
Atop the list is clearly reflective of contemporary market anxieties. Atop this list are Carvana (beta of 2.90) and Sandisk (2.89), followed closely by Coinbase (2.75). Carvana’s price swings stem directly from its debt-laden, boom-or-bust business model centered upon purchasing and reselling used vehicles.
Sandisk’s price movements reflect the historically cyclic nature of memory chips. Price swings for Coinbase are influenced primarily by price movements associated with cryptocurrency. Add to this mix semiconductor/AI hardware companies (qnity, Marvell systems inc., Monolithic Power and AMD) and fintech companies (block, Robinhood and AppLovin) and the underlying theme becomes increasingly apparent — which is the focus of the next section.
Why do those Stocks move so much?
There are two main industries
When you look closer at this “most volatile” list, there are essentially two large industries represented under the guise of nine different ticker symbols. The first is chips and AI hardware — Sandisk, Qnity Electronics, Marvell, Monolithic Power systems, and AMD.
These businesses have dramatic fluctuations based on the ebbs and flows of supply and demand and inventory glut / surpluses. Because they operate in an extremely boom-bust environment due to the rapidly increasing spending on artificial intelligence (AI), their earnings per share (eps) and stock price will fluctuate dramatically.
The second is crypto & fintech — Coinbase, Block, Robinhood, and AppLovin. As a group, these businesses’ earnings and stock price movements are directly tied to trading volume, cryptocurrency prices, and investors’ willingness to take risks, a dynamic we also explored in our crypto vs stock market comparison.
If your business has cyclicality or is driven by investor sentiment, high beta is a normal byproduct.
The market still throws punches
Stocks move individually because the entire market periodically makes big moves. For example, on june 5th, 2026, the s&p 500 fell 2.63%. It was its largest single-day decline for the calendar year. Therefore, if the s&p 500 fell 2.63%, a stock with a beta of 2.5 did not fall 2.6%. A stock with a beta of 2.5 could easily drop anywhere from 6-10% during that type of extreme down-day.
This illustrates what i call the double-edged sword of beta. High-beta Stocks offer you large returns during green days and potentially significant losses on red days. The moves you observe aren’t random – they are simply the markets own moves amplified.
Volatility doesn’t necessarily mean value creation
While almost every article regarding the “most volatile” Stocks stops after ranking them by beta, we believe that leaves out perhaps the best question one could ask about the most active companies: among these rapidly changing businesses, which are creating actual value and which are merely moving? To determine this, we ranked the same ten names using residual operating income (ReOI) – a metric for measuring economic profits.
Simply stated, ReOI measures if a business generates more than the total costs associated with the capital used. If a company generates positive ReOI then it is generating enough revenue to cover its costs of capital and therefore generate economic profits. Conversely, if a company generates negative ReOI, it indicates that it is generating less than the required cost of capital and thus destroying economic value regardless of how well it appears on paper.
How the value-creation figures are calculated
| Measure | Formula | Applies to |
|---|---|---|
| ReOIₜ (Residual Operating Income) | Sustainable OIₜ after tax − r × NOAₜ₋₁ | All nine operating-model names |
| REₜ (Residual Earnings) | Net incomeₜ − r × Common equityₜ₋₁ |
| # | Company (Ticker) | ReOI ($B) | Sust. RNOA | Verdict |
| 1 | Sandisk (SNDK) | +9.91 | 111.1% | Creates value |
| 2 | AppLovin (APP) | +3.33 | 91.1% | Creates value |
| 3 | Robinhood (HOOD) | +1.09 | 23.6% | Creates value |
| 4 | Carvana (CVNA) | +0.93 | 25.7% | Creates value |
| 5 | Coinbase (COIN) | +0.60 | 20.6% | Creates value |
| 6 | Monolithic Power (MPWR) | +0.37 | 27.8% | Creates value |
| 7 | Qnity Electronics (Q) | −0.08 | 9.3% | Destroys value |
| 8 | Block (XYZ) | −0.50 | 7.3% | Destroys value |
| 9 | Marvell (MRVL) | −0.55 | 6.7% | Destroys value |
| 10 | Advanced Micro Devices (AMD) | −2.50 | 5.4% | Destroys value |
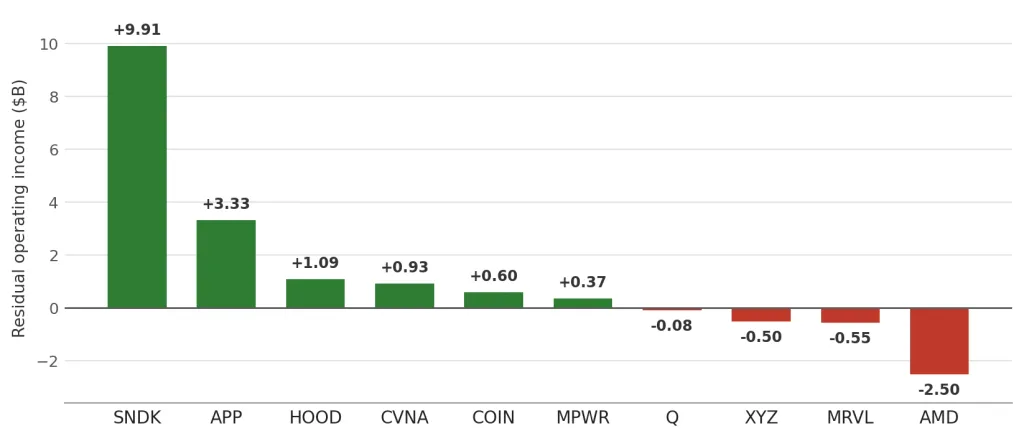
Green = covering the cost of capital and creating economic value. Red = returns fall short of the cost of capital.
When viewed through this lens, our data shows that sandisk leads both rankings – highest beta and also generated the largest amount of economic profit ($9.91 billion). Furthermore, AppLovin ($3.33 billion) and Robinhood ($1.09 billion) generated actual economic value. However, the reverse situation occurs at the bottom. Of the top ten names listed in terms of beta, AMD is among the lowest and also destroyed the most economic value (- $2.5 billion). Additionally, Block and Marvell swung from being a “high-beta” stock to a value destroyer.
In summary, while the most exciting stock may seem to be the one producing the largest profit margins, it does not necessarily mean that such a stock produces more true value creation than another company. Similarly, while some of the lower-beta names on a volatility list may appear to be stable or uneventful, it does not preclude those companies from having the potential to destroy wealth for shareholders.
We do have two legitimate caveats to consider here. first, we utilized a slightly modified model to score Robinhood’s ReOI (residual income on equity vs. Residual operating income); therefore, we cannot compare its $1.09 billion in ReOI to other names on the list without caution.
Second, we recognize that Sandisk’s impressive performance (a 111% sustainable return and a +949% ReOI growth rate) reflects a sharp upswing in the memory-chip cycle, driven by a sudden surge in AI-related spending on memory, a cycle we also examined in our Micron vs Broadcom comparison; therefore, we view this as a temporary spike in performance rather than a long-term trend. While we acknowledge both caveats above, combining “how volatile is it?” With “does it create actual economic value?” Provides a critical layer of insight into a company’s overall investment profile that simply examining beta alone cannot provide.
Do the individual stock prices reflect the broader market trends?
Looking at the big picture, however, the overall market trends are surprisingly uneventful. The VIX — wall streets volatility indicator — was at 14.81 on September 18, 2026. This is significantly lower than its high of 35.30 during March 2026, and slightly higher than its 52-week low of 13.38 in December 2025.
A low VIX indicates that option traders believe that the broad market will continue to trend smoothly. Therefore, there has been a classic split-screen market — a slow-moving index, while a few high-beta companies such as chip companies and fintech names swing up to double-digit values daily. Average market activity has been calm; extreme price movements have occurred.
How to find volatile Stocks using free tools
There is no cost associated with finding the most volatile Stocks using Two free tools: wallstreetzen provides a high-beta screener where you can order US-listed equities by their beta level from highest to lowest and Yahoo Finance displays a beta metric for any equity’s summary or statistics page along with other basic metrics. However, you should note that these screeners contain all US-listed equities by default, not just those included in the s&p 500.
To find only the most volatile equities included in the s&p 500, add an additional filter for membership in the s&p 500 index (or cross reference the results with the list of currently included equities in the s&p 500 index). Additionally, since beta is based upon data from a trailing time period (i.e., the last year), it can vary depending upon the date you pull the information. Pull the latest information available for your needs.
Should i buy volatile Stocks?
Although this article is intended as educational material, it is not intended to serve as investment advice. Rather than provide you with a recommendation, i will present the pros and cons of investing in volatile Stocks in simple language. While high-beta Stocks tend to follow the overall market direction more closely and therefore amplify the returns of the market in either direction — delivering larger-than-average returns in a rising market and larger-than-average declines in a declining market — they also require conviction and patience to hold through various market conditions. High-beta Stocks do not reward investors who sell quickly during a downturn and penalize investors who sell too early due to fear of loss.
Investors typically manage risk with high-beta Stocks by diversifying into lower-beta, defensive equities. Examples of defensive equities include relatively steady consumer staple names such as General Mills (GIS) or Campbell Soup Company (CPB), which rarely move in step with the broader market, and many investors pair them with other best dividend stocks to buy for steadier income. The high-beta equities provide the explosive growth opportunities; the lower-beta equities provide the cushion against large losses.
Your allocation between high-beta and lower-beta equities will depend upon your specific investment objectives, time horizon and your ability to withstand significant losses before you would consider selling at what may be an unfavorable price. That decision is yours alone and cannot be made by anyone else.
Conclusion
The three most volatile equities included in the s&p 500 index as of September 18, 2026 were Carvana (beta = 2.90), Sandisk (beta = 2.89), and Coinbase (beta = 2.75). These are primarily high-beta equities involved in various aspects of transportation (Carvana), memory chip manufacturing (Sandisk), and cryptocurrencies (Coinbase) that have historically demonstrated greater price variability than other equities in the s&p 500 index. Since beta levels can change over time due to changing valuations, use these rankings only as a snapshot and not as a long-term scorecard.
Frequently asked questions
Which of the s&p 500 equities has had the highest volatility?
As noted earlier, the rankings of volatility within the s&p 500 index can vary depending on your source and timing. However, Carvana, Sandisk, and Coinbase often rank at the top of lists of most volatile equities measured by beta. In my september 18th, 2026 ranking Carvana had a beta of 2.9.
Is tesla One of the most volatile s&p 500 companies?
While Tesla is certainly volatile (see our take on whether a Tesla stock crash is coming), it does not lead in beta among S&P 500 companies, since several chip and crypto-linked names have higher beta levels.
What does it mean when someone refers to “high” beta levels?
Beta represents only the portion of a stock’s movement that occurs as a result of market movements. There is no definitive number that defines “high.” However, generally speaking, a beta greater than approximately 1.5 is considered elevated, and greater than 2.0 is truly high. A stock with a high beta level tends to move at least twice as much as the underlying index.
Can a stock be volatile yet have low beta level?
Yes. Beta represents only how much a stock moves relative to other Stocks in the same index. A stock can exhibit high volatility due to factors such as changes in earnings, newsworthy events or a fluctuation in cryptocurrency prices and yet maintain a moderate beta level.
Sources
- WallStreetZen — High Beta Stocks screener (beta rankings)
- StockAnalysis — S&P 500 constituents list
- Invesco S&P 500 High Beta ETF (SPHB) — holdings, used as the independent beta cross-check
- CNBC — VIX quote page (market-volatility figures)
- Residual operating income (ReOI) model, FY2025–26 company filings — value-creation ranking
Beta figures verified against the WallStreetZen screener in mid-September 2026; VIX and index levels are as of September 18, 2026. Markets move daily — re-check the numbers before publishing.
