
Netflix Intrinsic Value in 2026: Why Estimates Run From $24 to $1,167 – and What NFLX Is Worth on the Returns It Earns Today
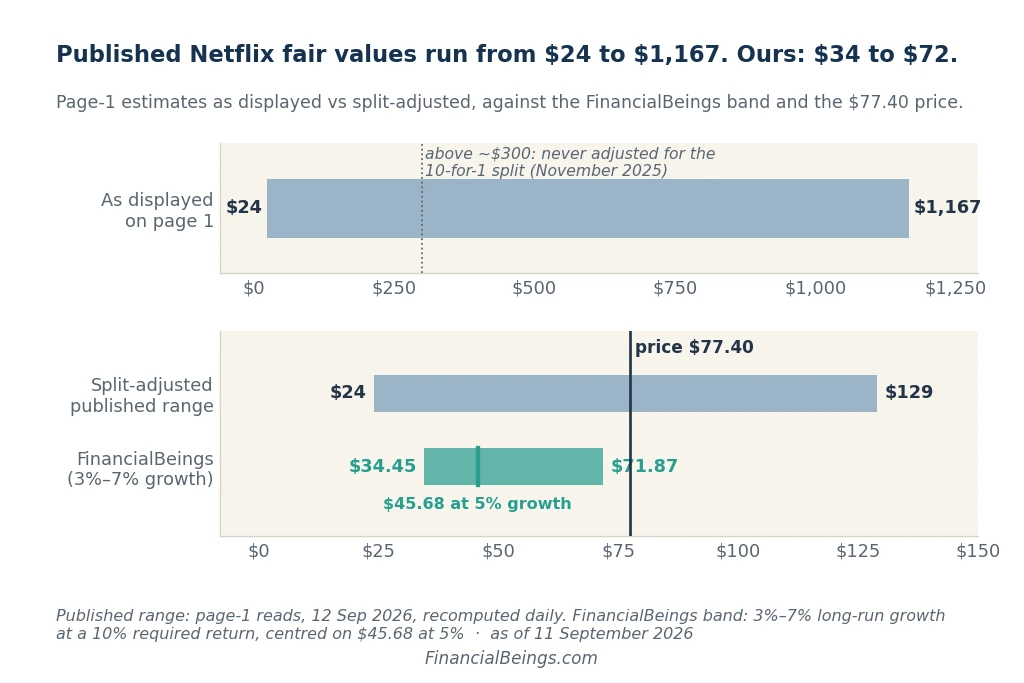
Type “Netflix intrinsic value” into Google and you will get chaos. According to one site, Netflix’s stock is worth $24. Another says $1,167. That’s not a rounding error, that’s a 48 fold difference between the low and high estimate from the same company on the same day.
If that leaves you more puzzled than when you started, you’re not the only one who has experienced that same “whiplash”. That’s where the tale of Netflix intrinsic value in 2026 begins to get interesting: most of this difference has a very easy explanation, and when you remove it, you’re left with a number you can believe.
What Is Netflix’s Intrinsic Value in 2026?
Let’s start with what “intrinsic value” even means. It’s a fancy term for a simple idea: what a business is actually worth, based on the cash it generates — separate from whatever the stock market’s mood happens to be that day. The market price can swing on rumors, hype, or panic. Intrinsic value tries to ignore all of that noise.
Here’s Netflix’s snapshot as of the 11 September 2026 close:
| Metric | Value |
| Share price | $77.40 |
| Market capitalization | $322 billion |
| P/E ratio (on reported earnings) | 23.6× |
| Business value ($330bn = market cap + $7.9bn net debt) ÷ operating earnings | 29.0× |
| Share price, year-to-date | −17% |
| Share price, trailing 12 months | −35% |
If it can be assumed that investors require a 10% return on the money invested in the business, then Netflix’s value lies somewhere between $34.45 and $71.87 per share. The mid-range estimate of $45.68 is found when there is a steady growth rate of 5% in the long term.
| Growth Scenario | Long-Run Growth Rate | Estimated Value |
| Conservative | 3% | $34.45 |
| Balanced-Growth | 5% | $45.68 |
| Upper | 7% | $71.87 |
Now, that’s compared to what the market is asking for now at $77.40 and the $24 to $1,167 that floats around online, and then you begin to visualize the picture! But why is the published range so ridiculously broad? That is the next question on which to ponder.
Why Do Estimates Range From $24 to $1,167?
Suppose that you had a large pizza and divided it into 10 equal pieces, and you told a friend that the price of each piece is 1/10 of the price of the whole pizza. You did not make the pizza smaller or less valuable, you simply divided it up differently.
It’s basically what Netflix experienced in November of 2025. The company split its shares into 10, meaning that each share is now priced at 1/10 of what it was. The business itself remained unchanged in any way. But many calculators and websites out there didn’t bother updating their math for the split. If you see any number over $300 in this section, it is a number of “intrinsic value” that was most likely compiled before the split, in other words, a leftover piece of pizza math that nobody re-calculated.
Take away those old numbers, and the published range narrows to a more plausible $24 to $129 (a 5-fold range, as opposed to 48-fold). The rest of the gap is due to different inputs into the models — and in some cases flawed inputs — for 2026 earnings. Which leads us to the true reason for extremes.
Why the Lowest and Highest Numbers Are Both Wrong
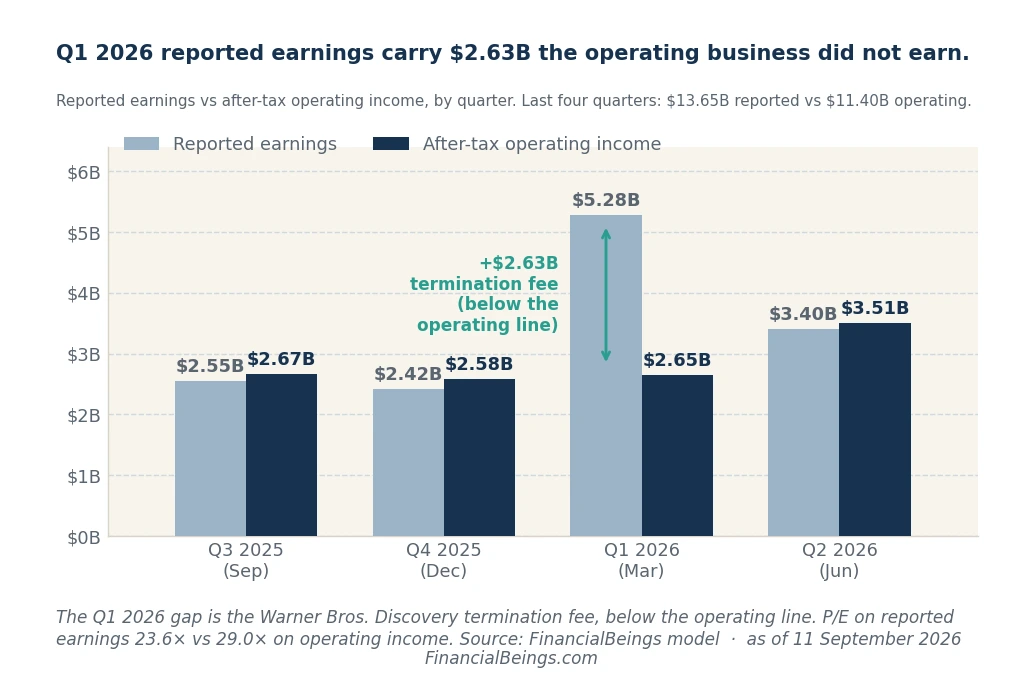
That’s where the confusion begins to make sense. Netflix’s reported earnings in the first quarter of 2026 were $5.28 billion. That sounds fantastic. However, its true operating business, the one that produces and airs shows, only made $2.65 billion after tax that quarter.
Where did the other $2.63 billion go? A one-off termination fee Netflix received when its agreement with Warner Bros. Discovery ended. The money does go into the books but it doesn’t necessarily tell you much about the actual profitableness of Netflix’s content business. It’s sort of like the case of a store owner who parts with his delivery van for a profit, even if the store isn’t making money.
| Period | Reported Earnings | Operating Earnings (excludes one-off items) |
| Q1 2026 | $5.28B | $2.65B |
| Trailing 4 quarters | $13.65B | $11.40B |
| Multiple: price ÷ reported earnings; business value ($330bn) ÷ operating earnings | 23.6× | 29.0× |
This year, any calculator that takes a “reported earnings” bet without considering it will see the value of Netflix inflated — a pattern that shows up almost identically in Meta’s Q2 2026 numbers, where one-time charges swing reported earnings the opposite direction. Much of the reason that the upper end of published ranges can be skewed. The more prudent way — and the method of this article — is to only consider the operating earnings, the real earnings of the streaming enterprise, excluding one-off windfalls. By design, that lens just can’t be fooled by a lucky check showing up in the mail.
Disney is the mirror image: its P/E ratio as reported, 21.4×, is higher than its operating P/E ratio of 15.9×, because Disney’s below-the-line items work against its reported earnings rather than for them. This reported-vs-operating P/E gap isn’t unique to media stocks either — we’ve seen the same distortion play out when comparing Apple and Google’s multiples, where one-off items pushed the two ratios in opposite directions.
What Does Netflix’s Operating Business Actually Earn?
Now we get to the heart of the matter — what is Netflix actually good at, mechanically, as a business?
All companies require cash to be invested in their operations, and for Netflix the most important operating capital is the huge collection of shows and movies that they have bought or licensed. The question which is asked is: How much profit does the company extract from that capital?
That answer comes from two ingredients multiplied together:
- Profit margin: how many cents of after-tax profit Netflix keeps out of every dollar of revenue.
- Capital turnover: how many dollars of revenue Netflix generates for every dollar tied up in its content library.
Margin times turnover equals return on operating capital — the true test of whether a business is worth more than what’s poured into it.
| Netflix — Full Year 2025 | Value |
| Revenue | $45.18B |
| After-tax operating profit | $11.49B |
| Operating capital (average) | $33.84B |
| Profit margin | 25.4% |
| Capital turnover | 1.34× |
| Return on operating capital | 34.0% |
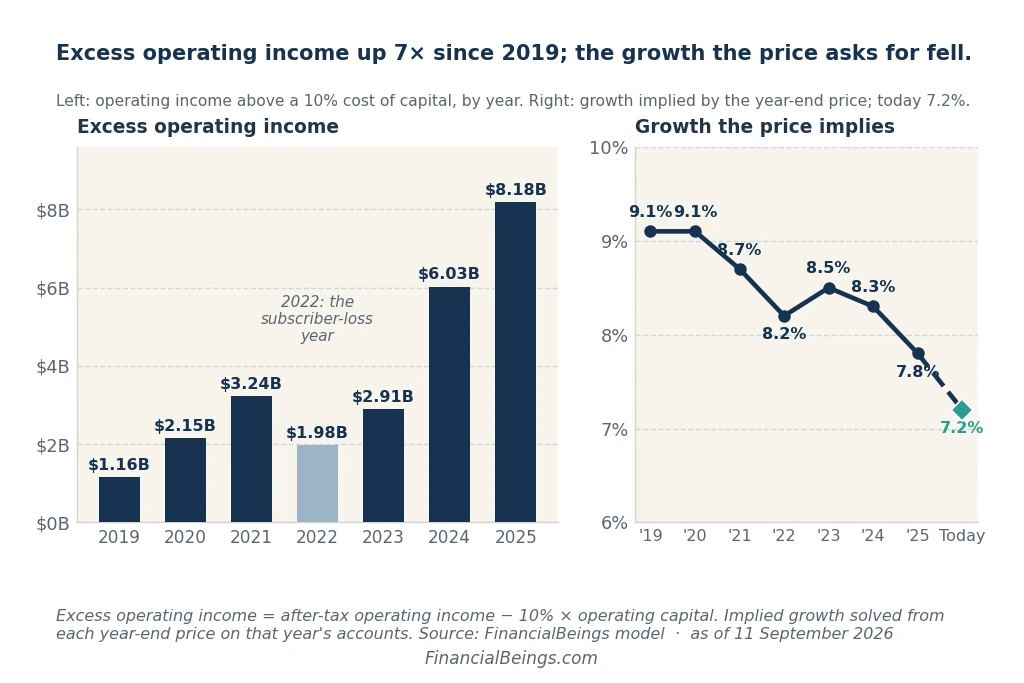
| Profit above a 10% cost of capital (“excess operating income”) | $8.18B |
In 2019, that same return was just 15.2%. This has more than doubled since — and just about all of that gain has been from margin, not squeezing more sales out of the content library. Netflix just became a better run company at making a profit on each dollar of revenue. The June 2026 quarter carried an annualized rate of 39.5%.
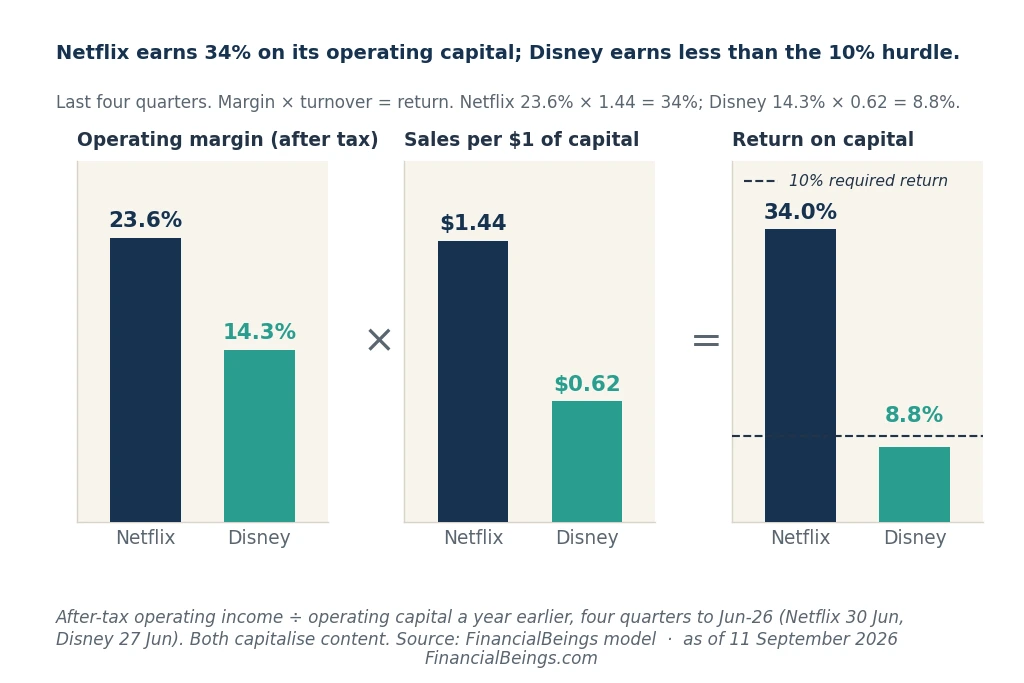
Now put that next to Disney, using the same math over the same recent four quarters:
| Last Four Quarters | Netflix | Disney |
| Profit margin | 23.6% | 14.3% |
| Capital turnover | 1.44× | 0.62× |
| Return on operating capital | 34.0% | 8.8% |
The accounting treatment of both companies’ content libraries is the same, so this is a true apples to apples comparison. Disney earns 8.8% on its operating capital — which is lower than the 10% a business needs to earn to be worth more than the capital in it. Netflix beats that mark by 24 percentage points.
We’ve run this same margin-times-turnover breakdown on other head-to-head matchups too, including Meta vs Nvidia analysis, where the gap in capital efficiency told a similarly one-sided story. Note one footnote: don’t be tempted to get an impression of this based on “return on equity” rather, because Netflix has been repurchasing a lot of its own stock, which makes ROE look artificially rosy. It doesn’t have that blind spot when it comes to return on operating capital.
What Growth Is the $77 Share Price Assuming?
Here’s the part most investors skip, and it’s the most important one: work backward from today’s price to ask what has to be true for that price to make sense. This hidden number is called a stock’s implied growth rate, and it’s the same thing we solve for every time we value a stock.
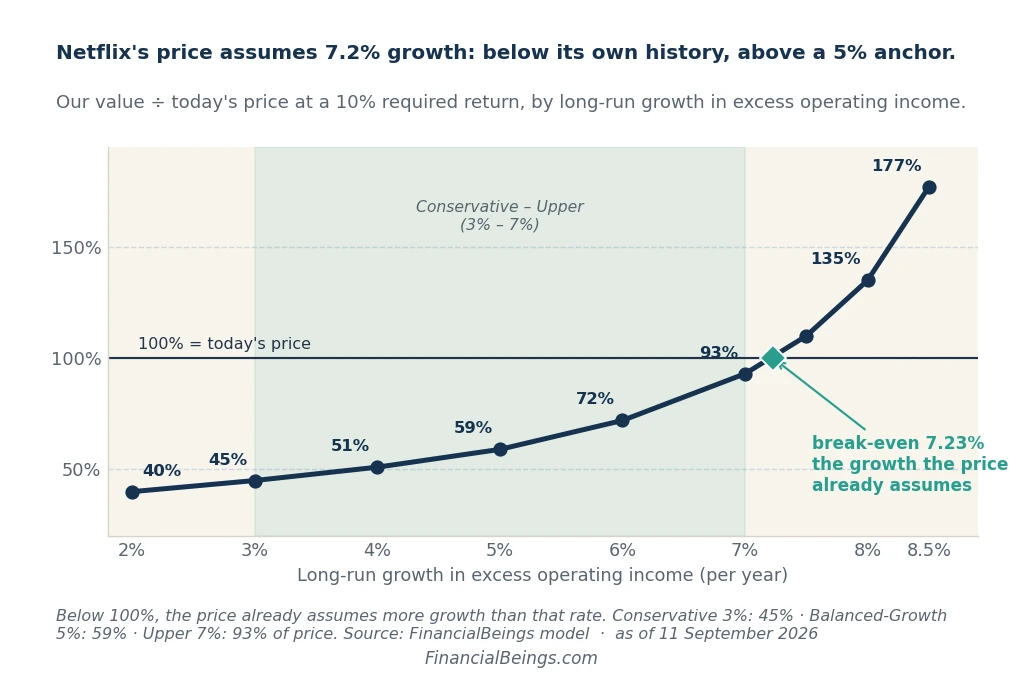
The market is betting that Netflix’s operating income — the profit over the 10% required return — will continue to grow at about 7.2% per year, forever, at $77.40. That’s the “implied growth rate,” and it’s hidden in all stock prices – just as it’s hidden from investors.
In other words, the market is willing to pay $9.56 for every $1 of Netflix’s operating capital. If Netflix’s profits just stagnated at the current level, with no growth and no decline, the stock would value at just about $25.68 a share. This equates to about 67% of today’s price being a wager on future growth, but not yet realized.
Here is the completed ladder, and what Netflix would be worth at various assumed rates of growth:
| Long-Run Growth Rate | Estimated Value | Value ÷ Price |
| 2% | $30.95 | 40% |
| 3% (Conservative) | $34.45 | 45% |
| 4% | $39.13 | 51% |
| 5% (Balanced-Growth) | $45.68 | 59% |
| 6% | $55.50 | 72% |
| 7% (Upper) | $71.87 | 93% |
| 7.23% (break-even) | ≈$77.40 | 100% |
| 7.5% | $84.96 | 110% |
| 8% | $104.60 | 135% |
| 8.5% | $137.34 | 177% |
How the ladder is calculated: value = operating capital ($34.5bn) + excess operating income ($8.18bn) ÷ (10% − growth rate), less $7.9bn of net debt, divided by 4,164m shares.
Be aware that the break-even point is at 7.23%, which is nearly the same as the price suggests. It’s not a coincidence; it’s the whole exercise going as desired.
Note that it is the profit from operations, not revenue, that must accelerate at a little over 7% rate. In 2025, it actually grew 36%. In the last four quarters, growth was 6%. As an aside, Disney trades at 1.45x operating capital — it’s not calling for growth, it’s calling for the return on that capital to get back to about 14.5%. That’s a gamble on recovery, not on growth, which is a far cry from Netflix’s game.
Is Netflix Stock Overvalued or Undervalued Right Now?
This is the question you really wanted answered — and the honest response is: it depends entirely on how much growth you’re willing to believe in.
The price is asking for 7.2% long run growth at $77.40. If there’s any indicator, look at Netflix’s own history and that’s the lowest that the market has ever demanded from Netflix at any year-end since 2019, when it requested 9.1%. By the end of 2025, it had drifted down to 7.8%. That is a modest ask by Netflix’s standards, but it’s still well above a more conservative 5% anchor, where this model’s value is $45.68.
| Comparison | Reading |
| Against Balanced-Growth (5%) value of $45.68 | Fully valued |
| Against Upper (7%) value of $71.87 | Close to fair |
There are some important things to note: The stock is down 17% year-to-date, but the growth rate the price signals has changed little from 7.8% to 7.2%. This has been a sentiment change, rather than a business change.
There are two reasons why this 7.2% ask might feel comfortable “free” to go forward. The first is that Netflix’s return on operating capital continues to increase towards 40 percent, and with that increase, the growth rate required for the company to break even comes down to just 6.5 percent. But push back the return to 50% and it drops even lower to 5.3%. Second, operating income above the 10% required return keeps growing at around the 7% mark per year — it grew 36% in 2025 and 6% over the last four quarters, a figure held down by the tax on the termination fee.
So what to look for in next quarterly report: does the return continue to remain in that 35-40% range as the operating capital base continues to grow? This one figure will provide greater insight into the intrinsic value of Netflix in 2026 than any percentage ever will.
Bottom Line
There is no right answer to this, just a range of answers. Using this model, Netflix’s value lies between $34.45 and $71.87 a share, being based on the center value of $45.68 based on the amount of growth one feels. Today’s asking price: 7.2% forever! That’s a fair question to ask, if you were us, that is – and look at the return on operating capital at the next quarterly report.
If you’re weighing Netflix against other high-return names in your portfolio, our roundup of the AI-driven leaders set to shape 2025-2030 uses this same operating-capital lens across the sector. It’s more important than any heading, it will tell you where this story’s heading next.
Figures as of the 11 September 2026 close. Valuation figures are FinancialBeings model outputs at a 10% required return on operating capital; the published-estimate range is a page-1 read of 12 September 2026 and recomputes daily. This is analysis, not personalised investment advice.
Frequently Asked Questions
What is Netflix’s intrinsic value in 2026?
About $45.68 a share at a 10% required return and 5% long-run growth, with a range of $34.45–$71.87 across 3–7% growth. Split-adjusted published estimates range from about $24 to $129, while published estimates on pages that have not been split-adjusted are greater than $1,000.
Is Netflix stock overvalued or undervalued right now?
The price suggests long run growth of around 7.2%, which is below what Netflix’s price has asked at any year-end since 2019, but above a more conservative 5% anchor. At present the business has a return of 34.0% on its operating capital.
Why did Netflix’s stock price fall from over $1,000 to under $100?
It did not depreciate. In November 2025, they split the shares 10-for-1, causing each share to be priced at a tenth of its old price. If you see a figure higher than about $300 on the internet, it is a pre-split amount.
Why do Netflix intrinsic value calculators give such different answers?
They’re provided with different inputs. Some rely on reported earnings, including this year’s $2.63 billion one-off fee that swells the earnings figures. Others swing with only minor variations in the assumed growth. Then there were others who just didn’t take the stock split into account.
Is Netflix a good long-term investment after the split?
That depends on whether Netflix can keep earning 34% on its operating capital while continuing to grow at a rate higher than the 7.2% its price suggests, or ensure that it returns closer to 40% on its operating capital, which reduces the growth it requires. The next test will be in the Q3 2026 report. This is NOT investment advice.
View Sources
FinancialBeings operating-return valuation model — Netflix and Disney runs, figures as of 11 Sep 2026; built from SEC XBRL filings:
- Netflix Form 10-K FY2025 and Form 10-Q to 30 Jun 2026 — SEC EDGAR
- Disney Form 10-K FY2025 and Form 10-Q to 27 Jun 2026 — SEC EDGAR
Netflix Q2 2026 shareholder letter and 10-Q — Netflix Investor Relations
Netflix 10-for-1 stock split announcement (30 Oct 2025) — Netflix IR press release
Warner Bros. Discovery termination fee coverage (26 Feb 2026) — CNBC
Published-estimate range: page-1 results for “netflix intrinsic value,” read 12 Sep 2026. Competitor calculator figures are referenced as a dated range without naming individual sites.
