
| Quick verdict: Walmart is the bigger, cheaper, higher-yielding stock; Costco is the more expensive stock, but a better-quality stock because of its membership “annuity” underneath it. Both keep about 3 cents of profit per dollar of sales, but Costco makes about 37% on the money invested in its operations, compared to Walmart’s ~15%. Choosing the better buy will depend on whether you want value and income (Walmart) or quality and durability (Costco). |
Walmart vs. Costco Stock Showdown
Walmart is the larger, lower-cost, higher-yielding stock, while Costco is the pricier, higher-valued stock but the better-quality grower, underpinned by a “membership annuity”. The best way to show this difference: Costco generates approximately 37% profit on the money invested in its business compared to Walmart’s ~15%, while both keep a profit margin of about 3 cents on every dollar of sales. Which is the better buy for you depends on whether you want value and income (Walmart) or quality and durability (Costco).
Walmart Inc. (NYSE: WMT) and Costco Wholesale (NASDAQ: COST) are both long-term dividend-paying stocks in the S&P 500’s consumer-staples sector. The table below compares the headline numbers before we discuss why they appear to be so different.
Snapshot: Walmart vs Costco (as of 17 July 2026)
| Metric | Walmart (WMT) | Costco (COST) |
| Share price | $114.24 | $940.87 |
| Market cap | ~$909B | ~$417B |
| Revenue (TTM) | $725.3B | $293.6B |
| Revenue growth (latest qtr, YoY) | +7.3% | +11.6% |
| Net margin (TTM) | ~3.1% | ~3.0% |
| RNOA — return on operating assets | ~15.1% | ~36.6% |
| Implied growth (g, r = 10%) | 9.1% | 8.5% |
| Net financial position | $49.8B net debt | $5.3B net cash |
| P/E (trailing) | ~40.2× | ~47.3× |
| Forward P/E | 38.3 | 43.0 |
| Dividend / yield | $0.99 / ~0.87% | $5.88 / ~0.62% (+ specials) |
| 52-week range | $94.43 – $135.16 | $844.06 – $1,096.50 |
| Analyst avg. target | ~$138.6 (~+21%) | re-pull on publish day |
| Comparable (same-store) sales | +4.1% U.S. ex-fuel | +6.8% adj. U.S. |
Walmart has the lower earnings multiple, a higher dividend yield and is by far the larger of the two companies. Costco has a higher multiple, a lower regular dividend but higher growth rates in sales and membership income last quarter. The answer to which is better can’t be determined from the income statement because their net margins are almost equal (about 3%). That’s the gap this article fills.
Two business models: low-price scale vs. the membership machine
There is a stark difference in how Walmart and Costco make money, but they both keep approximately the same bottom-line margin, about 3 cents of profit for every dollar of sales. Walmart’s gross margin is ~24.9%, and the company profits from sheer volume — $725.3B in revenue from supercenters, Sam’s Club, e-commerce, Walmart+ and Walmart Connect advertising.
Costco does exactly the opposite: merchandise margin is capped near 11% (gross margin ~13%) to keep prices low, and it generates profit primarily from the annual membership fee paid by shoppers after they have walked in the door.
These fees are a small percentage of the total revenue, but they are almost pure profit once the warehouse is built and staffed, which is why membership economics matters. Walmart’s counterpart engine is newer: Walmart Connect advertising and Walmart+ memberships, both of which carry far higher margins than its ~25%-gross-margin core retail business.
Two very different moats, one thin profit margin: Walmart’s is scale and logistics; Costco’s is a base of paid members that renews at a very high rate. The gap accounts for all of the other differences in this comparison, beginning with how each company generates profits from its assets.
Valuation: Is Costco’s premium worth it?
The stock screener lists Costco as trading at nearly 47× trailing earnings, compared to Walmart’s 40×. The issue isn’t whether premiums exist; it’s whether they are warranted. That’s where a returns-based read adds value over a multiples-only read.
The in-house residual operating income (ReOI) model at FinancialBeings values each business on the return it currently earns on its net operating assets (RNOA) and the growth its share price implies, using a 10% required rate of return. For a deeper walkthrough of how this residual operating income model works, see our full breakdown using Google’s intrinsic value as a worked example.
For both stocks, the model produces fair values below today’s market price: Costco’s model value is about $430 per share compared to the actual price of $940.87 and Walmart’s model value is about $46 per share compared to the actual price of $114.24.
The value-to-price ratio is roughly 46 percent for Costco and about 40 percent for Walmart; both trade above the model’s fair-value estimate, but Costco’s price is more closely aligned. If valuation is your main concern, check out our roundup of cheap consumer-staples stocks for more value-oriented picks in this sector.
Value from current returns & implied growth (r = 10%)
| Value input | Walmart (WMT) | Costco (COST) |
| Net operating assets (NOA) | $155.7B | $23.8B |
| Current RNOA (sustainable) | 15.1% | 36.6% |
| Required return (cost of capital) | 10% | 10% |
| Implied growth priced in (g) | 9.1% | 8.5% |
| Fair value / share (model) | $46 | $430 |
| Value / Price (intrinsic ÷ market cap) | 40% | 46% |
The more interesting number is implied growth. At the model’s 10% hurdle rate, Walmart’s price implies about 9.1% long-run growth and Costco’s about 8.5% — roughly the same ballpark, with Walmart’s actually the higher of the two.
That’s the opposite of what the headline multiples suggest: Costco’s much larger multiple reflects not what the market expects in the future, but the high returns the business earns right now. If anything, Walmart’s price leans on slightly more assumed growth than Costco’s does.
Operating returns: why Costco earns far more on its assets
Both companies have thin operating margins, but Costco earns about 37% on its net operating assets, compared to Walmart’s ~15%, because it turns those net operating assets about 12–13 times a year versus Walmart’s 4–5.
That one number, return on net operating assets (RNOA), is the true quality difference between these two stocks, and it’s under-reported on the pages that are ranking for “walmart vs costco stock.”
RNOA simply breaks down into two parts: operating profit margin (PM) × asset turnover (ATO).
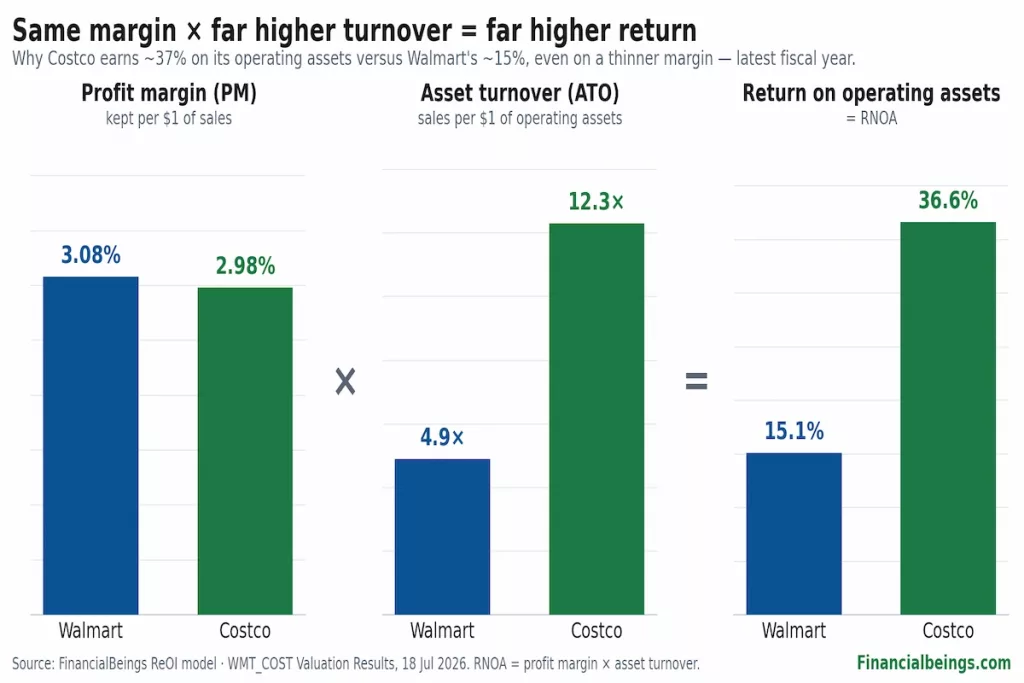
Figure 1: Same ~3% margin, very different turnover: Costco’s RNOA edge comes almost entirely from how fast it cycles its operating assets.
PM × ATO = RNOA (latest fiscal year)
| Operating returns | Walmart | Costco |
| Operating profit margin (PM, after-tax) | 3.08% | 2.98% |
| × Asset turnover (ATO, sales per $1 of NOA) | 4.9× | 12.3× |
| = Return on net operating assets (RNOA) | 15.1% | 36.6% |
| Net operating assets (NOA) | $155.7B | $23.8B |
| Net financial position | $49.8B net debt | $5.3B net cash |
| Enterprise value / NOA | ~6.2× | ~17.3× |
The margin line is close to a tie. Walmart’s after-tax operating margin (3.08%) is slightly better than Costco’s (2.98%). The turnover line is where the story is: Costco cycles about $12.30 of sales for every $1 of net operating assets, against roughly $4.90 for Walmart. Multiply the two and Costco’s RNOA (36.6%) works out to about 2.4 times Walmart’s 15.1%.
Why the gap? Costco has a minimal amount of capital tied up in the business, relying on other people’s money for its operations, which include members’ prepaid fees, supplier payables, and $5.3B of net cash. Walmart has a much bigger store and distribution network and also has approximately $49.8B in net debt, which means it requires more cash to produce $1 of sales. Same thin ~3% margin on each sale — Costco simply needs far less capital to make it.
This is another reason why RNOA is a better comparison than return on equity (ROE): ROE incorporates the use of debt, which can boost a leveraged company’s returns.
RNOA removes the financing completely, and compares the stores and warehouses themselves, not the plumbing on the balance sheet. We use this same RNOA-based framework across sectors—for a banking-sector example, see our comparison of JPMorgan vs Bank of America.
Dividends, growth & latest earnings
Walmart pays a higher yield on a lower per-share dividend — $0.99 a share for a yield close to 0.87%, and its revenue increased by 7.3% year over year last quarter. Costco offers a lower regular dividend ($5.88 a share with a yield just below 0.62%) and an occasional special dividend that supplements this payout, and its sales grew even faster, up 11.6% year over year last quarter. If you’re evaluating Walmart against other retail names too, check out our breakdown of Target vs. Walmart stock.
The momentum comes into focus with the trailing-12-month numbers. Costco’s economic profit (residual operating income — operating profit above a 10% capital charge) hit a new high last year of $6.34B, while Walmart’s, at $8.66B, is still short of its 2025 peak of about $10.4B. RNOA is even higher on a trailing basis with Costco at 40.5% and Walmart at 16.4%.
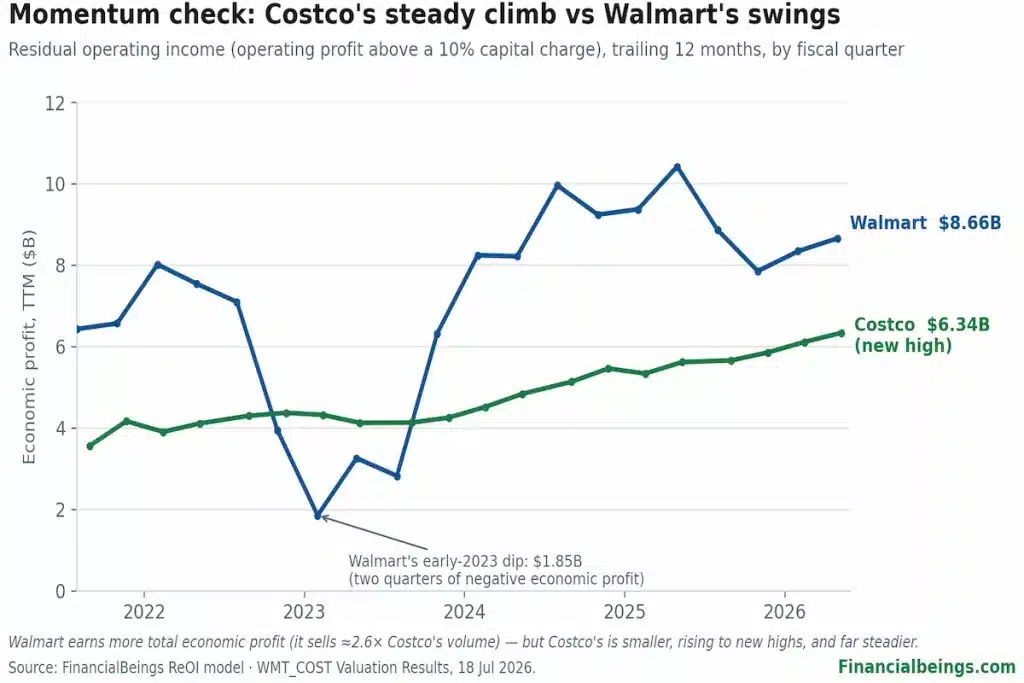
Figure 2: Costco’s trailing economic profit keeps climbing to new highs; Walmart’s swings much harder around a higher average level.
TTM / latest momentum read (quarterly)
| TTM / latest read | Walmart | Costco |
| TTM return on operating assets (RNOA) | 16.4% | 40.5% |
| TTM economic profit (ReOI), latest | $8.66B | $6.34B |
| TTM economic profit: peak → trough | $10.4B → $1.9B | $6.3B → $3.6B |
| Quarters of negative economic profit (since 2021) | 2 | 0 |
| Latest-quarter sales growth (YoY) | +7.3% | +11.6% |
Both companies are also developing high margin, recurring-revenue engines atop their core retail operations. For readers comparing Walmart across the retail landscape more broadly, our Walmart vs Amazon stock breakdown covers that angle in more depth. Costco’s membership income rose 10.7% YoY and accounts for about half of its operating income, with members renewing at about 92% in the U.S. and Canada. Walmart’s response is a two-sided strategy: membership (Walmart+) and advertising (Walmart Connect). Membership income increased 17.4% YoY and Walmart Connect advertising revenue rose approximately 37% on a global basis.
Membership & the high-margin add-on
| Metric | Walmart (WMT) | Costco (COST) |
| Recurring-revenue engine | Walmart+, Sam’s Club, advertising | Core membership fees |
| Membership fee income growth | +17.4% YoY (Q1 FY27) | +10.7% YoY (Q3 FY26); ~$5.5B annualized |
| Advertising growth | +37% global (Walmart Connect +44% ex-Vizio) | Smaller ancillary base |
| Share of operating income from fees | Small but rising | ~49% (Q3 FY26) |
| Renewal / retention | n/d (Walmart+) | U.S./Canada 92.2%; worldwide 89.7% |
| Members | Walmart+ (undisclosed) + Sam’s | 82.9M paid; 41.2M executive (+9.6%); 149M cardholders |
Risks & which investor each suits
Walmart is where value and income investors can find a lower cost, higher yield, defensive giant, while Costco is where quality-growth investors can find an alternative that offers a higher price tag, but is durable and has a loyal membership base willing to pay for it.
Both sell everyday essentials and tend to be fairly resilient during a pullback — but not quite equally. For more defensive, income-generating names in this space, see our roundup of top consumer-defensive stocks to hold amid uncertainty.
Compare the behaviors of each company’s economic profit in the last true squeeze. Walmart’s trailing economic profit dropped to $1.9B in early 2023 with two quarters having no economic profit over the cost of capital. Costco’s kept climbing and has not turned negative since 2021. Costco is the more stable of the two, but Walmart is the larger vessel, with about 2.5 times Costco’s revenue ($725.3B vs $293.6B).
The common risk: Both stocks trade above the model’s fair-value estimate today, which suggests that both prices already are based on years of good execution. For Walmart, that means continued growth in its advertising, membership and core retail revenue; for Costco, a near-record renewal rate and enough new stores to sustain its turnover advantage. Neither price leaves much margin for error.
Final verdict
On Walmart vs Costco stock, there is no single right answer — it depends on what you are looking for. Walmart is the cleaner investment choice if you are looking for value and yield plus a defensive anchor: It’s less expensive on P/E, has a meaningfully higher dividend yield, and the scale that gives it staying power in almost any environment.
If you are looking for the better quality of compounder and willing to pay for it, then Costco earns much more on every dollar of capital it invests and its premium looks much better on its own returns today than the headline 47× P/E does.
The name you pick may be the most important part of this decision, but the entry price is also important, as both stocks are currently trading above FinancialBeings’ returns-based estimate of fair value. The data is as of 17–18 July 2026 and should be refreshed before you act on it; treat these figures as a point-in-time snapshot only. This article is for information purposes only, and is not a financial recommendation.
Frequently asked questions
Walmart vs Costco stock – which is the better buy in 2026?
This depends on your objective: Walmart is cheaper and offers a higher dividend yield, and Costco has a much higher return on operating assets (~37% vs ~15%). Neither is definitively ‘better’ for every investor.
Is Costco stock overvalued compared to Walmart?
Costco appears more expensive on the basis of earnings multiples (~47× P/E vs ~40×). Both are over the fair value on a returns-based model, with Costco’s price closer to the model value.
Does Walmart or Costco pay a better dividend?
Walmart pays a higher yield — about 0.87% versus Costco’s roughly 0.62% — though Costco also adds an occasional special dividend.
Which earns a higher return on its operating assets — Walmart or Costco?
Costco, by a long shot: about 37% RNOA, Walmart about 15% (Costco turns over its assets about 12–13 times a year versus Walmart’s 4–5).
How much of Costco’s profit comes from membership fees?
Membership fee income makes up approximately 50% of Costco’s operating income and increased by approximately 10.7% year over year driven by a U.S./Canada renewal rate of nearly 92%.
What growth is baked into Walmart’s and Costco’s share price?
The model implies about 9.1% long-run growth for Walmart, slightly more than the ~8.5% for Costco, at a 10% required return.
Which stock is safer or more recession-proof?
They’re both defensive staples. Walmart’s lower price and higher yield suit value investors, while Costco’s more consistent economic profit (no negative quarter since 2021) makes it durable.
What is Walmart’s vs Costco’s latest quarterly sales growth?
Costco’s sales rose about 11.6% last quarter, continuing to outpace Walmart’s 7.3% and pointing to stronger current momentum at Costco.
References
Costco Wholesale Corporation. (2026, May 28). Costco Wholesale Corporation reports third quarter and year-to-date operating results for fiscal 2026 [Press release]. Costco Investor Relations. https://investor.costco.com/news/news-details/2026/Costco-Wholesale-Corporation-Reports-Third-Quarter-and-Year-To-Date-Operating-Results-For-Fiscal-2026/default.aspx
StockAnalysis.com. (2026, July 17). Costco Wholesale Corp (COST) stock quote & summary. https://stockanalysis.com/stocks/cost/
StockAnalysis.com. (2026, July 17). Walmart Inc. (WMT) stock quote & summary. https://stockanalysis.com/stocks/wmt/
U.S. Securities and Exchange Commission. (n.d.). Costco Wholesale Corp (COST) filings. EDGAR. https://www.sec.gov/cgi-bin/browse-edgar?action=getcompany&CIK=0000909832&type=10-Q
U.S. Securities and Exchange Commission. (n.d.). Walmart Inc. (WMT) filings. EDGAR. https://www.sec.gov/cgi-bin/browse-edgar?action=getcompany&CIK=0000104169&type=10-Q
Walmart Inc. (2026, May 21). Walmart releases Q1 FY27 earnings [Press release]. Walmart Corporate. https://corporate.walmart.com/news/2026/05/21/walmart-releases-q1-fy27-earnings
Not financial advice. Figures are point-in-time and must be re-verified against primary sources (company IR, SEC) before publishing; stamp the page with the as-of date.
