
If you quickly Google, you’ll find basically the same result: Walmart is doing better, Target is doing worse, case closed.
That conclusion was mostly right, six months ago. In 2026, the story has quietly reversed its course and many of the old comparisons haven’t caught up. Target’s shares have climbed about 47% on the year. Walmart’s are up about 2%. Those who are just basing their work on the old headlines would be operating on a photo that is no longer representative of the market.
It is not a comparison of the nicer aisles or the price of milk in the two stores. It’s a comparison of two vastly different companies, two vastly different market values, and what each price is quietly betting on. The aim here isn’t to come out on top, but to explain precisely what each company provides.
Target stock vs Walmart stock comparison
Let’s look at the conflict at the heart of the Target stock vs Walmart stock comparison: Walmart operates the better business. The more affordable stock is Target. Both are true at the same time.
Before we even get to “better business”, let’s first get to the vibe; there is a number behind it. Consider this: how many cents does a company earn for every dollar that it invests in its stores, shelves, delivery trucks and warehouses in a year? It’s known as return on net operating assets and it’s simply a reflection of how hard a company works to earn its money. Walmart makes 16.7 cents of profit on each dollar that it’s tied up. Target earns 14.3 cents. It’s not a massive difference, but it is a true and enduring one.
On the other side, investors call the price-to-earnings multiple, or P/E, the ratio of a company’s stock price to its earnings per share. Target’s stock price is about half that of Walmart’s, relative to the company’s earnings per share. That is all it is: the stock price divided by a year of profit, and a smaller number indicates that the market is willing to pay less per dollar of profit. Target also hands back more than three times as much dividend income per dollar invested.
Here there are three different priorities that give rise to three different conclusions.
- A business quality-oriented person would be attracted to Walmart.
- A person interested in regular income would be interested in Target’s dividend.
- Despite carrying about twice as much debt relative to its size as Walmart, Target is cheaper on every valuation measure. All three priorities are valid. They are simply different questions, and the Target stock vs Walmart stock comparison looks contradictory only because those questions have different answers.
| As of 28 July 2026 | Target (TGT) | Walmart (WMT) |
| Stock price | $144.20 | $113.10 |
| Market value | $65.5bn | $900.1bn |
| Price-to-earnings (trailing) | 19.05 | 39.81 |
| Dividend yield | 3.2% | 0.9% |
| Stock price change, 1 year | +43.5% | +15.4% |
| Beta (how much it swings vs. the market) | 0.98 | 0.60 |
Market data as of the 28 July 2026 close. Price change excludes dividends.
Which Window Are You Looking At?
This is where much of the confusion online originates. People aren’t lying about the numbers; everyone is simply looking at a different stretch of time, and almost nobody says which one.
If you looked up “Target stock vs Walmart stock” six months ago, you’d know that Walmart was the clear winner. Repeat the search with the past 12 months of data and the winner is switched to Target. Make it five years, and it’s back to square one.
| Window | Target (TGT) | Walmart (WMT) | Who’s ahead |
| 2026 so far | +47.5% | +1.5% | Target – Walmart is flat |
| 1 year | +43.5% | +15.4% | Target, by about 2.8x |
| 3 years | +5.7% | +112.2% | Walmart, decisively |
| 5 years | −44.8% | +138.0% | Walmart, decisively |
Stock price change to the 28 July 2026 close
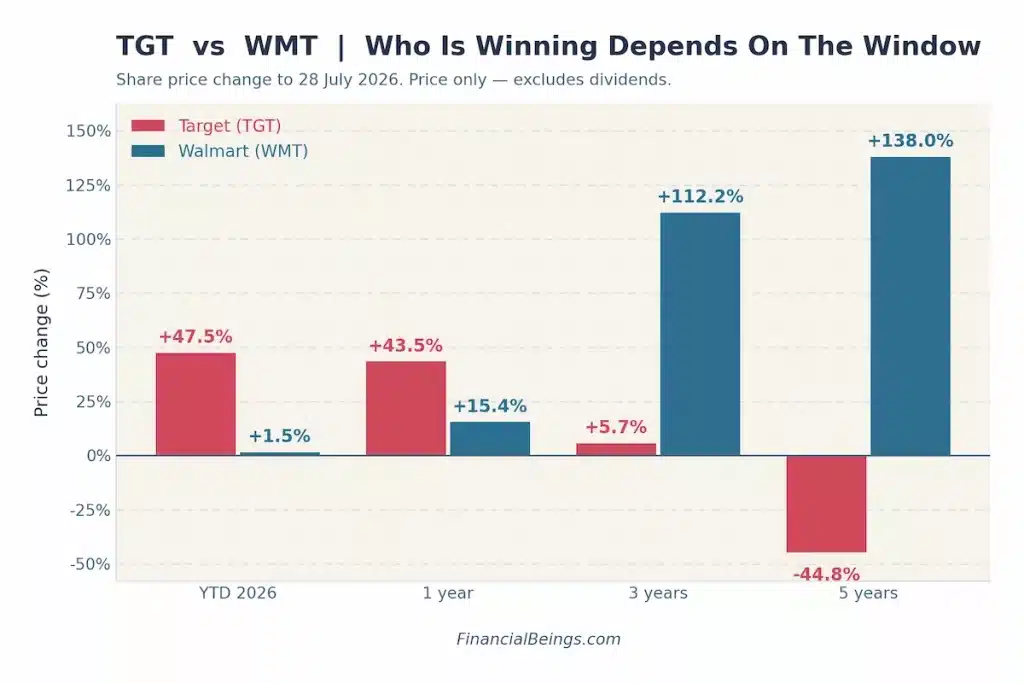
Both tales are true. They simply talk of the various chapters of the same book. The stuff that is floating online these days was produced from March to June. No one went back to fix it.
There’s one smaller clue in the details, as well. Target closed at $144.20, about 1% below its 52-week high of $145.85, near the top of its recent range. Walmart closed at $113.10, roughly 16% below its own high of $135.16, after a 12% fall in May that dropped it out of the $1 trillion club. One stock is near the top of its range. The other is well off it and has not yet recovered. That alone explains a lot of the loud disagreement over which one is “winning”.
What Each Stock Price Is Betting On
Every stock price is really a bet on the future. The trick is figuring out exactly what that bet is — the same question we asked when comparing JPMorgan and Bank of America stock earlier this year.
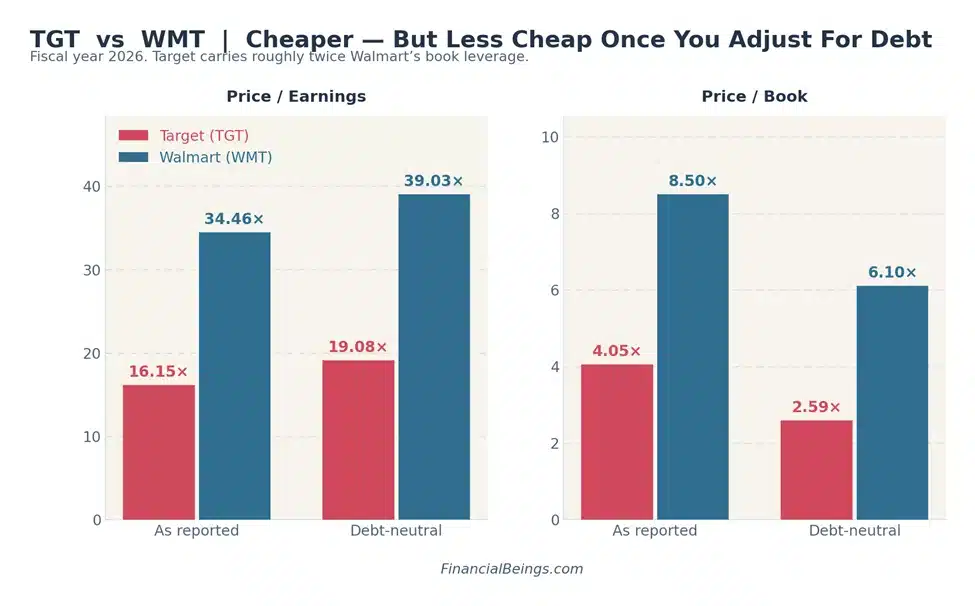
Walmart trades at 34.5 times its earnings. Target trades at 16.2. That seems like an enormous gap, but part of it is an illusion created by debt. A company that borrows heavily can boost the returns it shows its shareholders without actually running a better business, the same way you can make a small down payment look impressive if the bank covered the rest. Comparing the two multiples head-to-head isn’t quite apples-to-apples, because Target borrows about twice as much as Walmart does relative to its size.
Suppose, just for a moment, that neither company owed any money. The picture doesn’t change, although it does shift a bit. Target’s price is up to 19.1 times earnings, Walmart’s is up to 39.0 times. The gap becomes slightly less. It doesn’t close.
| Measure | Target (TGT) | Walmart (WMT) |
| Price-to-earnings, as reported | 16.15x | 34.46x |
| Price-to-earnings, debt-neutral | 19.08x | 39.03x |
| Price-to-book, as reported | 4.05x | 8.50x |
| Price-to-book, debt-neutral | 2.59x | 6.10x |
| Growth the price assumes | 7.42% | 8.77% |
| Income the owner collects, per dollar invested | 3.53% | 2.21% |
Financial Beings valuation model, run 29 July 2026 on the year ended 31 January 2026. Implied growth is stated at a 10% required return. Model figures are fiscal-year based and will not match the trailing-twelve-month screener data above.
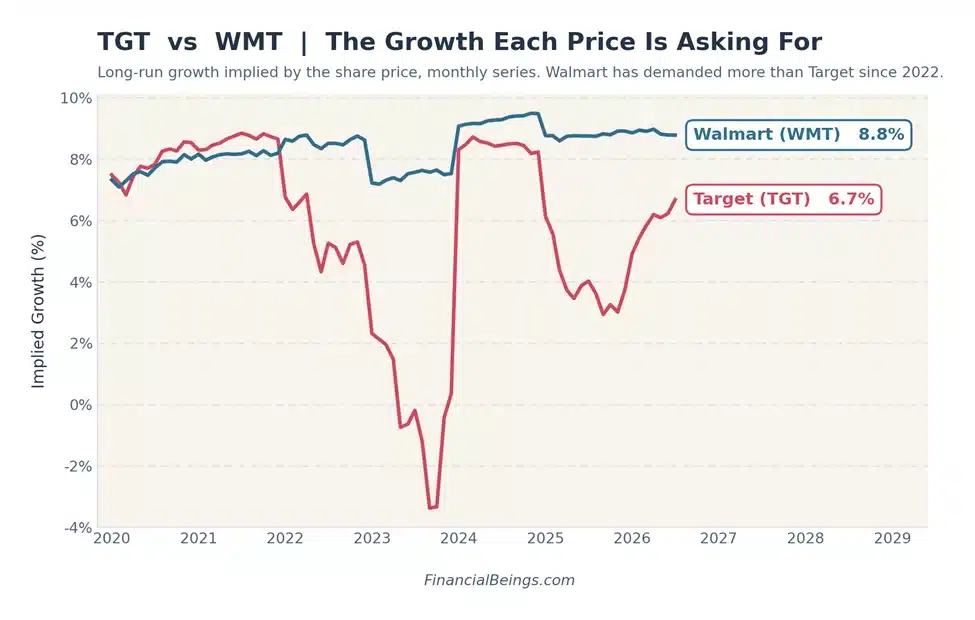
That row under the “growth the price assumes” is worth a second look, as it turns the abstract multiple into something concrete. Paying $113.10 for Walmart and expecting 10% a year requires its operating profit to grow 8.8% a year, forever — a similar ‘growth the price assumes’ test we ran on Microsoft and Adobe stock, where the gap told a different story about software margins versus retail margins.
Target’s price asks for 7.4% at that same required return. Walmart’s ask is the higher of the two at every required return tested, from cautious to demanding. There are no wobbles in the ordering.
Another way of asking the question is: what is the margin of error for each of these prices assuming that things do not go exactly as planned?
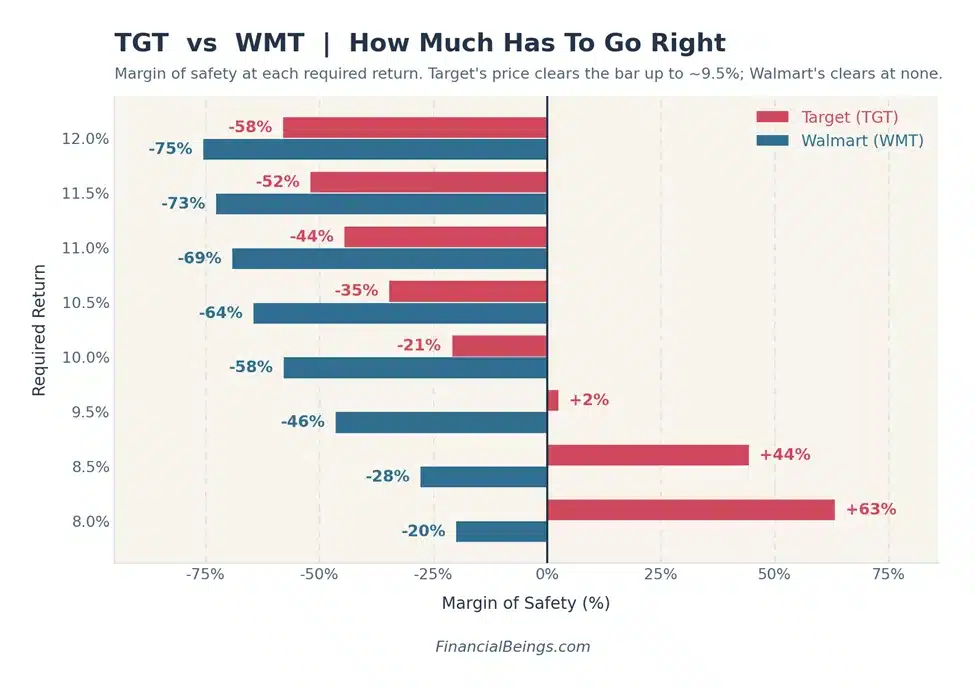
At an 8% required return, Target’s price sits about 63% below what the model says the underlying business is worth — a wide margin for error. The price of Walmart at that same bar is already about 20% above what the model says its business is worth, so there’s no buffer, and the model didn’t find one at any of the returns it tested, up to 12%.
That is not a judgment on which is the better of the two stocks. It is simply one indicator of the degree to which things must go right for each price to be a good fit, and at the moment, more must go right for Walmart.
Margin vs. Speed: Why Target Earns More Per Sale and Still Comes Out Behind
Here’s the part almost nobody explains properly, and it’s the real engine behind everything above.
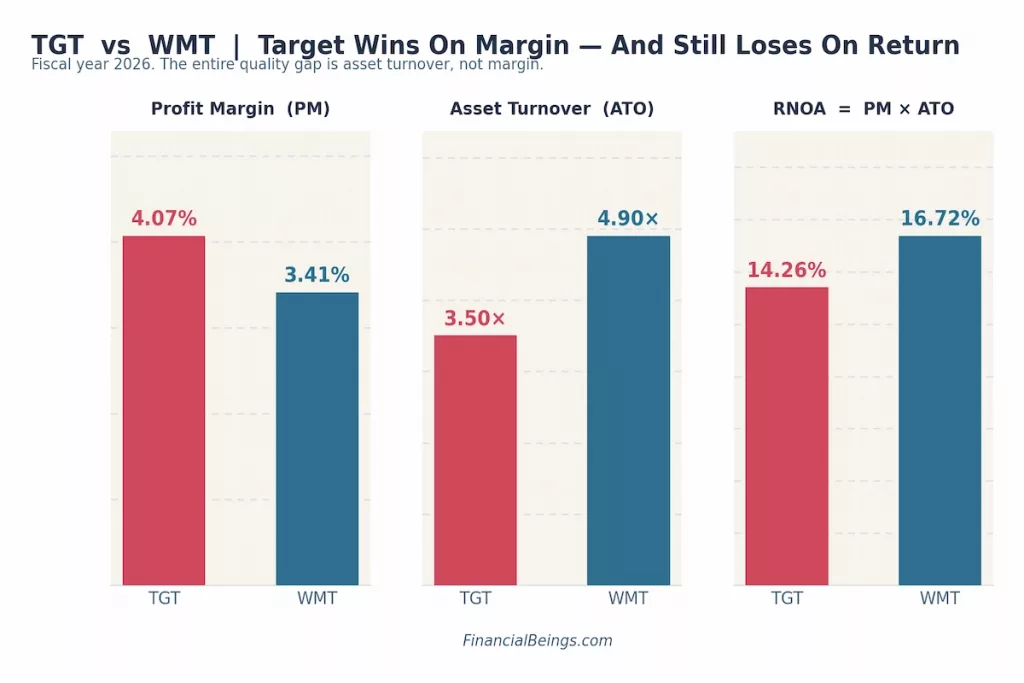
Target makes more profit on every dollar of goods it sells than Walmart does — 4.07 cents to Walmart’s 3.41 cents. That is the profit margin, and Target wins it outright.
Then why is Walmart still more profitable on the whole? There’s another ingredient that no one mentions – the number of times a business can move stock through its shelves in a year. That’s asset turnover, and it’s speed, not price. Walmart sells $4.90 of goods for every dollar invested in its business. Target manages $3.50. When you multiply margin by speed you end up with the overall return, and that’s where Walmart pulls its big number.
| Year ended 31 January 2026 | Target (TGT) | Walmart (WMT) |
| Profit margin | 4.07% | 3.41% |
| Asset turnover | 3.50x | 4.90x |
| Return on net operating assets | 14.26% | 16.73% |
| Property & equipment as share of sales | 32.21% | 19.08% |
To put it simply, Target’s stores are nicer, and that is part of the problem. It ties up nearly 32 cents of property and equipment for every dollar of sales. Walmart ties up only 19 cents. Similar to having a nice car parked in the driveway a lot of the time – it’s a nice thing to have, but doesn’t bring in any income.
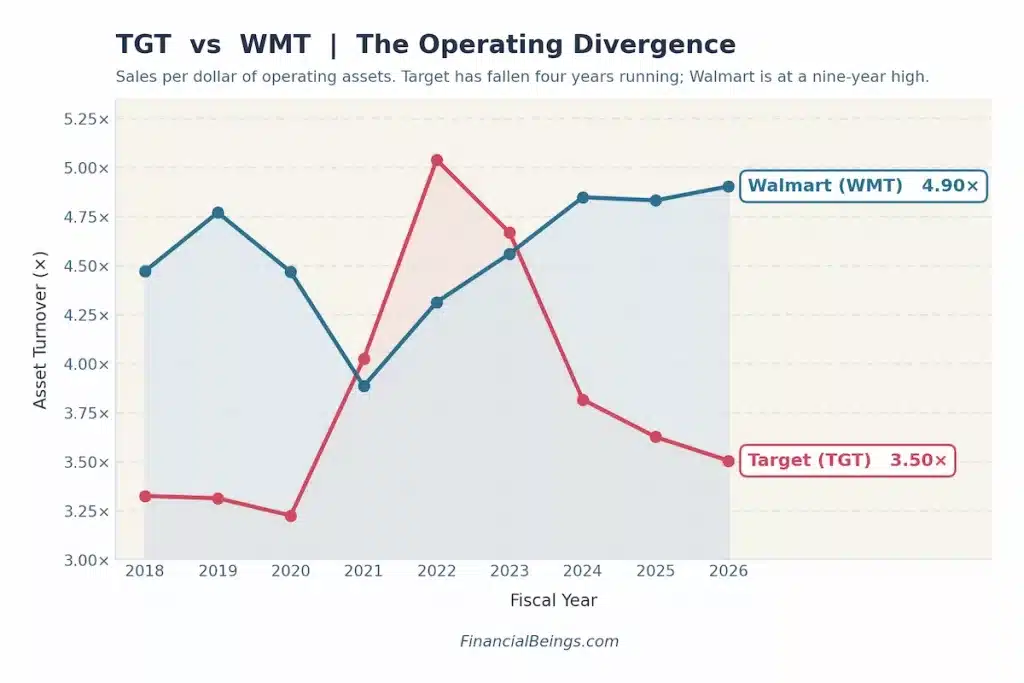
This isn’t a one-off. Target’s asset turnover has fallen every year since 2022, from 5.04 to 3.50 times. Walmart’s has climbed to a nine-year high.
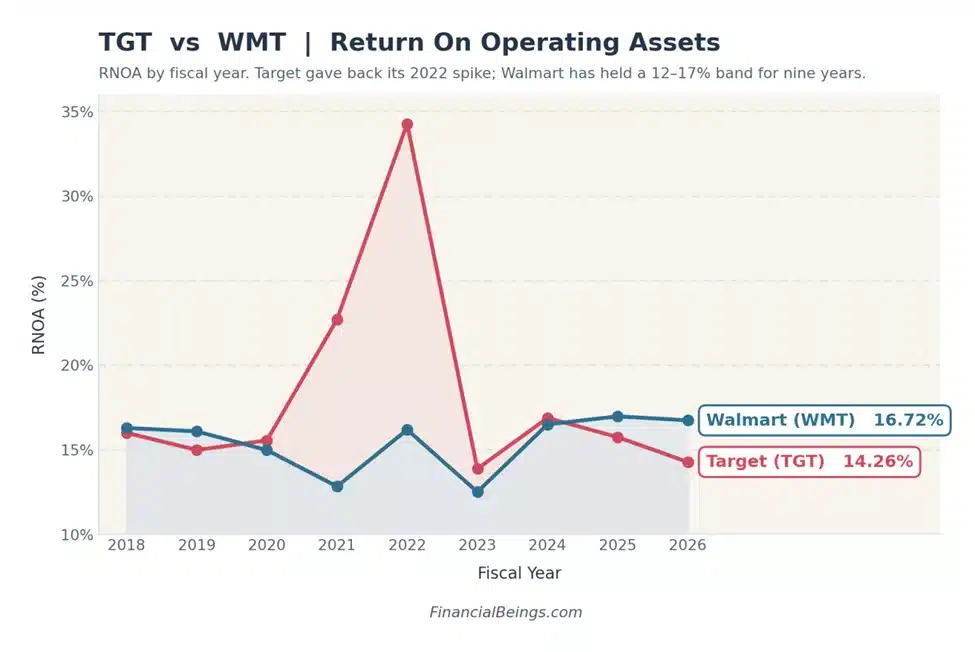
Target’s return on net operating assets tells the same tale: it surged to 34% in the 2022 pandemic year, gave the whole gain back, and is now lower than it was in 2018. Walmart has been boring for nine years, holding a steady 12% – 17% band in the quietest manner possible.
One quick caveat here, as several other comparisons lead with it: Target’s return on equity, which measures the yield on the money that has been invested by shareholders, is higher than Walmart’s at 24.4% versus 22.3%. That looks like a win for Target, except the borrowing is doing the work. Target carries roughly twice Walmart’s book debt — 0.92 times equity against 0.47. Strip that leverage out and Walmart wins this one too.
The Dividend Story: A Bigger Check, But One That’s Growing Slower
For anyone weighing which stock puts more cash into their account today, this section matters most.
The dividend yield for Target is 3.2%. Walmart pays 0.9%. It’s not a small gap: for every dollar invested, Target returns more than three times as much income. Both companies belong to an exclusive group known as Dividend Kings — companies that have increased their payout every single year for more than five decades, and both regularly show up on lists of the best dividend stocks to buy. Walmart has raised for 53 straight years. Target reached 55 in June 2026. Some of the comparisons on the web mistakenly demote Walmart to a “Dividend Aristocrat,” a less prestigious 25-year club that Walmart passed long ago.
| Measure | Target (TGT) | Walmart (WMT) |
| Dividend per share, annualized | $4.64 | $0.99 |
| Yield at the 28 July close | 3.2% | 0.9% |
| Most recent increase | +1.8% | +5.3% |
| Capital needed for $1,000/yr of income | ~$31,100 | ~$114,200 |
The last time Target hiked, it was only 1.8%, the smallest increase in the chain’s 55-year streak. Walmart’s latest raise was 5.3%, nearly triple that. So the question is: will Walmart’s small but faster-growing dividend eventually overtake Target’s large but slower-growing one?
It does — eventually. Depending on which growth rate you assume, Walmart needs anywhere from 21 to 40 years to make up the income difference relative to what you invested in the first place. On the total income actually collected along the way, it needs 32 to 60 years. For anyone thinking in decades rather than generations, Target’s income cushion is not going anywhere.
Same Sale, Different Story: Revenue and Earnings
Zoom out and the size difference between these two firms is hard to fathom. Walmart generates roughly seven times Target’s revenue and commands roughly fourteen times its market value. It’s also the only one of the two whose profits are currently growing: Walmart’s earnings per share rose 21.4%, against a year-over-year decline of 16.8% for Target.
| Trailing twelve months | Target (TGT) | Walmart (WMT) |
| Revenue | $106.4bn | $725.3bn |
| Operating profit | $4.78bn | $30.18bn |
| Earnings per share (change) | $7.57 (−16.8%) | $2.84 (+21.4%) |
| Market value | $65.5bn | $900.1bn |
The difference is more than size, it’s the shape of the business. Walmart is grocery-led, which makes it one of the best consumer defensive stocks to hold when people cut back on spending, because everybody has to eat. It also runs Sam’s Club and a large international arm alongside its US stores, plus a fast-growing advertising business in Walmart Connect. How that scale stacks up against the other retail giant is its own question — see Walmart vs Amazon stock for that comparison.
Target is a single U.S. banner heavily focused on clothing, home goods and other items that typically get postponed when cash is scarce. It has its own smaller advertising arm (Roundel), marketplace (Target Plus), and paid membership (Target Circle 360), but no international business to fall back on.
Both companies also changed chief executive on 1 February 2026. Michael Fiddelke succeeded Target’s longtime chief Brian Cornell, who moved to executive chair. At Walmart, John Furner succeeded Doug McMillon.
What Could Change the Picture in 2026
Here’s a genuinely strange wrinkle nobody seems to be flagging: Wall Street’s analysts and the actual stock prices currently disagree with each other.
| Reported by third parties | Target (TGT) | Walmart (WMT) |
| Consensus rating | Hold (38 analysts) | Buy (43 analysts) |
| Average price target | $133.99 | $138.27 |
| Implied move from 28 July close | −7.1% | +22.3% |
Right now analysts see about 22% upside in Walmart and about 7% downside in Target — the reverse of what the last twelve months actually delivered. Which of the two is right is not yet knowable. Both companies report in August, Target on the 19th and Walmart on the 20th, and that should start to settle it.
If there’s one number after that to keep an eye on, it is Target’s asset turnover, which has dropped four years in a row, from 5.04 to 3.50. That single number is what dragged its return on operating capital from 34% down to 14%.
Once it begins to climb once more, whether via fewer markdowns, slimmer inventories or simply more sales churning through the same stores, the gap between the two businesses narrows and Target’s valuation discount has less reason to exist. If it continues to slide, the low price is just a fair reflection of a business earning less on what it owns.
For Walmart the open question is the opposite one: the business is not in doubt, but the price is already asking for 8.8% growth a year, forever, at a 10% required return.
Frequently Asked Questions
Is Target or Walmart a better stock?
They lead on different things. Walmart has the better business, earning 16.7% on its operating capital against Target’s 14.3%. Target leads on income, yielding 3.2% against 0.9%, and on valuation, at roughly half Walmart’s earnings multiple.
Is TGT stock undervalued compared to WMT?
Target is cheaper than Walmart on every measure, including after adjusting for its heavier debt: 19.1 times earnings against 39.0, and 2.59 times book value against 6.10. For that discount to close, Target’s asset turnover would have to improve; its profit margin is already the better of the two.
Why is Walmart stock outperforming Target?
In 2026, it isn’t. Target is up about 47% year to date against Walmart’s roughly 2%, and up 43.5% against 15.4% over one year. This isn’t a present-day Walmart story, but a three-year and five-year one.
Which pays the better dividend, Target or Walmart?
Target, by a wide margin: 3.2% against 0.9%, and about $31,100 of capital to generate $1,000 a year of income, versus Walmart’s $114,200. Walmart’s faster dividend growth takes at least two decades to close that gap. Both companies are Dividend Kings.
What’s the real difference between Target and Walmart stock?
Scale and mix. Walmart is about seven times the revenue, grocery-led, with Sam’s Club and international operations. Target is a single U.S. banner skewed towards discretionary goods, which makes its results more sensitive to the economic cycle.
