
Both of America’s two largest banks have lost about 7% year-to-date in 2026, but they don’t sound much alike on the inside. JPMorgan Chase is at $299, and Bank of America is at $51. On all the standard measures, BAC looks the more economical and higher-rewarding choice. The numbers reveal a less palatable picture, though: The less expensive bank is trying to pack in a much more significant growth promise from a much weaker engine.
There is a commitment in every share price that the bank’s economic profits (its earnings in excess of the cost of equity capital) will increase quickly and continually until the investment is paid off. JPM’s price has 4.87% of growth embedded in it at a 10% hurdle while BAC’s has 8.34% of growth embedded in it at a 10% hurdle.
The United States’ economy expands at about 4% annually. This is the lesser bank’s asking, double the economy’s speed, from a profit machine which has just managed to show a profit on its cost of capital for the past nine years.
In this guide, we will explain everything about JPM vs BAC valuation, returns & risks, so that by the end, you will know which is the better choice. Let’s start!
Key Stats Snapshot
| Metric (28 May 2026) | JPMorgan (JPM) | Bank of America (BAC) |
| Share Price | $299.28 | $51.10 |
| Market Cap | ~$814.7B | ~$368.5B |
| YTD Price Return | –7.12% | –7.09% |
| 1Y Price Return | +13.36% | +15.79% |
| Total Assets | $4,424.9B | $3,411.7B |
| Book Equity | $362.4B | $303.2B |
| Net Payout Yield | 4.83% | 6.19% |
| 5-Yr Median RNOA | 16.95% | 10.19% |
JPM vs BAC Overviews & Business Models
JPMorgan Chase (JPM)

JPMorgan was established in 1799 in New York and is the biggest bank in the United States, with assets of $4,424.9 billion (as of FY2025). Its universal-bank model spans Consumer & Community Banking to Corporate & Investment Banking (IB), Asset & Wealth Management and Commercial Banking. In FY25, revenue was $182.45 billion, while the operating income was $72.59 billion.
The franchise has a structural advantage of a five-year median sustainable RNOA of 16.95% well in excess of the 10% cost of capital as well as a consistent record of economic profit generation. Residual earnings grew from $3.41B in FY2020 to $22.57B in FY2025 representing a 6.6× increase in value.
Bank of America (BAC)

Bank of America, the largest consumer bank in the U.S. by deposit accounts, holds $3,411.7 billion in total assets and generated $113.10 billion in revenue in FY2025. It covers the Consumer Banking, Global Wealth & Investment Management, Global Banking & Global Markets segments.
BAC’s structural moat is its massive retail deposit base, a sticky, low-cost funding source that should help boost net interest income in high-rate times. The sweet spot: The median sustainable RNOA for the five years is 10.19%, exactly equal to the cost of capital.
FY2025 Financial Performance & Q1 2026 Update
A keen rate of change divergence was observed in FY2025 as BAC beat JPM on revenue growth (+11.00% vs +2.75%) and BAC’s sustainable operating income after tax increased by +12.46% while JPM’s actually dropped by –2.42%.
In the grand scheme of things, it is BAC’s year and there is little denying it. The structural story is in the level, not the change: JPM created 24× as much value at bottom line over the cost of equity as BAC did.
FY2025 Financial Performance
| FY2025 Metric | JPMorgan | Bank of America |
| Revenue ($B) | $182.45 | $113.10 |
| Revenue YoY Growth | +2.75% | +11.00% |
| Operating Income ($B) | $72.59 | $37.70 |
| Sustainable OI After Tax ($B) | $57.05 | $30.51 |
| Sustainable OI Growth (YoY) | –2.42% | +12.46% |
| Implied EPS | ~$20.96 | ~$4.23 |
| ROE (FY2025) | 16.55% | 10.32% |
| ROA | 1.29% | 0.89% |
| Profit Margin | 31.27% | 26.98% |
| Residual Earnings (FY2025, $B) | $22.57B | $0.95B |
JPM vs BAC Valuation Comparison
The first reads on these stocks are standard multiples: JPM at 14.33× trailing earnings and 2.33× book; BAC at 12.68× and 1.32×, respectively. However, the multiples don’t answer the question, why are the multiples of JPM at 2.33× and of BAC at 1.32×? From the residual-earnings point of view, the answer is almost the same as what each bank’s ROE deserves.
A bank earning ~17% on a 10% cost of capital is worth ~2.4× book. A bank earning only ~10% — merely covering its cost of capital — is worth ~1.0× book. The 1.32× of BAC is not a discount; in fact it’s the right multiple for a bank that is operating close to its cost of capital. To purchase BAC with lower sticker compared to the higher one is not a bargain on the same franchise.
It is the market-implied perpetual growth in residual earnings: 4.87% for JPM, 8.34% for BAC (5.01% / 8.54%). The price of BAC is a far more ambitious offer; out of a residual-earnings pool of $22.57B vs $0.95B respectively. Probability-weighted value-to-price at a 10% hurdle: JPM V/P = 123.96% (+23.96% margin of safety); BAC V/P = 91.22% (–8.78% deficit) To understand how these growth rates are calculated and why they matter, see our guide on what growth stocks are and how to find the growth rate of a stock.
Financial Beings Valuation Lens
| Multiple | JPMorgan | Bank of America |
| Trailing P/E | 14.33× | 12.68× |
| Forward P/E | 12.71× | 10.12× |
| Price / Book | 2.33× | 1.32× |
| PEG Ratio | 1.63 | 0.93 |
| Earnings Yield | 6.98% | 7.89% |
| Net Payout Yield | 4.83% | 6.19% |
| Market-Implied ReOI Growth Rate | 4.87% | 8.34% |
| V/P — Margin of Safety @ 10% hurdle | +23.96% | –8.78% |
JPMorgan Chase (JPM) Valuation
| Growth (%) | Model Value ($B) | Model Price/Share | Model Value % |
|---|
Model Value % > 100% = The model value exceeds the current market cap under the stated assumptions. Model Value % < 100% = The current market cap is above the model value under the stated assumptions. Model Value % = 100% = The model value matches the current market cap at the assumed growth rate.
At 2% growth, JPM’s model value reaches a Model Value % of 80.4% relative to current market cap. At 5% growth, the model reaches a Model Value % of 101.5%, and at 8% growth the model reaches 185.9% of current market cap.
The breakeven growth rate is approximately 4.9%. That is the long-term growth assumption where the model value lines up with a company already valued at roughly $802B, showing what the market appears to require from JPMorgan’s consumer banking, markets, investment banking, and asset & wealth management franchises.
Note: Under the 10% hurdle rate scenario set, JPM crosses 100% Model Value at ~4.9% growth — inside the tested 2%-8% range. Below breakeven the market cap sits above model value; beyond it model value climbs steeply, reaching 185.9% at 8% growth.
| Growth (%) | Intrinsic Value ($B) | Price/Share ($) | Value/Price (%) |
| 2 | 644.47 | 240.52 | 80.4 |
| 3 | 684.76 | 255.55 | 85.4 |
| 4 | 738.48 | 275.60 | 92.1 |
| 4.87 (Breakeven Rate) | — | 299.28 | 100.0 (Fair Value) |
| 5 | 813.69 | 303.67 | 101.5 |
| 6 | 926.50 | 345.77 | 115.5 |
| 7 | 1,114.52 | 415.94 | 139.0 |
| 8 | 1,490.56 | 556.28 | 185.9 |
It's a stark asymmetry. At a reasonable 4% perpetual ReOI growth rate, more or less equal to the economy, the shares are at about fair value on JPM's books right now. The shares are valued at ~16% higher at 6% and almost double at 8%.
Bank of America Corporation (BAC) Valuation
| Growth (%) | Model Value ($B) | Model Price/Share | Model Value % |
|---|
Model Value % > 100% = The model value exceeds the current market cap under the stated assumptions. Model Value % < 100% = The current market cap is above the model value under the stated assumptions. Model Value % = 100% = The model value matches the current market cap at the assumed growth rate.
At 2% growth, BAC's model value reaches a Model Value % of 87.0% relative to current market cap. At 5% growth, the model reaches a Model Value % of 89.0%, and only at 8.5% growth does the model reach 101.7% of current market cap.
The breakeven growth rate is approximately 8.3%. That is the long-term growth assumption where the model value lines up with a company already valued at roughly $363B, showing what the market appears to require from Bank of America's consumer banking, global markets, global banking, and wealth management franchises.
Note: Under the 10% hurdle rate scenario set, BAC crosses 100% Model Value only at ~8.3% growth — at the very top of the tested 2%-8.5% range. The curve is notably flat: model value clears the current market cap only at the final tested point, reaching 101.7% at 8.5% growth.
With BAC only doing double the economy-sustained growth, the shares are still slightly lower than what they are at today. In order to reap the benefit of BAC at $51 in the long term, you need to maintain a steady rate of growth of 8.34% or more.
| Growth (%) | Intrinsic value ($B) | Price/Share ($) | Value/Price (%) |
| 2 | 315.55 | 44.46 | 87.0 |
| 3 | 317.31 | 44.71 | 87.5 |
| 4 | 319.65 | 45.04 | 88.2 |
| 5 | 322.93 | 45.50 | 89.1 |
| 6 | 327.85 | 46.20 | 90.4 |
| 7 | 336.05 | 47.35 | 92.7 |
| 8 | 352.46 | 49.67 | 97.2 |
| 8.34 (Breakeven Rate) | — | ≈51.10 | 100.0 (fair) |
| 8.5 | 368.87 | 51.98 | 101.7 |
JPM vs BAC Stock Performance & Total Returns
The one number that jumps off the page to surprise most readers is that BAC outpaced JPM (+15.79% versus +13.36%) on the trailing 12-months. To be fair, a serious reader looks at the 1Y first. But zoom out: JPM's 3-year (+120.53% vs +83.88%), 5-year (+82.22% vs +20.55%), and ~10-year (+246.83% vs +131.22%) price returns all tilt decisively in JPM's favour.
The five-year total return, which includes price appreciation as well as net income returned to shareholders, further sets JPM apart: ~+116% versus BAC's ~+51%. Investors searching for other companies with strong compounding potential can also explore our Best stocks to buy for long-term growth guide.
The longer-term return gap corresponds to the record of residual earnings. Economic profit of JPM grew by 6.6× from FY2020 to FY2025 while BAC's were kept near zero. The value creation engine was followed by the returns, not the multiple.
Price Returns by Period
| Period | JPM | BAC |
| YTD 2026 (Dec '25 → May '26) | –7.12% | –7.09% |
| 1Y (May '25 → May '26) | +13.36% | +15.79% |
| 3Y (May '23 → May '26) | +120.53% | +83.88% |
| 5Y (May '21 → May '26) | +82.22% | +20.55% |
| ~10Y (Dec '16 → May '26) | +246.83% | +131.22% |
| 5Y Approx. Total Return (incl. payouts) | ~+116% | ~+51% |
Net pay out yield is 6.19% for BAC compared to 4.83% for JPM, and the payout ratio averaged 78.9% over the past 5 years versus 66.9% for JPM. This really is the BAC income investors' case. It's partly because BAC keeps less of that higher payout (and makes a smaller profit above the cost of capital). This reduces long-run compounding.
Growth Drivers & 2026 Outlook
Three structural levers:
1. High ROE: TTM ROE of 16.18%, well above their ~10% cost of capital, meaning the bank grows its book value each year without needing external boosts.
2. Franchise strength: Investment banking, wealth management, and global markets franchises are positioned to benefit strongly if 2026 deal-making or market activity picks up.
3. Strong profitability: Net margin of 31.51%, meaning ~32 cents of economic profit per revenue dollar, which can be amplified by AI-driven productivity and capital-markets fee growth. Investors can also explore our Best AI stocks to buy now in 2026 analysis for related opportunities in the AI sector.
Bank of America's near-term opportunity:
1. NII recovery: Net interest income should improve as the rate cycle evolves.
2. Operating leverage: Revenue growth is expected to outpace expense growth, boosting profitability.
3. Valuation advantage: PEG ratio of 0.93x vs JPM’s 1.63x suggests BAC could have more near-term EPS growth if management meets its 2026 guidance for NII and expenses.
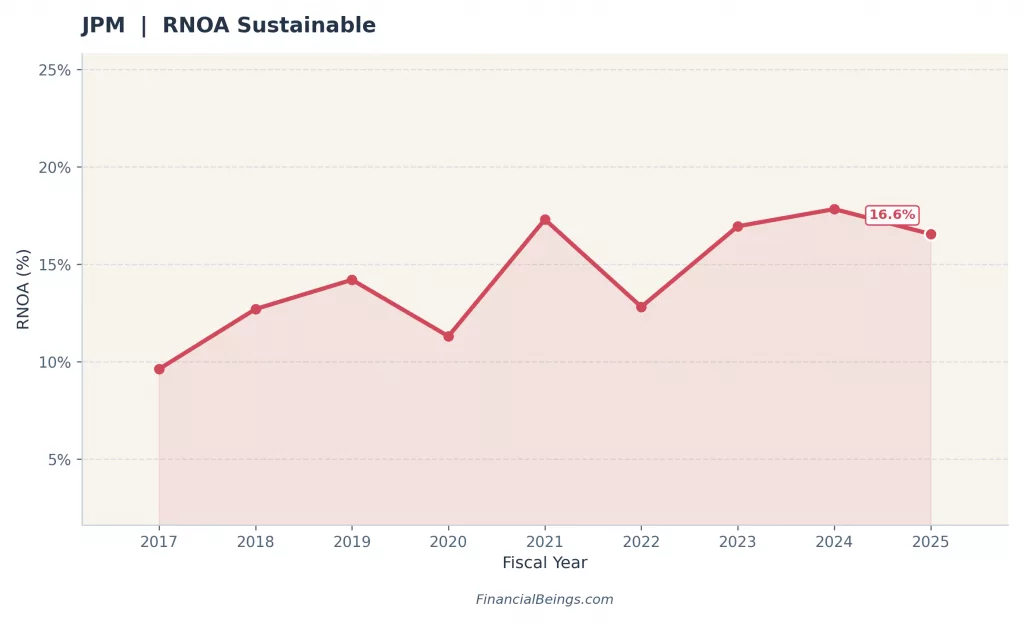
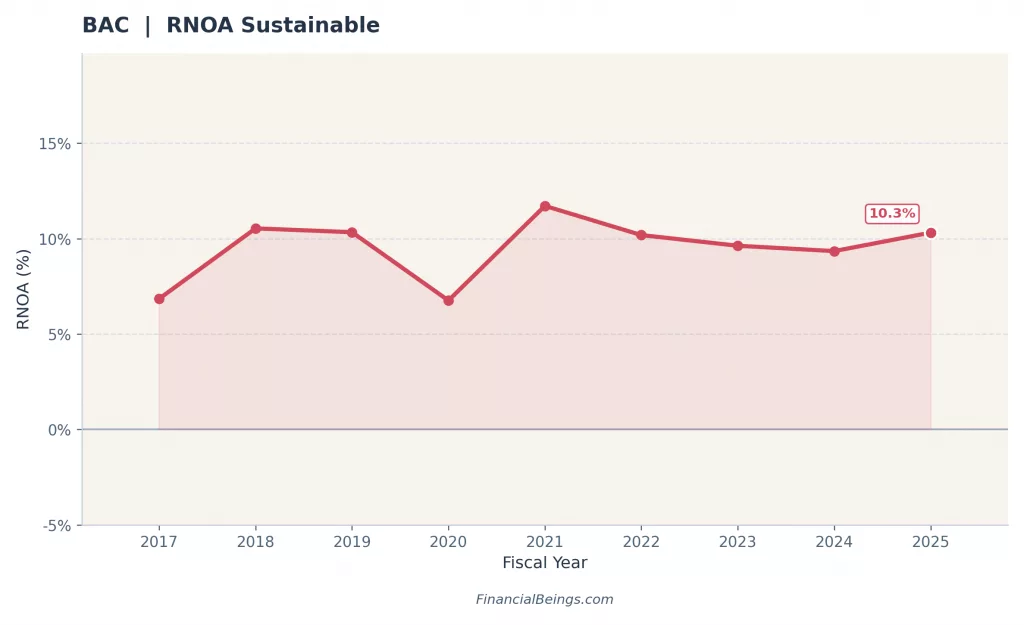
Figure 1 - Sustainable RNOA for JPMorgan (JPM) and Bank of America (BAC), FY2017–2025.
TTM Growth-Engine Ratios
| TTM Growth-Engine Ratio (DuPont) | JPMorgan | Bank of America | What It Means |
| Return on Equity (ROE) | 16.18% | 10.54% | Width of spread that compounds value |
| Return on Capital (ROC) | 4.51% | 3.76% | JPM 75 bps higher on same base |
| Return on Assets (ROA) | 1.20% | 0.91% | JPM 32% more efficient per asset $ |
| Asset Turnover | 0.04 | 0.03 | Revenue extracted per asset dollar |
| Net Margin | 31.51% | 27.32% | JPM keeps 32¢ vs BAC's 27¢ per revenue $ |
| Financial Leverage (Assets/Equity) | 13.46× | 11.63× | JPM operates with thinner equity cushion |
| Equity Ratio (Equity/Assets) | 21.6% | 27.32% | BAC's buffer is thicker — real counterpoint |
| TTM FCFE ($B) | –$78.6B | +$73.8B | Accrual vs cash signal diverge for JPM |
JPM vs BAC Risks, Challenges & Credit Quality
In the last three years both banks have passed all four safety checks. JPM has an "Operating-Return Tier" of "Strong" (RNOA > 15%) and BAC is rated at "Healthy" (8-15%).
Risk Heat Map (H = High · Med = Medium · L = Low)
| Risk Factor | JPM | BAC | Verified Anchor |
| Rate / spread compression | Med | HIGH | BAC deposit-mix more rate-sensitive; ROA 0.91% vs 1.20% |
| Asset productivity erosion | Low | Med | ROA: JPM 1.20% vs BAC 0.91% |
| Balance-sheet leverage | Med | Med | Financial leverage: JPM 13.46× vs BAC 11.63× |
| Capital cushion | Med | Low | Equity ratio: BAC 27.32% vs JPM 21.6% - BAC thicker |
| Capital markets cyclicality | HIGH | Med | JPM IB/markets beta; 31.5% net margin carries more vol |
| Free cash flow (FCFE TTM) | HIGH | Low | JPM –$78.6B deficit; BAC +$73.8B - signals diverge |
| ReOI stability (9-yr) | 3/9 dips | 5/9 dips | BAC negative in 2017, 2020, 2023, 2024 |
Pros, Cons & Investor Scenarios
| JPMorgan Chase (JPM) | Bank of America (BAC) | |
| Pros | Sustainable RNOA 16.95%; residual earnings 6.6× growth FY2020→FY2025 ($3.41B→$22.57B); +23.96% margin of safety at 10% hurdle; +120.5% 3-yr / +82.2% 5-yr price return; Strong tier safety (4/4 checks × 3 yrs) | Beat JPM 1-year return (+15.79%); stronger FY2025 revenue growth (+11.00%); thicker equity cushion (27.32%); positive TTM FCFE (+$73.8B); higher net payout yield (6.19%); cheaper forward P/E (10.12×); lower PEG (0.93) |
| Cons | Trades at 2.33× book, slim error margin if returns compress; sustainable OI after tax declined 2.42% in FY2025; TTM FCFE deficit $78.6B; capital-markets cyclicality embedded in margins | Residual earnings negative in 4 of last 9 years (2017, 2020, 2023, 2024); price embeds 8.34% perpetual ReOI growth on a $0.95B base; 1.32× P/B is mathematically correct for 10.5% ROE, not a discount |
Who Should Buy Which Bank?
| Investor Profile | Our Read |
| Growth / Quality | JPM. The 17% RNOA vs 10% cost of capital does the work. ReOI lens: +23.96% margin of safety at a 10% hurdle. |
| Deep Value / Contrarian | BAC only with conviction that RNOA breaks sustainably above 10%. The FY2025 step-change is supportive; nine years of history are not. ReOI: –8.78% margin of safety. |
| Income-Focused | BAC has the structural edge: net payout yield 6.19% vs 4.83%; 5-yr avg payout ratio 78.9% vs 66.9%. Trade-off: higher payout partly reflects lower retention. |
| Balanced / Both | JPM-heavy barbell captures the compounding spread with optionality on BAC closing the RNOA gap. No single-stock concentration needed. |
Conclusion
According to convention, buy the cheaper bank. From a profit engine that has barely generated sufficient economic profit, it's the cheaper bank that is asking a lot. At $299, JPMorgan is not a steal, but the price it asks for is no more than that the franchise already provides: about 5% annual growth in an economic-profit pool of $22.57B that will continue indefinitely. Bank of America has a price asking for 8.34% perpetual growth off a base of just $0.95B — an engine that was negative in four of the past nine years.
Our FinancialBeings take: The premium bank is the better bet at a serious 10%. Size appropriately, check the NII and efficiency catalysts in §6 and acknowledge a low NII with a correct multiple. For investors who want to explore where the next wave of AI-driven capital spending is flowing, our Best AI data center stocks in 2026 analysis provides a deeper look into the infrastructure behind this growth story.
Frequently Asked Questions (FAQs)
Why does BAC trade at 1.32× book while JPM trades at 2.33×?
The P/B ratio is not a discount ratio, it is rather a return on book ratio. A bank earning ~17% on a 10% hurdle is worth ~2.4× book; one earning ~10% is worth ~1.0× book. The multiples are approximately as they should be in light of residual-earnings math. The lower multiple comes for the lower return, NOT a hidden deal.
Is BAC a value trap?
Bank of America (NYSE: BAC) is not exactly a quintessential value trap. Rather, it is considered as a financial firm with an underlying soundness and a cyclical nature, with the value of the stock fluctuating based on the interest rates, the trends in net interest income (NII) and overall macroeconomic conditions.
Which bank pays the better dividend?
BAC has a higher payout ratio: 78.9% compared to JPM's 66.9% for the last five years and a net payout yield of 6.19% vs 4.83%. The trade-off: it is possible that part of the increase in yield is due to BAC keeping less and receiving less for what it has lost. To see the dividend yields per share, visit each bank's investor relations page.
Which is better, J.P. Morgan or Bank of America?
JPMorgan Chase is generally considered the strongest U.S. bank. It is the largest bank in the United States by assets, has a dominant investment banking business, strong wealth management operations, and a reputation for conservative risk management under CEO Jamie Dimon.
Where will JPM stock be in 5 years?
JPMorgan Chase (JPM) is one of the world's largest and most stable banks. The company is valued at over $700 billion and is known for steady growth and reliable dividend payments.
Over the next 5 years, most analysts expect JPM stock to deliver moderate returns, likely in the single-digit percentage range per year. While the stock could continue to grow, it is generally viewed as a safe, long-term investment rather than a stock likely to double or triple quickly.
References
| No. | Source | Description | Link |
|---|---|---|---|
| 1 | JPMorgan Chase & Co. (2026) | Annual Report 2025 (Form 10-K), U.S. SEC | sec.gov |
| 2 | Bank of America Corporation (2026) | Annual Report 2025 (Form 10-K), U.S. SEC | sec.gov |
| 3 | Bank of America Corporation (2026, April) | Q1 2026 Earnings Release (Form 8-K), U.S. SEC | investor.bankofamerica.com |
| 4 | JPMorgan Chase & Co. (2026) | Investor Relations — dividends & capital returns | jpmorganchase.com |
| 5 | Bank of America Corporation (2026) | Investor Relations — dividends & capital returns | investor.bankofamerica.com |
