Broadcom holds an earnings premium of 30x. Micron is valued at a cycle that can be in its turn. We simulate each of them using our valuation model to determine which stock is mispriced.
Micron is also as overextended as Broadcom, and both the stocks are not cheap. In the most likely scenario of 5% long-term growth, Micron has an intrinsic value of $158.71 per share versus $285.41 (current market price), and Broadcom has an intrinsic value of $125.62 versus $346.10 (current market price). It implies that both are trading at a significant premium to base-case value. Neither of the companies are being priced well in its market and both must sustain high future growth to justify their current market prices.
| Growth assumption | Scenario probability | MU IV/share | MU V/P | AVGO IV/share | AVGO V/P |
| 2% | 5.97% | $113.83 | 24.6% | $84.95 | 26.7% |
| 3% | 11.16% | $124.52 | 26.9% | $94.63 | 29.7% |
| 4% | 16.23% | $138.76 | 30.0% | $107.54 | 33.8% |
| 5% | 18.39% | $158.71 | 34.3% | $125.62 | 39.4% |
| 6% | 16.23% | $188.63 | 40.8% | $152.73 | 47.9% |
| 7% | 11.16% | $238.50 | 51.5% | $197.92 | 62.1% |
| 7.5% | 8.42% | $278.39 | 60.2% | $234.07 | 73.5% |
| 8% | 5.97% | $338.23 | 73.1% | $288.30 | 90.5% |
| 8.5% | 3.98% | $437.96 | 94.7% | $378.68 | 118.8% |
| 9% | 2.49% | $637.42 | 137.8% | $559.43 | 175.6% |
Two semiconductor businesses that are nothing alike
This analogy can only be made when one separates the business models first. Micron is a memory firm that has high exposure to both DRAM and NAND and an even higher exposure to HBM which puts it at the heart of the AI infrastructure demand. Broadcom is another beast: it is a mix of custom silicon, networking, and infrastructure software, now featuring VMware as a part of the offering. The revenue base of Broadcom is wider and its margins are higher but this also contributes to its valuation that becomes so demanding. They are selling a hybrid business to the market combining semiconductor performance with software-style economics.
Broadcom ended FY2025 with a revenue of $63.9 billion, as compared to Micron’s $37.4 billion. The FY2025 RNOA of Broadcom was 42.0% as compared to 22.7% in Micron. Broadcom’s economic value creation per share in 2025 was $3.37; Micron’s was $3.58. The NOA and operating liabilities of Broadcom and Micron were recorded to be $66.4 billion and $88.5 billion, and $35.6 billion and $27.3 billion, respectively. Such differences are not trivial. They present two quite different capital structure, margin, and earnings sustainability stories.
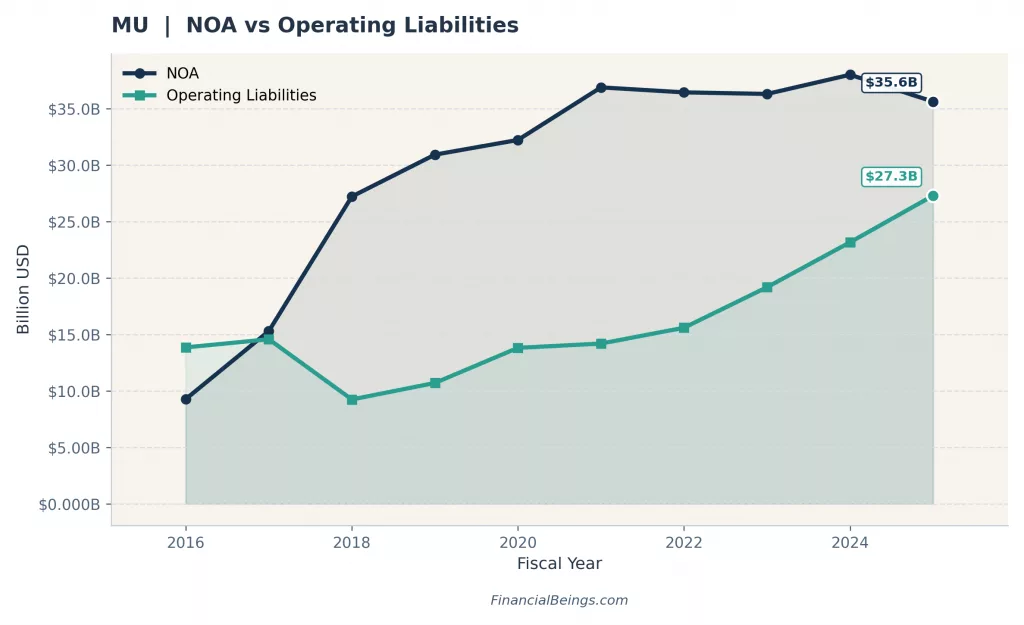
Figure 1. Micron NOA vs operating liabilities.
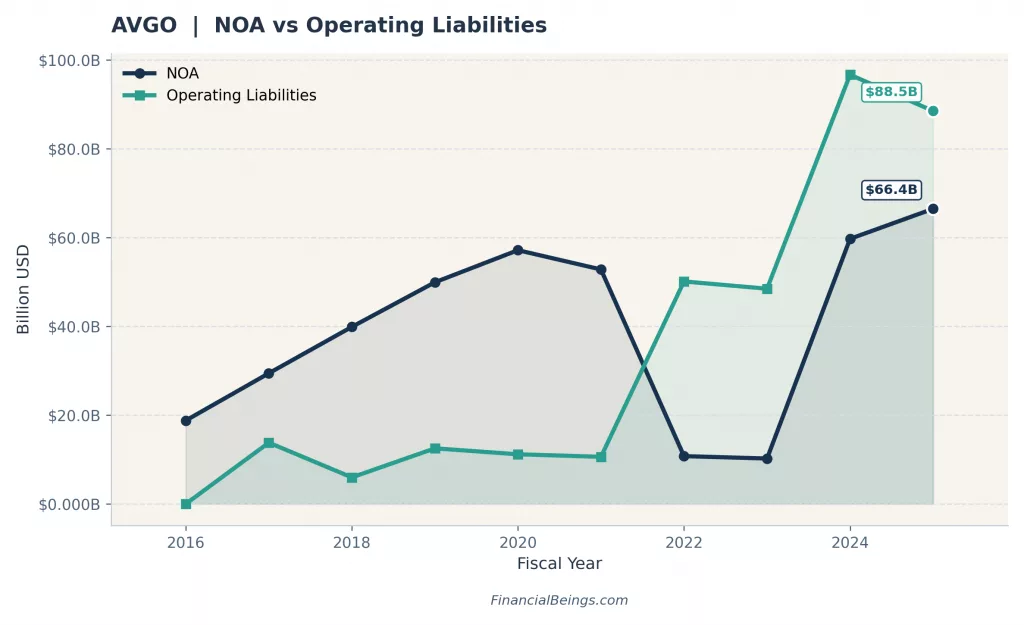
Figure 2. Broadcom NOA vs operating liabilities.
However, Broadcom has a very different capital structure and model of operation with a NOA of $66.4 billion and operating liabilities of $88.5 billion.
Micron’s business: memory, HBM, and the AI Supercycle
The case of Micron is volatile but easy. The company is a seller of memory and storage, and its angle of AI is HBM. The product and AI angle created by Micron position HBM as a component of the AI infrastructure, with HBM3E and HBM4 being developed to work with next-generation AI platforms and in the data-centers.
The economic situation is changing at a rapid rate. FY2025 revenue is $37.4 billion. It has an established PM of 23.1%, ATO of 0.98, and ReOI of $4.84 billion. The key question in the model is whether Micron has the ability to sustain such growth levels.
The answer is obvious: revenue increased from 2023 to 2025, with revenue standing at $15.5 billion and $37.4 billion, respectively, and EBITDA at $2.5 billion and $18.5 billion, respectively. The free cash flow also changed from -$6.1 billion to $1.7 billion in 2025.
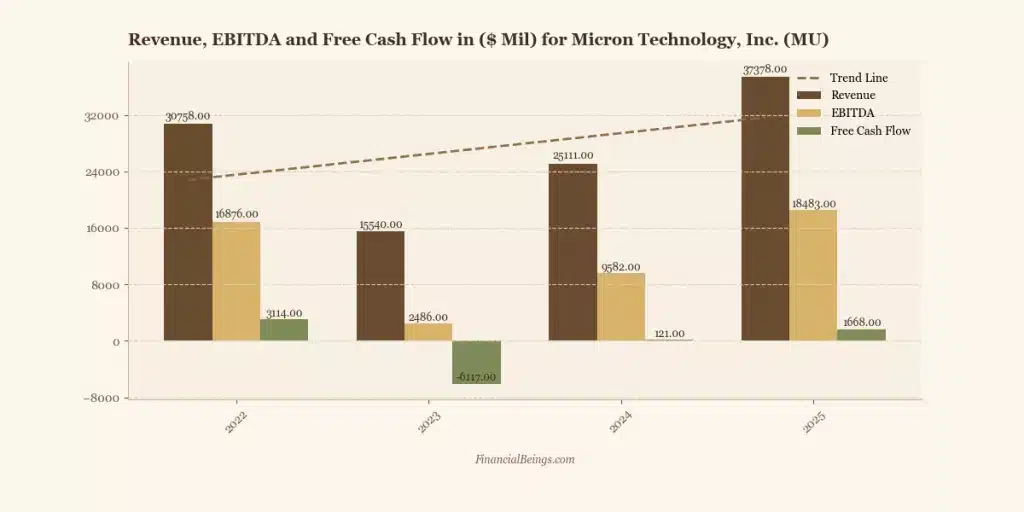
Figure 3. Micron revenue, EBITDA, and free cash flow (2022–2025).
Broadcom’s business: custom silicon, networking, and VMware
The structure of Broadcom is wider and more stable. The company identifies itself as a leader in technology that covers semiconductors, enterprise software, security, AI infrastructure, custom XPUs, and networking. Another recent acquisition undertaken by Broadcom was that of VMware in November 2023, and since then, VMware Cloud Foundation became a fundamental private and hybrid cloud stack. That is important since it transforms Broadcom’s chip story into a chip-software story.
The FY2025 revenue is $63.9 billion, PM 39.2%, ATO 1.07, ReOI $19.07 billion. This is also favorable: revenue is growing since 2022 when it stood at $33.2 billion, also increasing in 2025 when it reached $63.9 billion. EBITDA reached to $34.7 billion in 2025 up from $19.2 billion in 2022 and the free cash flow increased to $16.3 billion in 2022 to $26.9 billion by 2025. It is a high-quality working story. The issue is not quality. The question is to what extent the price already has that quality.
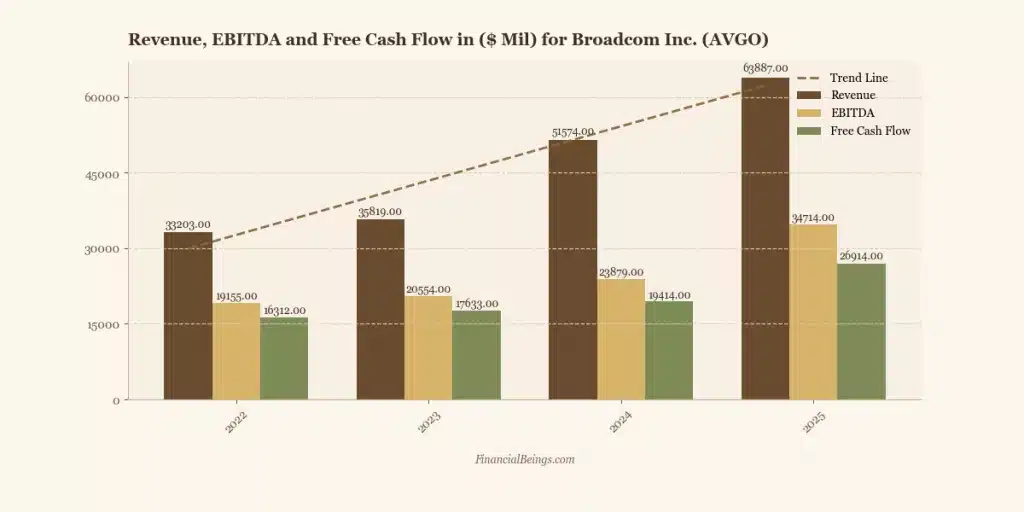
Figure 4. Broadcom revenue, EBITDA, and free cash flow (2022–2025).
The valuation gap: what the market is pricing in?
The valuation gap between Micron vs Broadcom stock does not concern which company is superior or what the market is already expecting each company to accomplish. Each stock is valued at high, continued growth, though the level of execution demanded is varied.
The intrinsic value of Micron at 5% perpetual growth rate is $158.71 per share. The intrinsic value of Broadcom is also low in relation to the current market price of $346.10 at 5% perpetual growth is $125.62. This serves to indicate that both stocks are significantly overpriced to base-case fundamentals. The market is not valuing normal growth – it is valuing high performance.
The gap is still large as we progress up the growth curve. Micron at 7% growth is at $238.50 per share, which is less than its present market price and Broadcom is at $197.92, a huge separation between intrinsic and speculative value at current market level. At 8%, both stocks are not valuation worthy. Broadcom has surpassed the current market price at 8.5% with a value of $378.68 per share whereas Micron has not exceeded its market price, getting to $437.96 with an intrinsic value-to-price ratio of 94.7%.
The main point is both the companies are trading at an aggressive growth rate, yet Broadcom must achieve almost perfect performance in various fronts including semiconductors, AI infrastructure, and VMware integration to earn its valuation. Although still costly, Micron has a visible earnings recovery cycle.
Simply put, the market is requesting Micron to continue a good cycle – but it is requesting Broadcom to continue perfection.
What Broadcom’s multiple demands from the business?
The numerous requirements at Broadcom are almost flawless. Broadcom is valued at $125.62 per share at a perpetual growth rate of 5%. At a longterm growth rate of 7%, it is worth $198 per share. It is only when the perpetual growth rate is near 8.5%, that, Broadcom is over current market cap, and the intrinsic value to current market cap (V/P) ratio is 119% making it undervalued by 19%.
It is equivalent to saying that investors are investing in a business today that has to continue growing at the same rate with the AI chip cycle and the VMware software transition continue to work harmoniously at the same time. Broadcom may deliver that. It has an excellent trend in its current revenue, EBITDA and free-cash-flow. However, the stock seems to be priced as excellent, with no margin of safety. It is valued as a high growth compounder.
What Micron’s price implies about the cycle?
Micron as well appears to be costly; however, the excessive pricing can be explained by the stock that is related to a cycle which might still be performing better. Growth rate of 5% makes Micron worth $158.71 per share. At 7%, the value rises to $238.50. It is near perpetual growth rate of 8.5% that the stock has an intrinsic value of $338.23 that is still under the current market cap and only covers 94.7% shown by V/P ratio in our interactive chart.
Micron is not cheap either. Nevertheless, the rationale behind its high price, at least, is associated with a genuine earnings recovery. Revenue increased more than twice between 2023 and 2025, EBITDA has recovered significantly and free cash flow became positive. The issue is sustainability. The model is essentially questioning whether Micron will be able to sustain such a cycle after the current memory upswing flames off.
Interactive valuation model
| Growth (%) | AVGO | MU | ||||
|---|---|---|---|---|---|---|
| Intr. Value ($B) | Price / Share | V/P % | Intr. Value ($B) | Price / Share | V/P % | |
V/P > 100% = The stock screens undervalued under that growth assumption. V/P < 100% = The stock screens overvalued; the market price is ahead of the model value. V/P = 100% = The stock is fairly valued at that scenario.
In the updated dataset, AVGO reaches fair value at the top end of the range while MU remains just below it. AVGO rises to roughly 118.8% V/P at 8.5% growth, while MU reaches about 94.7% V/P at the same assumption.
Note: The model now implies AVGO needs something close to the 8.5% terminal growth case to move above fair value, while MU still screens slightly overvalued even at that upper bound.
Readers can evaluate growth estimates for Micron and Broadcom ranging from 2% to 9% using the interactive growth scenarios. Intrinsic value per share, V/P ratios, and predicted returns can be observed.
The AI exposure: different vectors, different risks
Many investors have combined Micron and Broadcom into a single AI semiconductor category, but their AI exposure is very distinct. Micron is in the middle of the AI infrastructure with memory, and specifically with the high-bandwidth memory (HBM), crucial in the training and execution of large AI models. With the increase of AI workloads, Micron is an almost direct beneficiary of AI development because of its sensitivity to compute and thus its memory demand. Simply, the higher the number of GPUs and the size of the model, the higher the amount of memory that the system will need.
Broadcom, however, is involved in AI with custom silicon (ASICs), enterprise software and networking. Its purpose is not closely associated to volume as in the case with memory, but instead to architecture choices of hyperscalers. When the companies decide to use custom chip instead of standard GPUs, it is the advantage for Broadcom. If they are keen on high-speed networking or built-in cloud stacks, then Broadcom gets an advantage once more. This establishes numerous revenue streams, and also dependency on customer approach and multi-year technology tracks.
Such difference makes risk profiles very different. The most important risk of Micron is its prices, in case there is an increase in supply of memories or demand collapse, the margins can shrink very fast. Nonetheless, its customer base is extensive and is connected to the general AI development.
Concisely, Micron is scalable to AI, and Broadcom is structurally AI enabler. One is based on the size of AI; the other one is based on the construction of AI.
Micron’s AI exposure: HBM as GPU infrastructure
The official product pages of Micron officially present the AI connection. According to the company, HBM is under the Non-Neural network portfolio of the AI data-centers, and both HBM3E and HBM4 are designed to run on next-gen AI platforms, with high bandwidth and enhanced power efficiency.
The RNOA of Micron returned to 22.7% in 2025 after becoming negative in 2023 and Economic value created increased to $3.58 per share in 2025 compared to negative $9.90 in 2023. That is precisely what a robust memory cycle recall appears to be.
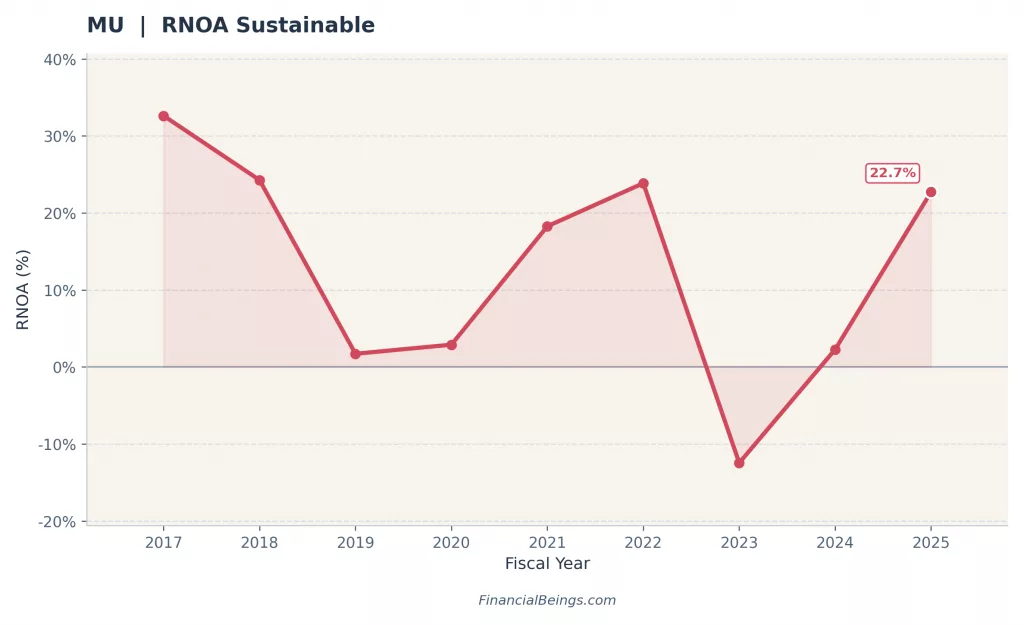
Figure 5. Micron RNOA (2017–2025).
Micron recovers RNOA to 22.7% in 2025 demonstrates how strongly the business has recovered due to the current memory up cycle.
Broadcom’s AI exposure: custom silicon as GPU alternative
The exposure of AI at Broadcom is different. The company showcases AI infrastructure, custom XPUs, and networking offerings on its official site, implying that its thesis is more aligned with the realization of hyperscale AI technologies with the help of custom silicon and connectivity. The activity of Broadcom in the context of private and hybrid cloud infrastructure is quite extended by VMware as well.
The power of the operating data is behind that. According to the 2025 RNOA presented by Broadcom, it is projected at 42.0% in 2025 and the economic value creation per share is $3.37 per share. It is also a highly lucrative franchise. It is not a matter of the strength of the business. The question is whether the price of these stocks can sustain such strength for an extended period of time.
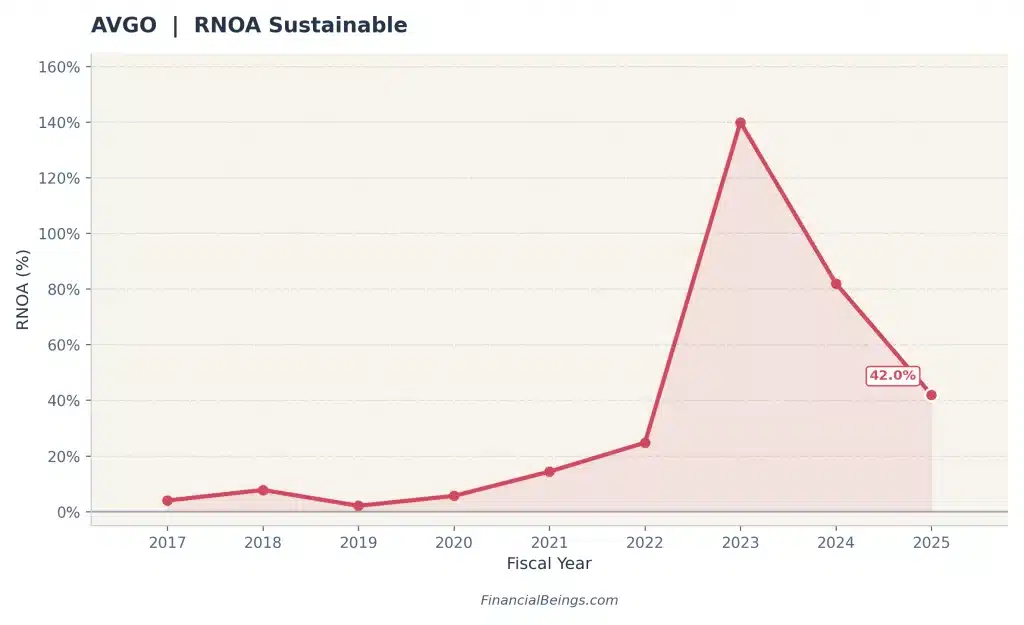
Figure 6. Broadcom RNOA (2017–2025).
Broadcom’s 2025 RNOA of 42.0% offers a far more sustainable profitability profile than Micron’s, even after reaching its peak.
Risk scenarios: where each thesis breaks down
The Micron and Broadcom are priced by market to perform well and this means not business failure, but expectation failure. The intrinsic value of Micron and Broadcom are, at the top-probability 5% growth rate example is $158.71 and $125.62 against a market price of $285.41 and $346.10, respectively. This spread implies that both stocks have already factored in above-normal growth and have no room for error.
For Micron, the bear case would be a classic memory cycle reversal. Revenue has already turned upside down with the $15.5B in 2023 revised to $37.4B in 2025, and RNOA is revived to 22.7%. The risk is that this power is peak-cycle power. When the supply of DRAM grows or the demand decreases, the price may drop rapidly to squeeze the margins. HBM, which is considered a structural tailwind, may lose the pricing power as well in case of the growth of supply. In this case, Micron will not require falling earnings to signify a shift in its direction to its $158 -$188 per share intrinsic value range. that the business can still be structurally strong but the market psychology of fear may drag down the share price.
Broadcom has a more structural bear case. The business has a strong revenue of $63.9B and a high RNOA, which stands at 42.0% yet the valuation presupposes the high growth rates. With a growth rate of 7%, the intrinsic value is only $197.92 which is nowhere near the current levels. The risk is execution in a variety of ways: VMware integration will not create the margins expected, ASIC growth will be sluggish if hyperscalers slow their spending, and pricing pressure will compress the margins. Compared to Micron, Broadcom lacks a cyclical nature to revert its story that can be its drawback if the AI expenditure lags in short term as it is based on high expectations.
What it means is that Micron declines when the cycle turns and Broadcom declines when perfection falters. Both are realistic scenarios and both scenarios are already relevant at the prevailing prices.
Micron bear case
Micron bear case is easy; the memory cycle declines earlier than anticipated by the market. Loosening DRAM and NAND supply could decrease price rapidly. The marginal premium might also squeeze in case HBM, over time, becomes less supply-constrained. That would be significant since the recent recovery by Micron has been rapid. Revenue increased from $15.5 billion in 2023 to $37.4 billion in 2025 and RNOA bounced back from a negative in 2023 to 22.7% in 2025.
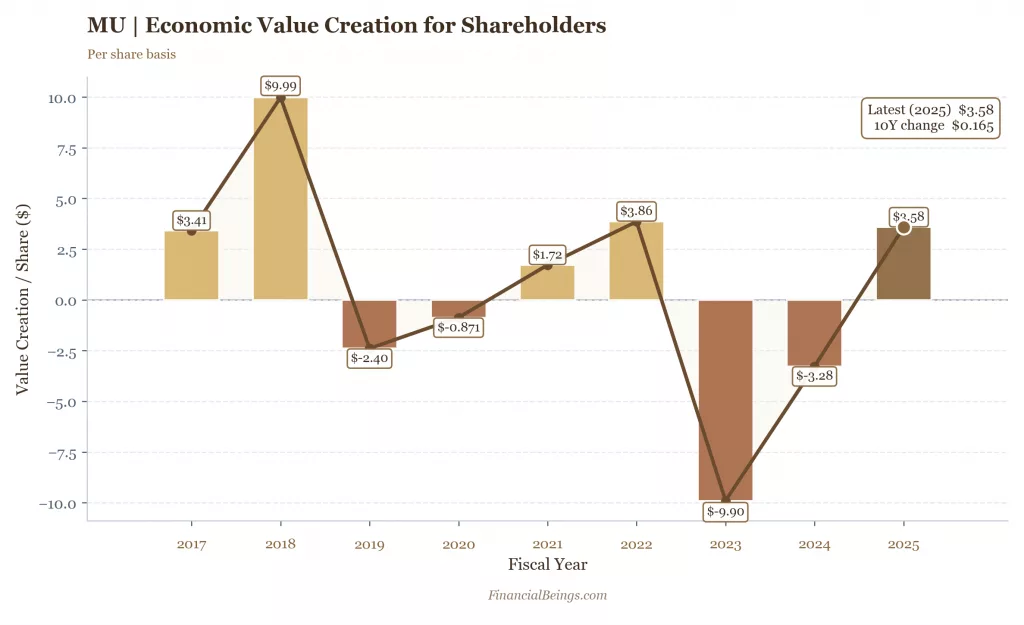
Figure 7. Micron economic value creation per share (2017–2025).
The valuation reveals that at such perpetual growth rate as 6%, Micron would only have an intrinsic value worth of $188.63 per share which is considerably lower than its value of $285.41 in the short-term. The multiple can shrink instantaneously in case the market starts to price Micron towards base or conservative cases, whereas the company can still be making a profit. And that is the risk of purchasing cyclical strength too late.
Broadcom bear case
The argument of the bear case of Broadcom is an execution issue rather than a cyclical issue in the industry. The VMware integration is to be kept functioning. AI-custom-silicon needs to continue to grow. The network adapters need in data centers should remain viable. When such pieces fail, then the stock will be more exposed since its value already presupposes an extremely successful result. At 8.5% growth, Broadcom is on a narrow road to achieving a much-better value.
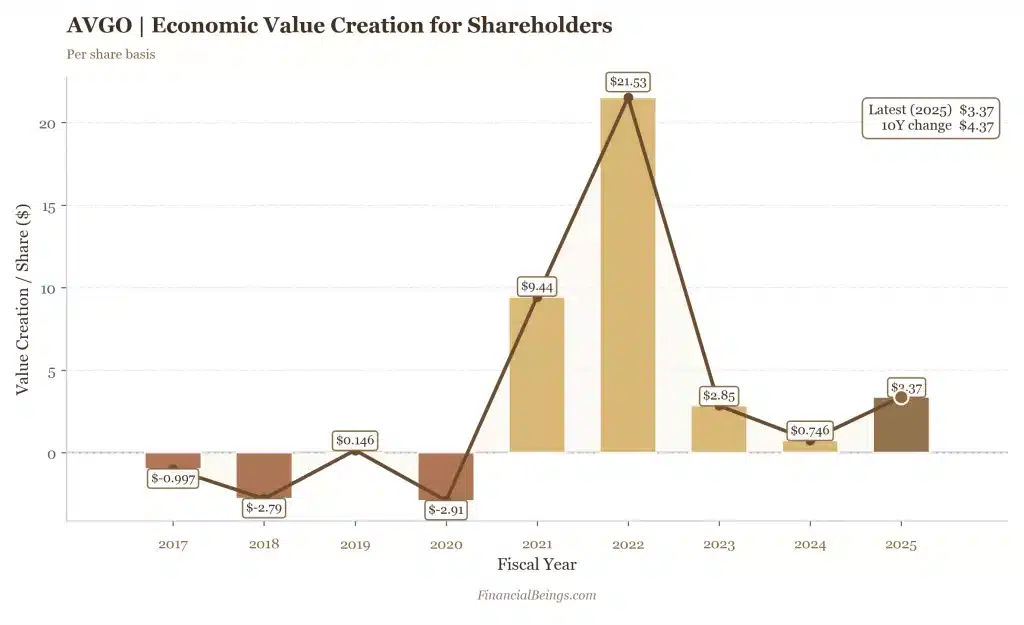
Figure 8. Broadcom economic value creation per share (2017–2025).
A quality trap also exists here. The business of Broadcom is safer since it is more robust. However, it is the same strength which propelled the premium. In 2025, revenue increased to $63.9 billion, EBITDA to $34.7 billion and free cash flow to 26.9 billion. It is supposed as though that engine would continue to compound without much interference. In case of VMware underperformance in margins, increasing custom silicon not as fast as it should have been, or customer exposure to suppliers is not diversified, the valuation could be downgraded even as the business is performing well.
Portfolio recommendations
The key Positioning to Micron and Broadcom are not in selecting a winner, but in matching each share with the assumptions of the investor regarding growth and risk tolerance. Both stocks are set at a price level that is above base-case intrinsic value, and thus, there should be selective rather than aggressive portfolio allocation.
Growth portfolio
With assumptions of aggressive investors (7%-8% growth), both Broadcom and Micron can be considered high risk-high reward companies , but not the value ones. Micron has an IV range of between $238.50 and $338.23 whereas Broadcom has bwtween $197.92-$288.30. Both stocks are at less than current market prices. Both should be considered as momentum holdings as opposed to valuation-based picks in growth portfolios. The position in Broadcom can be opened as a long-term quality company; Micron is worthy of cyclical aspect. Both should not be given oversized allocations.
Base portfolio
At the base case, the solution is clear cut. Micron at $158.71 and Broadcom at $125.62 both appear to be grossly overvalued compared to the current market prices of $285.41 and $346.10 respectively. The most likely case is the 5% growth and none of the stocks are at this level. Balanced portfolio must remain underweight in both stocks and should wait for better entry levels.
Conservative portfolio
Neither stock can be invested in, based on valuation at a growth of 2% to 4%. Micron has an intrinsic value range between $113.83 to $138.76 while Broadcom is between $84.95 to $107.54 per share. These are steep discounts to the existing market prices, and this implies that conservative investors have to wait. At the existing price, no margin of safety is in either stock as per our analysis.
What Investors should know
The conclusion is obvious: Micron is a good fit to cyclical opportunity portfolios, and Broadcom is a good fit to high conviction growth portfolios but not a good fit either to a value-oriented allocation at present.
Verdict: which stock is mispriced?
Both Micron and Broadcom are trading at substantial premiums to their base-case intrinsic values, yet the amount of growth that is required is material. When the growth rate remains at 5%, Micron has an intrinsic value of $158.71 per share when compared to Broadcom at $125.62. Both stocks are overvalued at current market prices as they both need to enhance growth in order to be worth the price.
The gap starts to decrease, though asymmetrically as the growth assumptions become stronger. Micron at 7% perpetual growth has a value of $238.50 per share and Broadcom shows $197.92 per share price, which is still low compared to the current market price. At 8% growth rate Micron’s price is $338.23 and Broadcom rises to $288.30 but only Broadcom’s intrinsic value crosses the market cap at 8.5% growth ($378.68 per share).
This is the mispricing which is characterized by this difference. Broadcom and Micron need focused and higher-growth direction to warrant their valuation, that is, investors are paying a greater amount per unit of anticipated growth.
Caution must be exercised for both stocks at current market prices and investors should wait for better entry points for better margin of safety.
For another angle on Broadcom’s relative value, our AMD vs Broadcom comparison asks which semiconductor name is better positioned for 2026’s AI boom.
Frequently Asked Questions (FAQs)
What is Micron’s intrinsic value in 2026?
The intrinsic value of Micron is based on growth assumptions. At the most likely 5% case, it is $158.71 per share. With a higher growth (7-8 percent), the value will go up to $238.50-$338.23. This is a range that implies doubt on the memory cycle and the HBM-driven requirement.
Is MU or AVGO better long term?
In business terms, Broadcom is in a better position because it has increased margins, diversification, and software integration. Nevertheless, Broadcom has a superior risk-reward ratio when it comes to valuation. That is why MU vs AVGO valuation is based on whether an investor is quality-focused or entry-price focused.
Which is the best semiconductor stock for 2026 at current prices?
Both Micron and Broadcom do not have a high margin of safety at today’s prices. To investors who might query the question of the best semiconductor stock 2026, best answer depends on, timing is the key, as Micron is better placed on cyclical recovery exposure and Broadcom on long-term growth, although both might be going to need superior performance levels to warrant investment.
Is Micron or Broadcom more exposed to AI?
Both stocks are exposed to AI as they are powering the AI technology around the world. Micron is more exposed in term of focused HBM memory demand while Broadcom is structural due to multiple product offerings for different AI infrastructure levels e.g. XPUs, VMware and networking.
Which semiconductor stock has a better margin of safety in 2026?
Neither offers margin of safety for investors. Micron and Broadcom both require perfect execution to justify current price. At 5% perpetual growth rate intrinsic value for Micron is $158.71 vs. a market price of $285.41, and Broadcom’s is $125.62 vs. $346.10.
What growth rate does Broadcom need to justify its valuation?
Broadcom requires approximately 8.5% perpetual growth to exceed the current market price — at that assumption, intrinsic value reaches $378.68 per share, an intrinsic value to current market price (V/P) ratio of 118.8%. The AI boom has lifted the current market price for Broadcom for perfection instead of fundamentals. A drawdown from current price due to sensitivity of future developments is likely.
All calculations and valuation estimates are FinancialBeings’ own, based on data sourced from SEC filings of AVGO (10K and 10Q) and MU (10K and 10Q), use or reproduction before prior approval is prohibited.
