
Amazon’s share price requires more long-term growth than Nvidia’s in this valuation model. At a 10% required return, the market-implied growth rate is approximately 8.34% for Amazon and 7.59% for Nvidia.
That is the starting point for this Amazon vs Nvidia stock comparison. The question is how much future growth investors already pay for, and whether each business can earn attractive returns on the capital needed to deliver it. For a standalone view of each company, see our analysis of Amazon’s intrinsic value and Nvidia’s intrinsic value.
Nvidia produces substantially higher reformulated profit margins and returns on operating assets in the available year-to-date figures. Amazon offers exposure to cloud computing alongside its other businesses, but its growing operating asset base makes capital efficiency an increasingly important part of the investment case.
Neither observation settles which stock is safer. Together, they explain what investors must believe about each company.
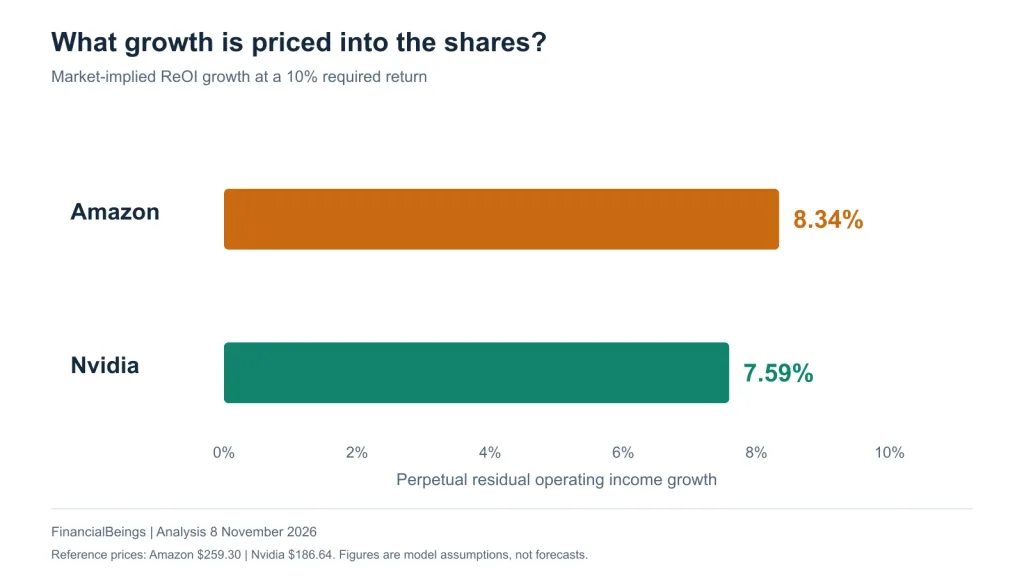
Figure 1. Amazon requires the higher perpetual residual operating income growth rate at the reference prices. FinancialBeings calculations, 8 November 2026.
Amazon vs Nvidia Stock at a Glance
Amazon carries the higher implied growth requirement, while Nvidia reports the stronger YTD profitability in the reformulated accounts. The reporting periods differ, so the profitability figures require careful interpretation. If you are new to the idea, our guide on how to find the growth rate of a stock explains what implied growth means.
| Measure | Amazon | Nvidia |
| Ticker | AMZN | NVDA |
| Reference share price | $259.30 | $186.64 |
| Market-implied ReOI growth | 8.34% | 7.59% |
| Required return used in valuation | 10% | 10% |
| Latest YTD period ending | 30 September 2026 | 26 July 2026 |
| Months in YTD period | Nine | Six |
| YTD revenue | $584.069 billion | $177.836 billion |
| Opening fiscal-year net operating assets | $457.970 billion | $119.035 billion |
| YTD reformulated operating income after tax | $115.868 billion | $117.537 billion |
| YTD reformulated profit margin | 19.84% | 66.09% |
| YTD asset turnover | 1.275x | 1.494x |
| YTD return on net operating assets | 25.30% | 98.74% |
Source: FinancialBeings calculations from company financial statements. YTD measures are not annualised. Profit margin means reformulated operating income after tax divided by revenue, rather than GAAP operating margin.
The valuation and profitability figures serve different purposes. The YTD figures describe operating performance during the current fiscal year. The sensitivity valuations use completed fiscal-year fundamentals: Amazon FY2025 and Nvidia FY2026.
The reference prices are valuation inputs captured on 7-8 November 2026, rather than live quotes. The companies also have different fiscal reporting calendars.
Is Amazon Still the Safer AI Stock?
Amazon’s broader business mix does not automatically make its shares the safer investment. Investors also need to assess cash requirements, financing and the price paid for future growth.
Amazon reported trailing-twelve-month operating cash flow of $168.3 billion, alongside a $42.4 billion free cash flow outflow. Its balance sheet showed long-term debt rising from approximately $65.6 billion at the end of 2025 to $173.1 billion at September 2026. Management maintained guidance for approximately $220 billion of cash capital expenditure in 2026. Amazon Q3 2026 results
Strong cash generation and negative free cash flow can coexist when investment spending is large. The investment case therefore depends partly on what Amazon earns from the infrastructure it is building.
Nvidia presents a different cash allocation picture. It reported returning approximately $26 billion to shareholders through repurchases and dividends in fiscal Q2 2027, and announced a quarterly dividend of $0.25 per share. Nvidia fiscal Q2 2027 results
Those distributions demonstrate the company’s capital allocation choices. They do not establish that its future profits or share price are secure. For a broader view of the company, see is Nvidia a good stock to buy now.
Business diversification, financial flexibility and valuation risk are separate questions. Amazon may appeal to investors seeking several sources of earnings, while Nvidia offers more direct exposure to AI infrastructure demand. Either investment can disappoint if the price assumes more durable profitability than the business ultimately delivers.
For another perspective on Amazon’s capital efficiency and diversification, see our Amazon vs Apple stock comparison.
How Does Amazon’s AI Spending Become Nvidia’s Revenue?
Amazon and Nvidia participate in different parts of the same investment cycle. AWS provides computing services to customers, while Nvidia supplies technology used to build that computing capacity. You can compare other companies in this chain in our list of AI data center stocks, and see how AWS growth compares with its main cloud rival in Microsoft vs Amazon AWS.
Their commercial relationship is substantial. AWS and Nvidia announced an expansion involving two million additional GPUs and supporting infrastructure in August 2026. AWS and Nvidia partnership announcement
That relationship creates different financial obligations. A cloud provider must purchase or develop infrastructure, bring capacity online and earn revenue from customers over time. A supplier’s results depend on selling its products and supporting their adoption.
The timing of spending and returns therefore matters. Infrastructure can enter the operating asset base before it reaches mature utilisation. Revenue growth alone does not show whether the resulting investment earns an adequate return.
This is an economic relationship, rather than a direct accounting reconciliation. Amazon’s total capital spending cannot be treated as Nvidia revenue: it includes other equipment, facilities and infrastructure.
Can Trainium Reduce Amazon’s Dependence on Nvidia?
AWS offers both its own Trainium accelerators and Nvidia GPUs. Amazon describes this as providing customers with a choice of computing infrastructure. Amazon’s discussion of Trainium adoption
Custom silicon gives Amazon another way to influence computing costs and the economics of its cloud services. Its financial value depends on development costs, customer adoption and the workloads it serves.
For Nvidia, alternatives create potential competitive pressure. Their existence alone does not quantify lost sales or market share.
The valuation question remains measurable: can Amazon improve the earnings generated by its infrastructure, and can Nvidia sustain attractive margins as customers gain more alternatives?
Our Nvidia vs Broadcom comparison explores another part of this competitive landscape: GPUs, custom silicon and infrastructure software.
Which Company Earns More on Its Operating Capital?
Nvidia’s available YTD results show substantially higher reformulated profitability. Understanding that result requires separating profit margin from asset turnover.
Return on net operating assets, or RNOA, measures operating income after tax against the net operating capital supporting the business. In these YTD calculations, the denominator is opening fiscal-year net operating assets.
The relationship is:
Profit margin x asset turnover = RNOA
Profit margin measures income earned per dollar of revenue. Asset turnover measures revenue generated per dollar of opening net operating assets.
For Amazon:
19.8380% x 1.275343 = 25.3003% YTD RNOA
For Nvidia:
66.0927% x 1.493981 = 98.7412% YTD RNOA
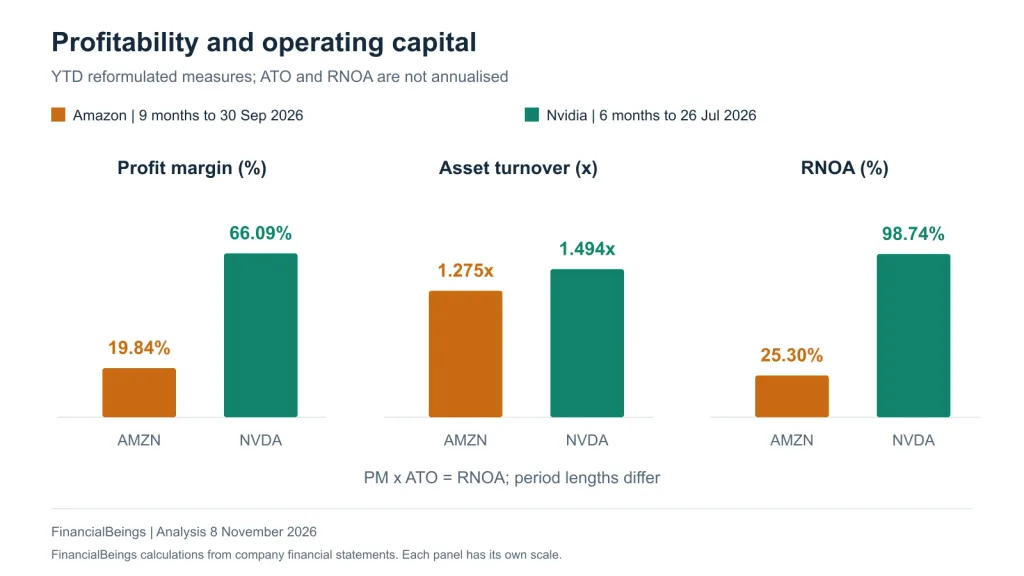
Figure 2. YTD reformulated profitability. Amazon covers nine months to September 2026; Nvidia covers six months to July 2026. ATO and RNOA are not annualised.
The calculations require two qualifications. First, Amazon’s figures cover nine months and Nvidia’s cover six. Asset turnover and RNOA accumulate over the reporting period. The raw percentages therefore should not be presented as directly comparable annual returns.
Second, these are reformulated accounting measures. Their income classifications and tax treatment differ from the companies’ headline GAAP operating income.
The margin figures nevertheless identify an important difference within the analysis. Nvidia retains far more reformulated after-tax operating income per revenue dollar. Its YTD asset turnover is also higher despite covering a shorter period. The same margin and turnover framework is applied to Amazon vs Apple and Meta vs Nvidia.
Asset Turnover Is Falling at Both Companies
Amazon’s YTD asset turnover fell from approximately 1.514x to 1.275x against the corresponding prior-year period, a decline of 15.8%.
Nvidia’s fell from approximately 1.958x to 1.494x, a decline of 23.7%.
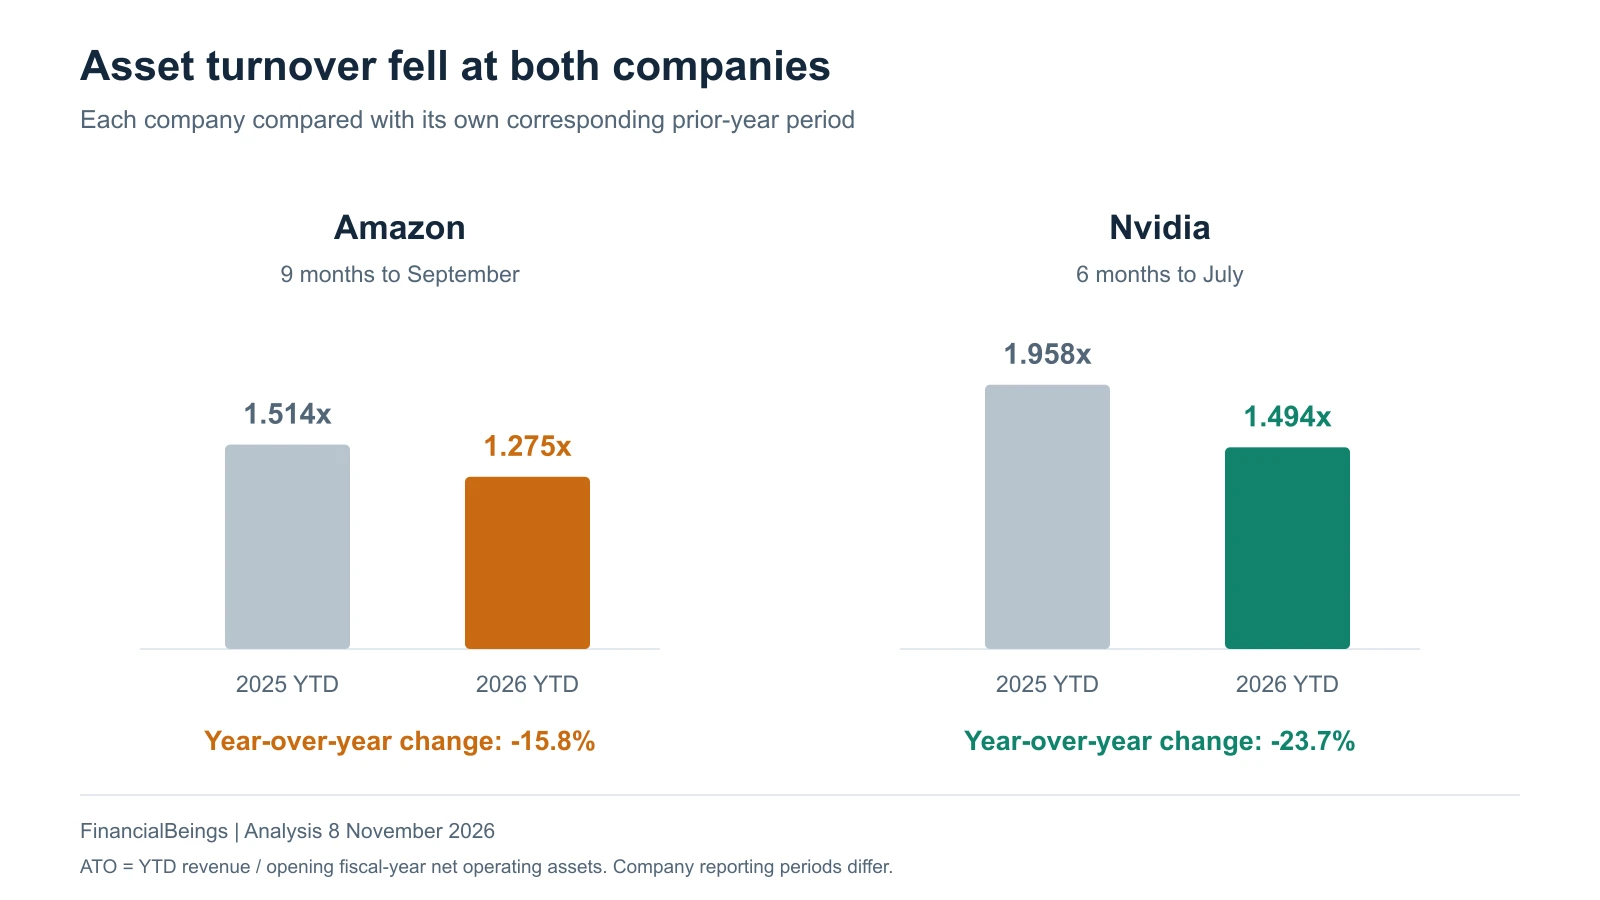
Figure 3. Each company’s YTD asset turnover is compared with its own corresponding prior-year period. Amazon covers nine months; Nvidia covers six months.
Both businesses show a growing operating capital requirement relative to their YTD sales.
Falling turnover is not automatically evidence of poor investment. New assets may support future revenue. But investors need subsequent results to demonstrate that those assets can produce sufficient income.
A high margin helps a company tolerate lower turnover. It does not make capital efficiency irrelevant.
Is Nvidia Really More Expensive Than Amazon?
Nvidia requires less perpetual residual operating income growth in this model, despite its stronger profitability. That is a more specific conclusion than declaring it cheaper on every valuation measure.
A conventional price-to-earnings comparison uses reported net income. This analysis instead examines operating income, operating assets and the income remaining after charging for capital.
The distinction is material for Amazon. Its reported nine-month GAAP operating income was approximately $79.4 billion, compared with YTD reformulated operating income after tax of approximately $115.9 billion. The company also reported substantial non-operating income during the period. These measures cannot be substituted for one another. Amazon Q3 financial statements
The valuation sensitivities use sustainable operating income from completed fiscal years. This separates the valuation base from the latest YTD reformulated profitability.
Residual operating income, or ReOI, is the operating income left after deducting the required return on operating capital. A company creates positive residual income when its operating earnings exceed that capital charge.
For a standalone examination of Nvidia’s growth assumptions, see our Nvidia intrinsic-value analysis.
The market-implied growth calculation then asks:
What continuing growth rate in ReOI makes the model value equal the reference market price?
Amazon’s result is 8.34%, compared with 7.59% for Nvidia.
These are long-term model assumptions. They are not next-quarter revenue forecasts, analyst earnings estimates or predicted shareholder returns.
The difference suggests that Amazon’s reference price places the higher growth requirement on its particular earnings and capital base. Whether that requirement is reasonable depends on future profitability, reinvestment and the durability of economic returns.
What Are Amazon and Nvidia Worth at 2% to 8% Growth?
At a 10% required return, both valuations depend heavily on the assumed growth rate. Nvidia’s model value exceeds its reference price at 8% growth, while Amazon’s remains below its reference price throughout the range.
| Perpetual ReOI growth | Amazon value per share | Amazon value / price | Nvidia value per share | Nvidia value / price |
| 2% | $83.76 | 32.30% | $60.87 | 32.61% |
| 3% | $90.29 | 34.82% | $68.63 | 36.77% |
| 4% | $99.01 | 38.18% | $78.98 | 42.32% |
| 5% | $111.21 | 42.89% | $93.48 | 50.08% |
| 6% | $129.50 | 49.94% | $115.22 | 61.73% |
| 7% | $160.00 | 61.70% | $151.45 | 81.15% |
| 7.5% | $184.40 | 71.11% | $180.44 | 96.68% |
| 8% | $220.99 | 85.23% | $223.92 | 119.97% |
Source: FinancialBeings sensitivity calculations at a 10% hurdle rate. Reference prices: Amazon $259.30 and Nvidia $186.64. Percentages compare model value with those prices.
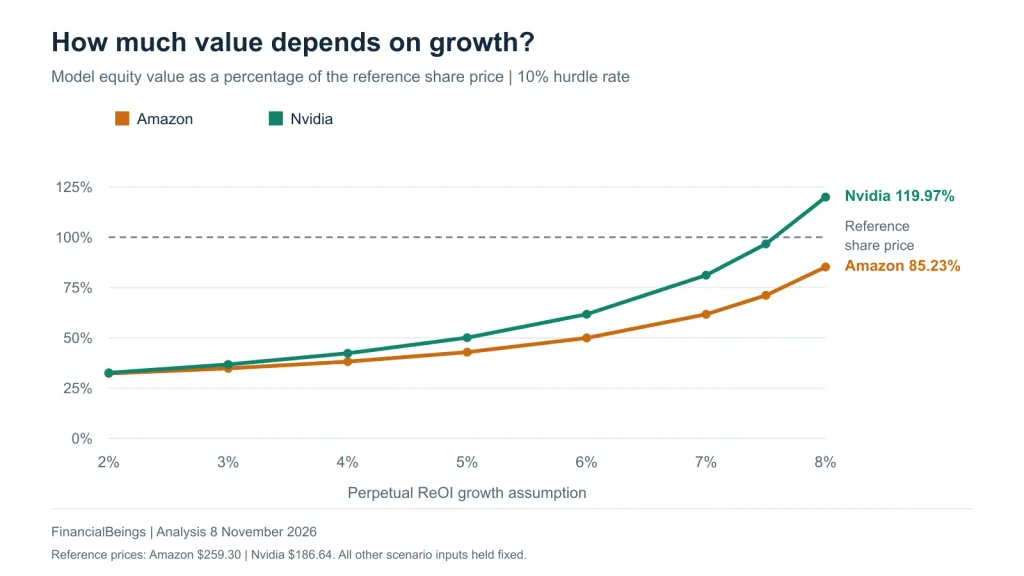
Figure 4. The 100% line represents the reference share price. Values above that line exceed the reference price under the stated scenario.
Three scenarios illustrate the decision.
At 5% growth, Amazon’s estimated value is $111.21, or approximately 43% of its reference price. Nvidia’s is $93.48, or approximately 50%.
At 7% growth, Amazon reaches $160.00, compared with Nvidia at $151.45. The dollar prices look similar, but their relationship to the market differs: approximately 62% of Amazon’s reference price versus 81% of Nvidia’s.
At 8% growth, Nvidia’s estimated value reaches $223.92, approximately 20% above its reference price. Amazon reaches $220.99, approximately 15% below its reference price.
Comparing dollar share prices alone would obscure these differences.
The table also reveals how sensitive the model becomes at higher growth rates. With a 10% hurdle rate, moving growth from 7% to 8% reduces the discount-rate-minus-growth spread from three percentage points to two.
That increases the capitalised value of residual income substantially. An 8% perpetual growth assumption therefore requires a strong economic justification.
These scenarios are conditional valuations, not probabilities or price targets expected to materialise within a specified period.
What Happens if AI Spending Slows?
An AI slowdown could affect Nvidia’s sales and Amazon’s returns on installed capacity through different channels. The sensitivity table measures the effect of lower long-term ReOI growth while holding its other inputs fixed.
For Nvidia, weaker infrastructure demand could reduce orders, change product mix or pressure margins. A slower growth path would lower value in the model. A simultaneous decline in sustainable residual income could reduce value further.
For Amazon, weaker demand could leave infrastructure generating less revenue than anticipated. The company might adjust future spending, but existing assets would still need to earn an adequate return.
This is why lower capital expenditure does not automatically resolve an investment problem. It can improve near-term cash flow while leaving questions about asset utilisation and future growth.
The numerical exposure is clear. Reducing the assumed growth rate from 8% to 6% lowers Nvidia’s estimated value from $223.92 to $115.22. Amazon’s falls from $220.99 to $129.50.
Those changes illustrate model sensitivity. They do not represent forecasts of a specific AI downturn.
A fuller stress test would vary margins, operating assets, financing and residual income together. The present comparison isolates growth so readers can see how much that single assumption matters.
For the broader investment context, our guide to AI-stock valuation and risks examines the expectations already reflected in AI-related share prices.
Amazon or Nvidia Stock: Which Fits Which Investor?
Nvidia offers the lower implied growth requirement at these reference prices. Amazon’s case depends on earning stronger returns from its expanding capital base.
An investor considering Amazon must believe that its businesses can convert investment into durable operating earnings. Improving asset utilisation, sustainable margins and cash generation would strengthen that argument.
Amazon’s business mix may be attractive to someone seeking several sources of earnings. The valuation still needs to justify the capital committed to those businesses and the growth already reflected in the share price.
An investor considering Nvidia must believe that its products can continue generating substantial economic profits as the industry expands and competition develops.
The lower implied growth rate provides a more favourable starting point in this particular model. It does not remove the risk that current profitability could normalise or that the chosen earnings base could prove too optimistic.
For both companies, the useful discipline is to state the assumptions before deciding whether the price is attractive.
At the reference prices, the numerical comparison favours Nvidia on required growth and on value relative to price across the 2%-8% scenarios. Amazon would need stronger residual income, higher sustained growth or a lower purchase price to improve its position within the same framework.
That is a conditional valuation conclusion. It does not establish a universal winner across business risk, portfolio needs and investment horizons.
Frequently Asked Questions
Is Amazon or Nvidia the Better Stock to Buy?
The model gives Nvidia the lower growth requirement: approximately 7.59% versus Amazon’s 8.34%. Nvidia also has the higher value-to-price ratio across the tested growth scenarios. An investment decision still depends on whether the underlying earnings, capital and growth assumptions are credible.
What Does Market-Implied Growth Mean?
It is the growth rate needed to reconcile the model with the reference market price. Here, it refers to perpetual residual operating income growth at a 10% required return. It should not be interpreted as a revenue forecast or an expected annual share-price return.
What Does a 10% Hurdle Rate Mean?
It is the annual return required on operating capital in this analysis. It sets the capital charge used to calculate residual operating income and the discount rate used in the valuation. It is an assumption for comparison, rather than a promised investment return.
Is Nvidia’s YTD RNOA Really 98.74%?
Yes, in the reformulated accounts. Approximately $117.537 billion of YTD operating income after tax divided by $119.035 billion of opening fiscal-year net operating assets produces 98.74%. It covers six months and is not an annualised return or a shareholder return.
Does an 8% Growth Assumption Make Nvidia Undervalued?
At that assumption, the model produces $223.92 per share against the $186.64 reference price. That result depends on the earnings base, capital classifications and continuation assumptions. It should be read as one scenario rather than a guaranteed outcome.
What Should Investors Monitor Next?
Watch sustainable operating income, margins, operating asset growth and turnover. For Amazon, the key question is whether new infrastructure earns sufficient returns. For Nvidia, it is whether strong profitability remains durable as demand, competition and capital requirements evolve.
Methodology: YTD PM, ATO and RNOA are calculated from reformulated quarterly financial statements. Sensitivity values use the completed fiscal-year operating base and a 10% hurdle rate. Enterprise value equals net operating assets plus capitalised residual operating income; net debt is then deducted to obtain equity value. The next-period ReOI proxy is held fixed across the growth scenarios.
Sources
- Amazon Q3 2026 earnings results
- Amazon Q3 2026 10-Q filing
- Amazon FY2025 annual report (10-K)
- Nvidia fiscal Q2 2027 earnings results
- Nvidia fiscal Q2 2027 10-Q filing
- Nvidia FY2026 annual report (10-K)
- AWS and Nvidia 2 million GPU expansion
- Amazon Trainium vs Nvidia GPU availability on AWS
- Amazon (AMZN) historical share prices
- Nvidia (NVDA) historical share prices
Implied growth, reformulated PM/ATO/RNOA and sensitivity valuations are original FinancialBeings calculations. The public URLs support the underlying disclosures, rather than reproducing those model outputs.