
Suppose you’ve saved money for years to invest in the stock market. Amazon is an easy choice – it’s something we all use, the company seems unstoppable, and the brand is everywhere from your doorstep to your phone.
So, you act like a careful person. You research the value of Amazon’s stock and come across a number; a number that will tell you whether the stock price of $248.20 per share is worth paying for. Rather, you discover turmoil.
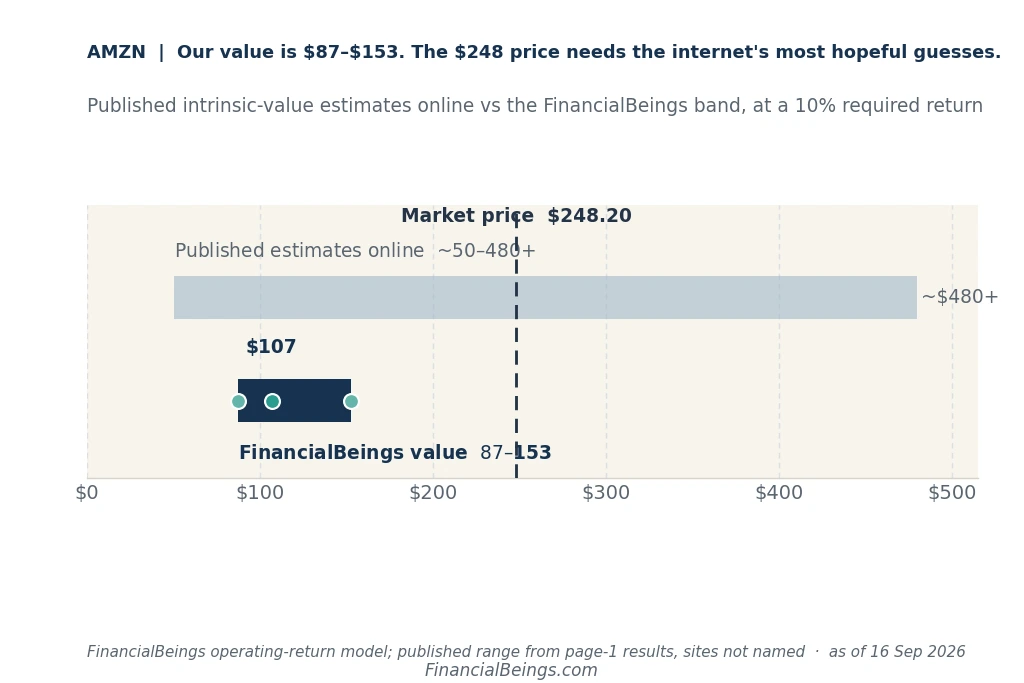
One of the calculators has a price of approximately $50 per share in Amazon. The other one states that it’s worth $480 or higher. This isn’t a little bit of an inconvenience; this is a difference between “this stock is wildly expensive” and “this stock is a steal,” from tools that are supposedly doing the same math.
That’s when the Amazon Intrinsic Value in 2026 begins. Not with one magic number, but with a garbled number that doesn’t agree and a company that is quite difficult to read these days, for two peculiar reasons. Once you understand those two things, the mess starts to make sense.
What is Amazon’s intrinsic value in 2026?
Let’s first define the term. Intrinsic value is what a business truly is worth, independent of the stock market on a particular day because of what the business earns and earns consistently. Its real worth — at least as closely as it can be estimated.
Suppose that the profits from Amazon’s primary business will expand at about 5% annually for the foreseeable future relative to what they would earn in a baseline business, then the stock should trade for roughly $107 a share. For those that are more risk averse about growth, the number is approximately $87. Alternatively, if you have a more optimistic outlook, it reaches around $153. In either case, it is far from the $248.20 it is currently trading at.
| Metric | Value |
| Share price (Sep) | $248.20 |
| Market capitalization | $2,677.0B |
| Modeled value (Balanced-Growth, 5%) | ~$107/share |
| Modeled value range (3%–7% growth) | $87 – $153/share |
| Published estimate range online | ~$50 to $480+ |
That published range: $50 to $480+ is real. It’s what you’ll find if you search today. And it’s the whole reason this topic is worth untangling.
Why do estimates range from ~$50 to $480+?
Here’s the tension: how can smart tools, built by smart people, land so far apart in the same company?
The answer comes down to what each tool feeds into its formula.
There are tools that consider the free cash flow of Amazon, which is the actual cash that’s available after the company pays its bills and makes any purchases. That figure is negative now, and approximately -$7.6 billion in the last year.
If you put a negative number into the valuation model then it will spit out a low price, around $50. However, that negative number is not a warning number. It’s an outcome of Amazon’s investments in new infrastructure, data centers, warehouses and delivery networks, which the company invested about $169 billion in spending more than it’s earning. For how this heavy spending stacks up against a traditional retail peer, see our Walmart vs Amazon stock comparison.
Other tools employ models based on future growth expectations, for which a response can fall anywhere between $93 and $480 or more, depending on how optimistic the growth expectations are. Small changes in the growth assumption give wildly different prices, here’s why you shouldn’t have just one guess as to the future.
So the story of Amazon Intrinsic Value in 2026 is really a story about two blind spots: one model that’s fooled by heavy spending, and another that’s fooled by hopeful guessing.
Why the lowest and highest numbers are both wrong
There’s a second distortion at play, and it’s a big one.
Amazon has reported net income of $62.6 billion in the quarter ended June 2026. That sounds spectacular. But just $27.5 billion of this was from the actual operating business, which includes selling things, running AWS, running ads. The remainder was an eye-catching $53.4 billion, a one-time profit from an appreciation of Amazon’s stakes in the AI firm Anthropic. That’s not income from higher packages. This is a paper profit on an investment that has increased in value.
| Reported Net Income | Operating Income | What Explains the Gap | |
| FY2025 (full year) | $77.7B | $68.74B | Reported net income ran ~$9B above operating income — non-operating investment gains the operating line excludes |
| Q2 2026 (Apr–Jun) | $62.6B | $27.5B | $53.4B Anthropic investment gain |
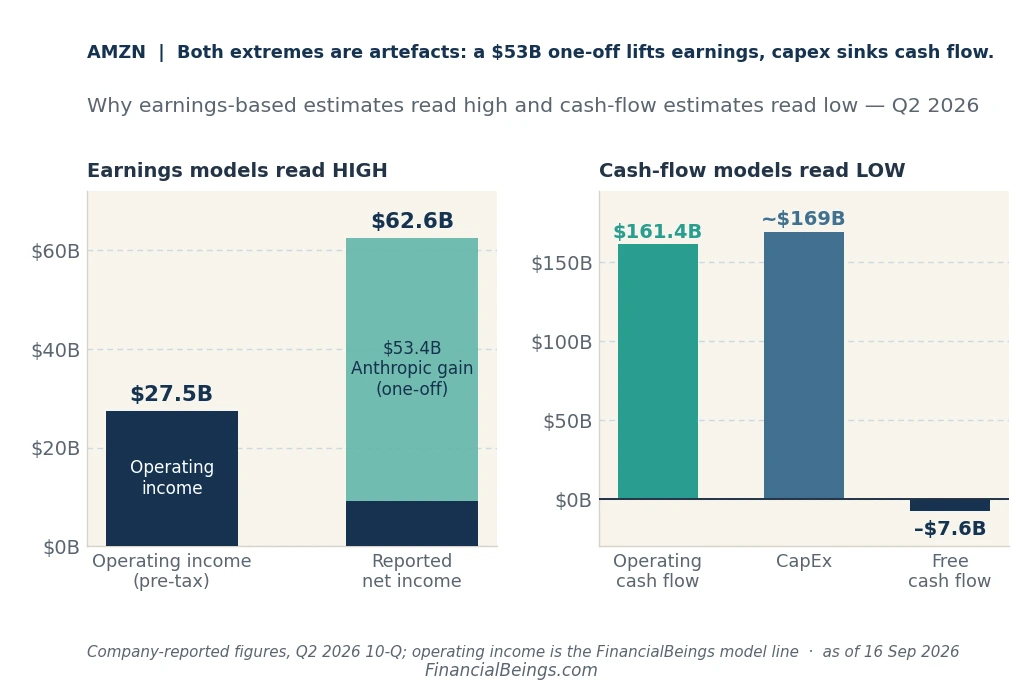
Any tool that blindly uses the “reported earnings” this year will believe that Amazon is making a ton more than it actually is, and will report a number that is way too high. In the meantime, the free cash-flow tools are discounting Amazon due to the capex increase noted. There are models that are fooled by a windfall gain. The other is duped by a big investment. The reality is in the middle and is ignored by both of those distortions, which is what an ongoing operating earnings-based model does.
What does Amazon’s operating business actually earn?
Strip away the noise, and here’s the real engine of the company.
The return on Amazon’s operating capital (which can be viewed as the money the company is using to support its warehouses, servers and delivery systems, minus the amount supplied by customers and vendors that are essentially lending to Amazon for free) was 21.1% in fiscal 2025. That is the result of two factors: The percentage of profit kept on every dollar of sales (9.81 percent); The number of dollars of sales generated by every dollar of operating capital (2.155 times). Multiply those together and that’s the return.
Why does 21.1% matter? The model is a simplified version that assumes that a company must earn 10 percent or more to be doing “a good job. All of this is bonus value to the returns it creates on top of what’s expected, what we call excess operating income, and Amazon is generating $37 billion of that excess in FY2025.
| Metric | FY2025 (Sustainable) | Most Recent Quarter |
| Profit margin | 9.81% | 11.22% |
| Capital turnover | 2.155x | 1.53x |
| Return on operating capital | 21.14% | 17.17% |
| Excess operating income | $37.05B | – |
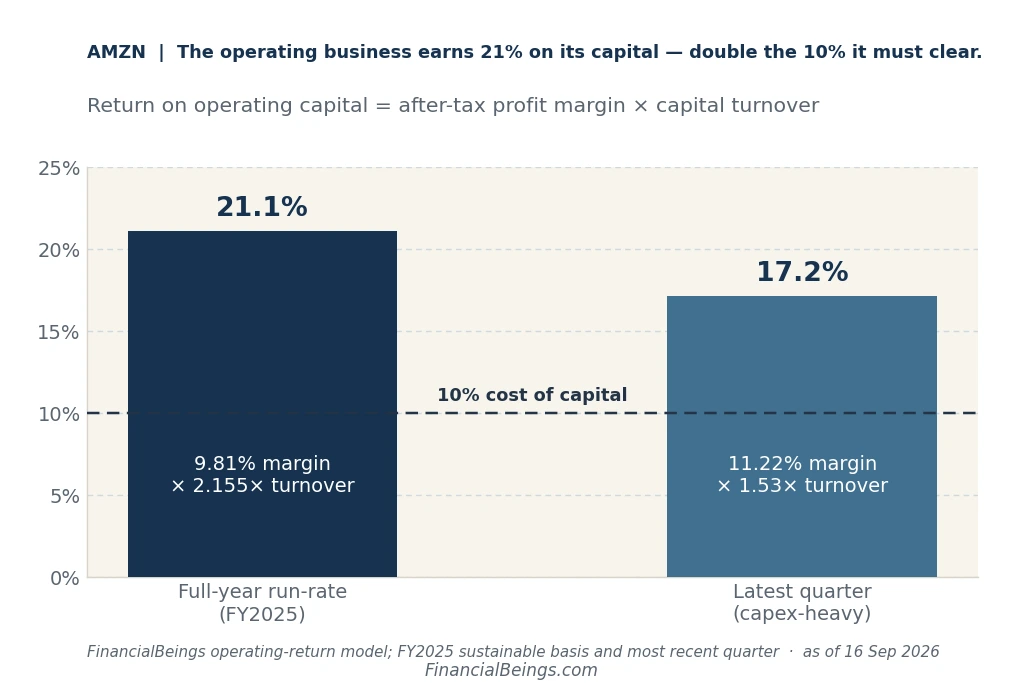
It is noticeable that the latest quarter has a lesser return of 17.17%. The capex spending again, as Amazon is investing new money more rapidly than it is generating new sales from it, bringing the ratio down temporarily. It’s like renovating a restaurant in the middle of the day, there’s a little less money coming in for a little while, but there’s a little more coming in when the new kitchen is finished.
What growth is the $248 share price assuming?
Here’s where your decision gets interesting. If Amazon is only “worth” $87 to $153 depending on growth assumptions, why is it trading at $248.20?
The market doesn’t account for reasonable growth. It’s pricing in 8.36% growth in the excess operating income, year after year and forever. That’s a tough wager. What this means, is that for every $1 that Amazon ties up in operating capital, the market is willing to pay $5.95. The stock would be worth about $72.83 a share if Amazon’s profits above the baseline simply stayed flat from here, with no growth at all. All the rest more than 70.8% of the current price depends on future growth actually materializing.
| Long-Run Growth | Value per Share | vs. Current Price ($248.20) |
| 2.0% | $81.05 | 33% |
| 3.0% (Conservative) | $87.19 | 35% |
| 4.0% | $95.37 | 38% |
| 5.0% (Balanced-Growth) | $106.82 | 43% |
| 6.0% | $123.99 | 50% |
| 7.0% (Upper) | $152.62 | 61% |
| 8.0% | $209.87 | 85% |
| 8.36% (Break-even) | $248.20 | 100% |
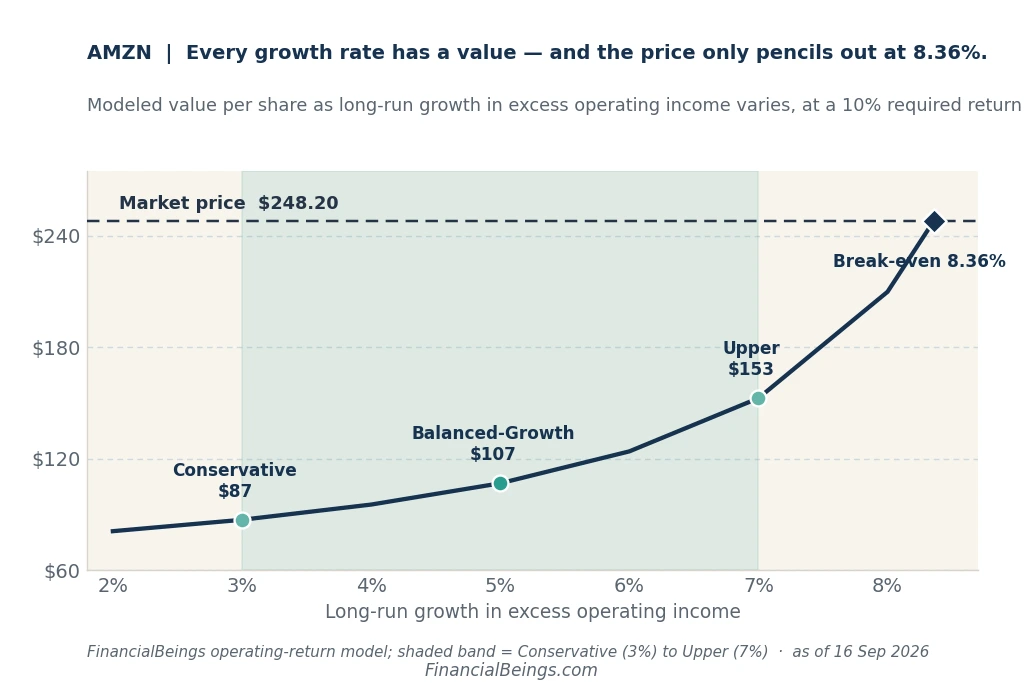
This ladder is the heart of the Amazon Intrinsic Value in 2026 discussion. It doesn’t hand you one verdict — it hands you a menu. Pick your growth assumption, and the ladder tells you what Amazon should be worth under that assumption. If you’re thinking further out, see how these same return-on-capital assumptions play out in our Amazon stock price prediction for 2050.
Is Amazon stock overvalued or undervalued right now?
It’s not a yes or no question, it’s an expectation question. Amazon is overvalued at a moderate 5% growth rate, with our value about 43% of the price. Our value reaches only 61% of the price under a most optimistic growth rate of 7%. The 8.36% the price demands is the fastest growth rate any large company has been asked to deliver in this type of analysis. For a broader buy/sell take, see our full Amazon stock review.
It is a demanding bet, but not an impossible one. It involves two specific things for it to work:
- The operating capital return should recover and probably rise to 25% or more as the current spending cycle begins to bring returns.
- This $37 billion of excess profit must be allowed to grow at nearly 8% per year, almost continuously over a long time.
The first point is a hopeful sign, as AWS margins rose to nearly 40% last quarter. See how this compares with the cloud leader in our MSFT vs Amazon AWS cloud growth analysis.) The big question is whether it will last, and no one can decide that today based on the price tag.
Frequently Asked Questions
What is Amazon’s intrinsic value in 2026?
At a moderate growth rate, about $107 per share, but at plausible rates of growth ranging from $87 to $153. Estimates range from about $50 to $480+, primarily due to the two distortions described above; the latter are the most common reason for this range.
Is Amazon stock overvalued or undervalued right now?
The price tag is $248.20, which is asking for about 8.36% long-run growth in profits compared to the baseline, the highest of any major firm analyzed in this manner. That’s a question of whether Amazon’s returns continue to rise or not.
Why is Amazon’s free cash flow negative?
Amazon made $161.4 billion of operating cash, and spent about $169 billion on the AI and delivery systems being built. There is a negative free cash flow because it’s a high investment, it’s not because of the fact that the business is shrinking.
Why do different calculators give such different answers?
They feed in different assumptions. The present fiscal frenzy is weighing on cash-flow tools. Earnings-based tools overstate earnings due to a one-time investment gain. There are many growth-based models, with a wide range of assumptions embedded in them.
Is Amazon a good long-term investment at $248?
It will depend on whether that business continues to make good returns on its invested capital, and whether their excess profits are increasing more rapidly than 8.36% annually. The key question is, does the approximately $220 billion that has been committed to be spent over the next year, return more than its investment? This contains no investment advice.
