Alphabet is spending more on capital expenditure than it is generating in operating cash flow, and Q3 2026 data reveal a business that is growing quickly. Shareholders felt the cost on the night of the report. GOOGL, the Class A share of Alphabet, Google’s parent company, traded around $292.50 in after-hours trading on 28 October 2026. That 10% decline erased some $400 billion in market value. The headline was “earnings miss.” The true question is how much it will cost to build out AI infrastructure.
Three things matter for shareholders:
1. Growth is real and particularly strong in Cloud. Alphabet’s revenue increased 25% to $127.6 billion, and revenue in Google Cloud more than doubled.
2. Cash is going the other way. Operating cash flow was $42.3 billion while capital spending was $51.4 billion, resulting in a free cash flow of −$9.1 billion. The gap is being plugged by new shares and loans.
3. The stock is still not cheap. In spite of the decline, the price implies that Alphabet’s operating profit above its cost of capital increases by approximately 7.31% per year in perpetuity on the FY2025 model basis, above our assumed 4% long-run nominal growth benchmark.
Our read: Alphabet went from very expensive to expensive, not to cheap. Margin is holding. What is broken is turnover, with less than one dollar of annualized sales now generated per $1 of modeled operating assets.
How we measure it: All valuation figures assume a 10% required return on operating capital unless otherwise indicated. Prices use the $292.50 after-hours snapshot from 28 October 2026. Scenario and sensitivity tables use FY2025 model inputs; the valuation chart and operating-return table show the separate Q3 re-anchored check.
Alphabet Q3 2026 Earnings: Did Google Beat Expectations?
Revenue narrowly missed the $127.97 billion consensus reported by MarketBeat. Reported earnings per share fell year on year, and the reasons matter more than the size of the decline.
| Q3 2026 results | Actual | Comparison |
| Revenue | $127.6B | +25% year on year |
| Operating income | $40.6B | +30% year on year; down from $40.8B in Q2 |
| Diluted EPS | $2.12 | $2.87 a year earlier |
| Google Cloud revenue | $30.7B | +103% year on year |
| Operating cash flow | $42.3B | — |
| Capital expenditure | $51.4B | Companywide capex |
| Free cash flow | −$9.1B | Second negative quarter in a row |
Sources: Alphabet Q3 2026 earnings release (pp. 1, 4, 6, 8); Alphabet Q2 2026 earnings release (p. 2); Q3 earnings call; MarketBeat revenue consensus, checked 30 October 2026.
There were two issues this quarter: investment losses and weaker sequential operating performance.
The big EPS decline is primarily investment-related. Alphabet also has investments in other companies, such as SpaceX. Alphabet recorded a net equity-securities loss of $8.66 billion this quarter, resulting in a $0.55 decline in EPS. The shortfall is a blow to shareholders, but it’s not an indication of the performance of Google’s Search, YouTube, or Cloud businesses. We exclude investment gains and losses from sustainable operating profit, but the value of those stakes still matters to common shareholders.
The operating result also needs attention. Adding back the disclosed $0.55 effect gives EPS of roughly $2.67; this limited adjustment is not a fully reconciled adjusted-EPS figure. Group operating income dipped slightly from $40.77 billion in Q2 to $40.58 billion, despite a $2.3 billion sequential increase in Cloud’s operating income. Higher Alphabet-level losses accounted for $1.87 billion of the offset, with lower Services income and larger Other Bets losses accounting for the rest.
Why Did GOOGL Stock Fall After Earnings?
What the numbers mean is straightforward: while Alphabet is still profitable, the amount of money invested in the company is growing at a much faster rate. That’s the underlying narrative behind GOOGL stock following Q3 2026 earnings and more than just a number. It’s harder to determine why individual investors were selling, but that’s what the results indicate.
The bill for capital is growing almost three times faster than profit
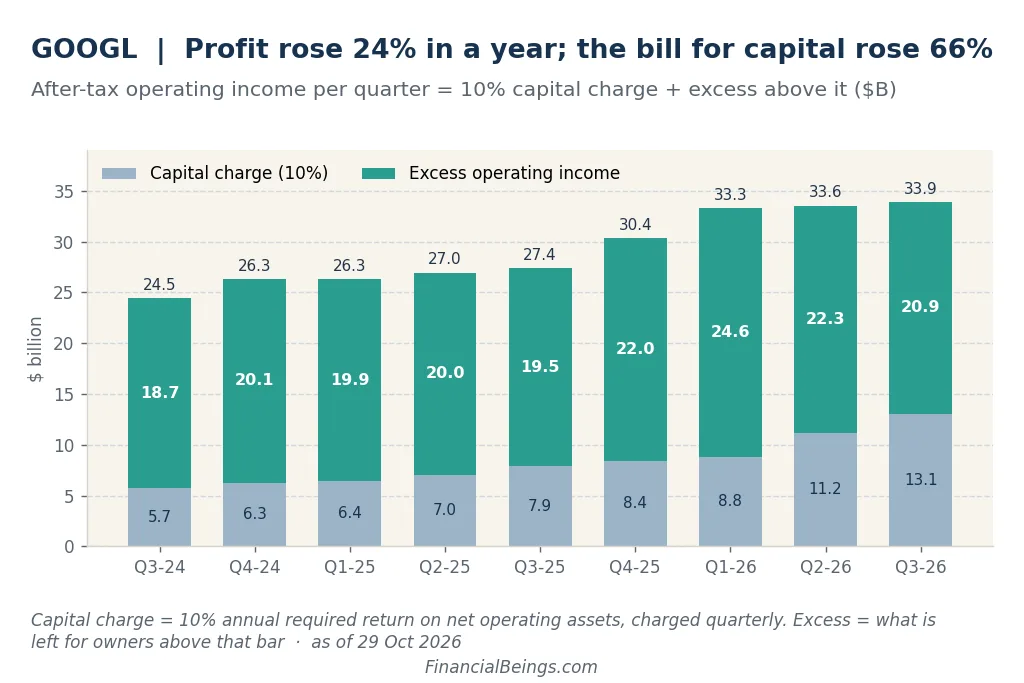
A business should earn a return above its cost of capital. The capital charge is the annual “rent” we charge on Alphabet’s operating assets at a rate of 10% per year, the required return, prorated for each quarter. If there is any sustainable after-tax operating profit left over, it is the excess that creates value for owners.
| Quarter | Sustainable after-tax operating income | Capital charge (10%) | Excess for owners |
| Q3 2025 | $27.4B | $7.9B | $19.5B |
| Q1 2026 | $33.3B | $8.8B | $24.6B |
| Q2 2026 | $33.6B | $11.2B | $22.3B |
| Q3 2026 | $33.9B | $13.1B | $20.9B |
After-tax operating income increased 24% year over year. The capital charge increased by 66%. Excess operating income has declined in two successive quarters, from $24.6 billion to $20.9 billion.
Margin held, turnover broke
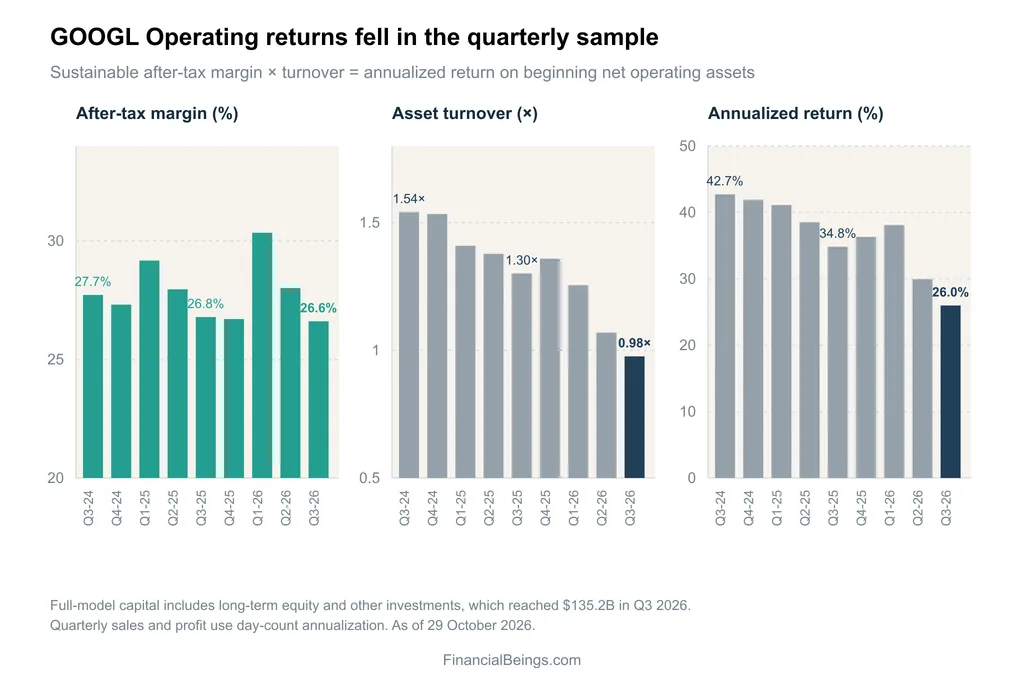
ROOC is the result of two factors. Margin is the percentage of sales retained as profit. Turnover is annualized sales divided by beginning net operating assets.
| Measure | Q3 2024 | Q3 2025 | Q3 2026 |
| After-tax margin | 27.7% | 26.8% | 26.6% |
| Asset turnover | 1.54× | 1.30× | 0.98× |
| Annualized return on beginning net operating assets | 42.7% | 34.8% | 26.0% |
ROOC declined from 34.8% to 26.0% in a year, the lowest level in the quarterly sample shown. That 8.9-point decline was due to 8.7 points being lost to turnover and just 0.2 points to margin.
Margin is steady year on year, but it is slipping during 2026, from 30.3% in Q1 to 26.6% in Q3, as R&D rose to 16.2% of sales. The key is turnover. The ratio of annualized sales to beginning operating assets is 0.98 times, below 1.0 in the quarterly sample. Sales increased 25% over the course of a year, but operating assets increased 68% during the same period. This capital base includes long-term equity and other investments, whose increase explains about 32% of the rise in net operating assets.
Profit is growing more slowly than capital, and the same squeeze shows up when you look at Meta vs Alphabet return on operating capital. Alphabet’s operating capital (excluding equity stakes) increased by approximately $154 billion over the past year, and the increase in annualized after-tax operating profit was approximately $26 billion. That’s about 17 cents of additional profit per dollar of additional capital. It is a change-based proxy, not a measured return on newly installed assets. The proxy remains above the 10% hurdle, but it does not isolate returns on AI infrastructure.
The P/E ratio flatters the stock
GOOGL’s P/E is 15.2 on reported earnings. Reported earnings include about $102 billion of after-tax items classified as unsustainable in our model. At $292.50, operating enterprise value is around 26.5 times sustainable after-tax operating profit.
Google Cloud: Can AI and TPU Growth Sustain Margins?
The brightest spot is Cloud. Revenue increased 103 percent to $30.7 billion and operating income jumped to $11.1 billion from a year-ago figure of $3.6 billion. There is no doubt that there is a demand for AI computing, and the same demand is pushing Amazon’s AWS capex against its free cash flow.
The more difficult question is how good that growth is. Not all Cloud revenue comes from repeat customer usage, and some comes from the sale of TPU systems, Google’s own AI chips. Hardware sales can have different revenue timing and cash requirements from recurring services, so investors should pay attention to this shift in management’s talk before making any assumptions about the growth rate.
Margin is the second test. Cloud is built on data centers and chips that are driving up costs throughout the company, and depreciation—the bookkeeping charge to spread the cost of the data centers and chips over their useful life—is already rising. Cloud’s operating margin was 36.2%, versus 23.7% a year earlier. The rise in Cloud’s profit this quarter coincided with a decline in group operating income. Management also expects near-term Cloud margin pressure as third-party compute capacity ramps.
Google Search and YouTube: Is Advertising Growth Holding Up?
Advertising remains an important source of funds for the build-out, and slower advertising growth has an impact. Search & other revenue growth decelerated to 12% from 17% in the previous quarter. YouTube advertising revenue rose 9% to $11.2 billion, compared with 13% growth in Q2.
Management noted the fastest year-on-year growth in Search queries in five years. That is good, but it is a usage measure, not a revenue result. More queries help shareholders when Google converts them into additional revenue and profit. Search revenue still rose 12%, although management noted lower monetization in AI Mode and identified foreign exchange as the largest factor in the growth deceleration. It’ll be interesting to see how the next two quarters shake out in terms of whether AI-powered search is monetizing at the current rate or at a reduced rate.
AI Spending and Free Cash Flow: What Changed This Quarter?
FCF = Operating Cash Flow – Capital Expenditure. It is the amount of operating cash left after capital spending that a business can use to pay off debts, repurchase shares or pay dividends. At Alphabet, it was positive in Q4 2025 and Q1 2026, then negative in Q2 and Q3.
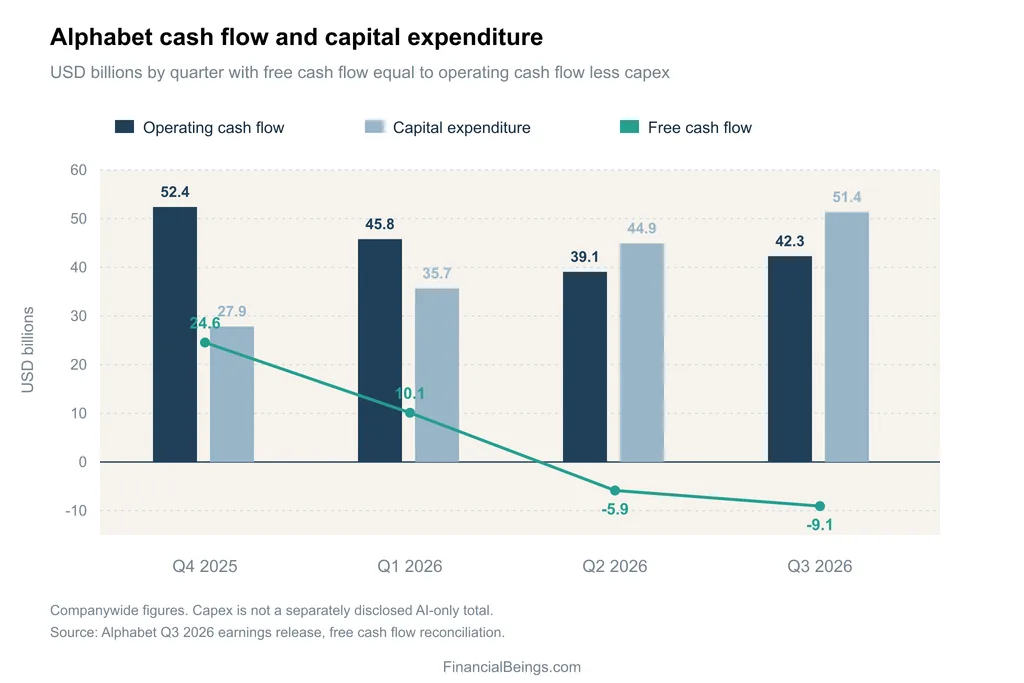
| Quarter | Operating cash flow | Capital expenditure | Free cash flow |
| Q4 2025 | $52.4B | $27.9B | $24.6B |
| Q1 2026 | $45.8B | $35.7B | $10.1B |
| Q2 2026 | $39.1B | $44.9B | −$5.9B |
| Q3 2026 | $42.3B | $51.4B | −$9.1B |
Companywide figures. Alphabet does not disclose a separate AI-only capex total. Trailing twelve-month free cash flow remained positive at $19.7 billion.
It is partly due to timing. A data centre is on the balance sheet and costs money before it makes money. Inventory building and the $5.2 billion EC-fine payment also reduced operating cash flow. However, the funding gap is already impacting how Alphabet supports itself.
Net cash, refilled by shareholders and lenders
Net cash rose to $101.3 billion ($8.28 a share) from $59.8 billion at year-end. Operating cash flow remained positive, but external financing also supported the balance sheet. Alphabet raised cash with new stock and bonds, and it is not alone, as Oracle and Microsoft are also funding their AI build-outs with outside cash and debt.
| 2026 to date | Amount |
| New common stock issued | $42.9B |
| Mandatory convertible preferred issued | $19.1B |
| New debt issued | $85.2B |
| Share buybacks | $0 |
Long-term debt went up from $46.5 billion to $125.1 billion. In addition, the $265.1 billion cash-and-marketable-securities portfolio holds $90.4 billion of marketable equity stakes. Excluding those equities while retaining all modeled financing obligations leaves a liquidity cushion of about $10.9 billion. This does not imply that the investments are worthless.
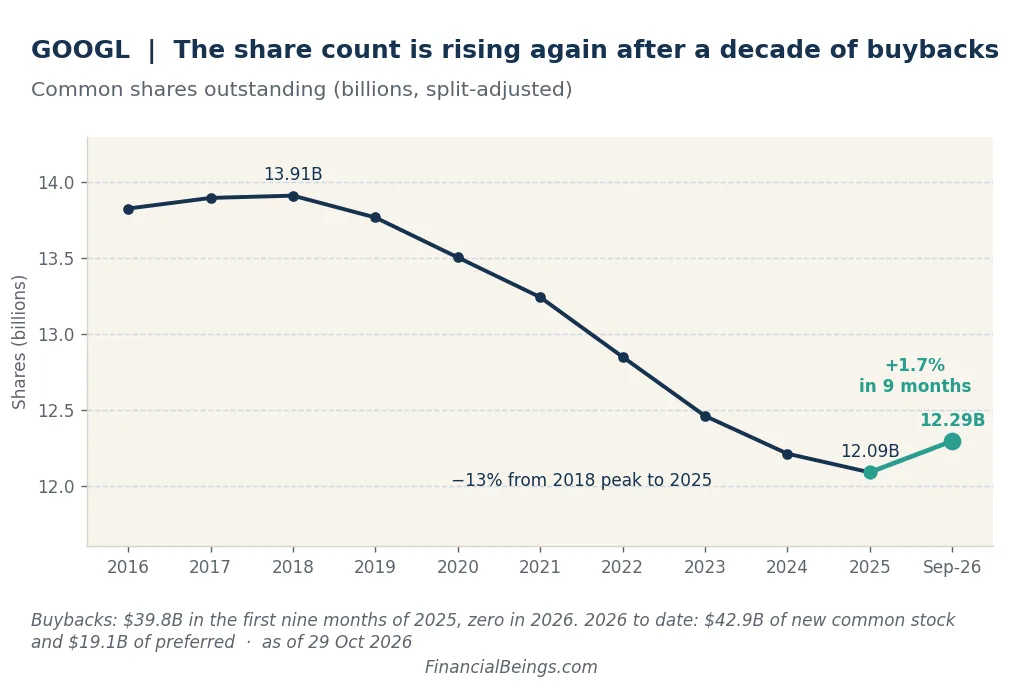
The number of shares is increasing once again after 10 years of buybacks that reduced the share count 13% from its 2018 high. Shares outstanding rose 1.7% from year-end 2025 to 12.29 billion, as Alphabet issued stock and made no repurchases in the first nine months of 2026. It had repurchased $39.8 billion in the first nine months of 2025. The existing shareholders now hold a smaller percentage of ownership in the company.
This cash faces heavy future capex demands. Management’s 2026 capex guidance remains unchanged at $195-$205 billion, with a big jump expected in 2027. The modeled net-cash balance is equivalent to 2.8% of the share price. It’s not the money itself that drives value; it’s what the money buys.
Is GOOGL Stock a Buy After Q3 2026 Earnings?
We only answer it on a conditional basis. It depends on the long-term growth of the excess operating income you think Alphabet will achieve. The following analysis is based on the dated after-hours price of $292.50 and the Financial Beings valuation workbook from 29 October 2026. The model uses the workbook’s 12.2299 billion share input. See our Google intrinsic value analysis for the complete approach.
What the price expects
Following the cut, the price is predicated on excess operating income rising 7.31% per year in perpetuity on the FY2025 model basis. That’s roughly 1.8 times our assumed 4% long-run nominal growth benchmark. The separate Q3 re-anchored check implies 7.42%, as shown in the chart.
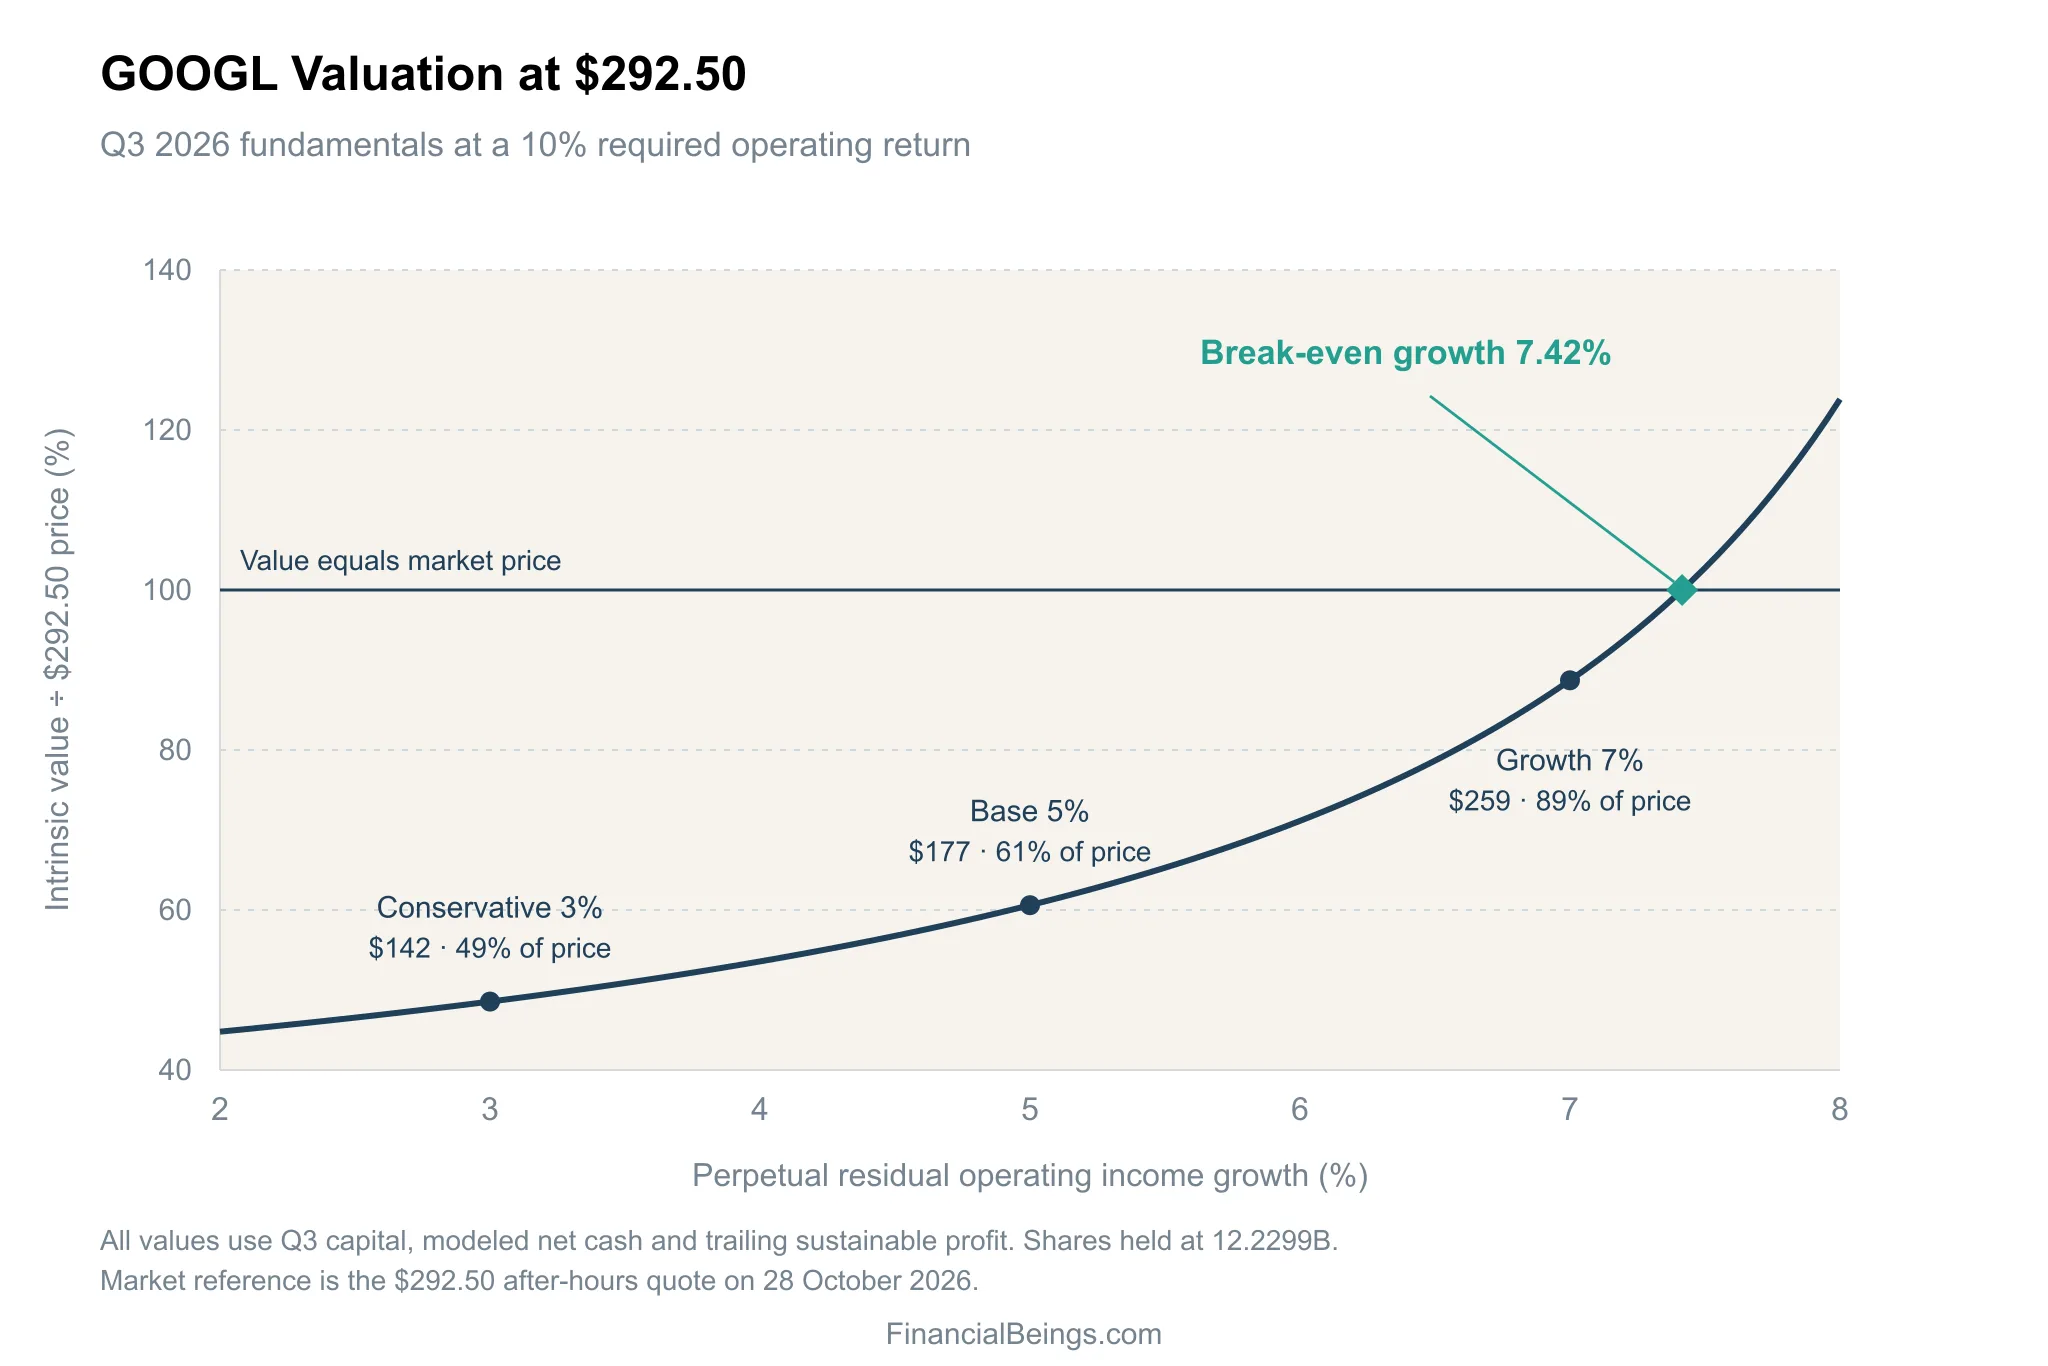
| Implied growth (10% required return) | At $292.50 |
| Market-implied growth, FY2025 base | 7.31% |
| Re-anchored on Q3 2026 capital and cash | 7.42% |
| Rank in own monthly history since 2019 | 66th percentile |
What a buyer earns from here
| Model-implied operating return | At $292.50 |
| Operating capital / operating enterprise value | 16.1% |
| Sustainable operating-profit yield | 3.78% |
| If long-run growth is 4% | 7.13% |
| If long-run growth is 6% | 8.81% |
| If long-run growth is 8% | 10.49% |
| Growth needed for a 10% return | 7.42% |
On the Q3 re-anchored basis, approximately 60.5 cents on each dollar invested in GOOGL depends on growth beyond the model’s no-growth value. With assumed perpetual residual-income growth of 4%, the model-implied operating return is approximately 7.13% a year, below the 10% hurdle. This is not a forecast of realized shareholder returns.
Conservative, Base and Growth scenarios
| Scenario | Long-run growth | Value per share | Value ÷ $292.50 price |
| Conservative | 3% | $133.38 | 45.6% |
| Base | 5% | $173.14 | 59.2% |
| Growth | 7% | $265.94 | 90.9% |
| Break-even | 7.31% | $292.50 | 100% |
The Growth case is still some 9% lower, and the Base case is 41% lower. To show how valuation changes with the required return, here is the value per share for a variety of required returns, using the FY2025 model inputs:
| Long-run growth | 8% | 9% | 10% | 11% | 12% |
| 3% (Conservative) | $181.64 | $153.49 | $133.38 | $118.29 | $106.56 |
| 5% (Base) | $280.10 | $213.25 | $173.14 | $146.40 | $127.30 |
| 7% (Growth) | — | $392.55 | $265.94 | $202.63 | $164.64 |
| Implied growth at $292.50 | 5.14% | 6.23% | 7.31% | 8.39% | 9.47% |
Blank cells follow the model’s guard where growth is within one percentage point of the required return or reaches it. Per-share values do not change with the share price when operating assumptions are held fixed.
Implied growth remains above our 4% benchmark at each displayed hurdle, but fair value is sensitive to the required return.
The case against, then the case for
- Capital is outpacing profit: turnover is less than 1x, returns are at their lowest level in the quarterly sample, and excess operating income has been declining over the last two quarters.
- Group operating income declined from the Q2 levels, and the growth in Search & other was dampened to 12%.
- Outside money is supporting the business as quarterly free cash flow is negative and buybacks have stopped. The number of shares increased 1.7% from year-end 2025.
- Even with the drop, the price implies perpetual residual-income growth above our assumed 4% long-run benchmark.
The strengths are very real, but take time to manifest in returns:
- Revenue is up 25%, Cloud is up 103%, and Cloud’s operating income more than tripled – demand is real.
- The growth of Search queries was the highest in 5 years.
- Margin was broadly stable year on year despite increased R&D and depreciation.
- Data centers are on the balance sheet before generating revenue, so some of the turnover decline is timing; the change-based profit-to-capital proxy remains above the 10% hurdle.
What would change our view?
In the separate Q3 re-anchored check at 5% long-term growth, sustainable operating profit would need to equal roughly 36.1% of Q3 closing operating capital to justify the price. That compares with 23.5% for current trailing sustainable profit on the same capital base. Better turnover and/or margins would help close that gap. Four numbers will be monitored at the Q4 2026 report:
- Asset turnover back to 1.0× or better
- Excess operating income returns to >$22 billion every quarter.
- The 2027 capex figure
- The pricing on the shares or bonds being issued
The Growth case would be better if there is a recovery in turnover and a decrease in capex growth. The greater the decline in turnover and the continuing issuance, the larger the difference compared to the Base case.
Bottom Line
The quarter wasn’t the end of the business; it was the cost of the AI build-out. GOOGL Stock After Q3 2026 Earnings shows that growth and value are no longer in unison. At $292.50, the market implies 7.31% perpetual growth in residual operating income on the FY2025 model basis and 7.42% in the Q3 re-anchored check. Trailing sustainable operating profit is 23.5% of Q3 closing operating capital; the annualized quarterly return on beginning capital is 26.0%.
The Growth case is still underwater at a 10% required return (9% below the price), while the Base case is still underwater at a 10% required return (41% below the price). To get more in-depth information about the two tech giants, look at Apple vs. Google stock.
View sources
- Alphabet Q3 2026 earnings release (SEC), released 28 October 2026
- Official earnings release PDF: revenue and EPS on page 1, segment results on page 2, cash flow on page 6, investment losses and free-cash-flow reconciliation on page 8
- Official Q3 2026 earnings slides