
Oracle’s sales grew 29.6% in its latest quarter, ending on 31 August 2026. Microsoft’s revenue increased by 17.7% in its recent quarter, ending on June 30th, 2026. On P/E, Oracle is more affordable as well.
However, the market reduced Oracle’s price by half. From 21 October 2025 to 21 October 2026, Oracle’s shares fell 52.3%, from $275.15 to $131.14. Microsoft’s rose 2.7%, from $517.66 to $531.87.
Is the fast grower on sale, or is the low price a warning?
Microsoft even grew slightly faster over the whole fiscal year 2026 (July 2025–June 2026 for Microsoft, June 2025–May 2026 for Oracle), with a 17.8% sales increase compared to 17.4% for Oracle.
To be sure, this Oracle vs Microsoft Stock look won’t tell you what to do. It reveals what each price tacitly implies and what would have to be true.
The Short Answer of Oracle vs Microsoft Stock
Oracle appears cheaper on profits, but not nearly as cheap once you add its debt. The two share prices assume about the same long-run growth rate, around 7.3% per year. The key is what each company earns on its investment. Oracle’s return is roughly half that of Microsoft’s, and it carries far more debt.
| As of 21 Oct 2026 | Microsoft | Oracle |
| Share price | $531.87 | $131.14 |
| Market value | $3,949B | $398B |
| Net debt as % of market value, FY2026 year-end | 1.3% | 35.3% |
| P/E, last four quarters | 29.5x | 21.0x |
| Return on operating capital, FY2026 | 29.8% | 14.7% |
| Long-run growth the price assumes | 7.40% | 7.24% |
| Price change, 12 months | +2.7% | −52.3% |
Last four quarters: July 2025–June 2026 for Microsoft; September 2025–August 2026 for Oracle.
Microsoft is worth about 9.9 times Oracle.
Is Oracle Really the Cheaper Stock?
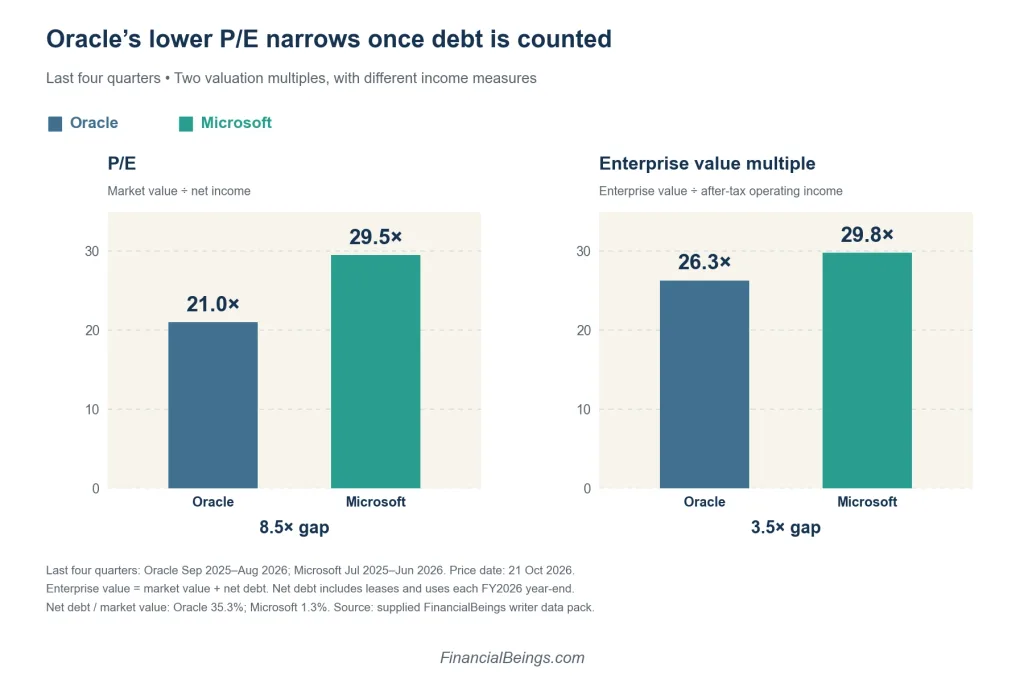
The P/E ratio is a company’s market value divided by its yearly profit. It is the number of dollars you spend for every $1 the company makes.
On that basis, Oracle costs 21 times its profit. Microsoft costs 29.5 times. Case closed?
Not quite. Imagine you had two bakeries making the same bread and cakes, and both were for sale at the same price. One is debt-free. The other has a large bank loan that the new owner will have to cover. Part of its price is hidden in the loan.
Net debt is the total amount of borrowing (including leases) minus the cash that a company has. Enterprise value is market value plus net debt, the price of the whole business.
| Last four quarters | Microsoft | Oracle | Gap |
| P/E (market value ÷ net income) | 29.5x | 21.0x | 8.5 turns |
| P/E on enterprise value (÷ operating income after tax) | 29.8x | 26.3x | 3.5 turns |
Count Oracle’s debt and most of the P/E gap disappears. Oracle’s figure jumps from 21.0x to 26.3x. Microsoft barely moves, because it has almost no net debt. Another enterprise tech company with heavy debt is IBM, which we cover in Is IBM a good stock.
What Each Company Earns on Its Capital
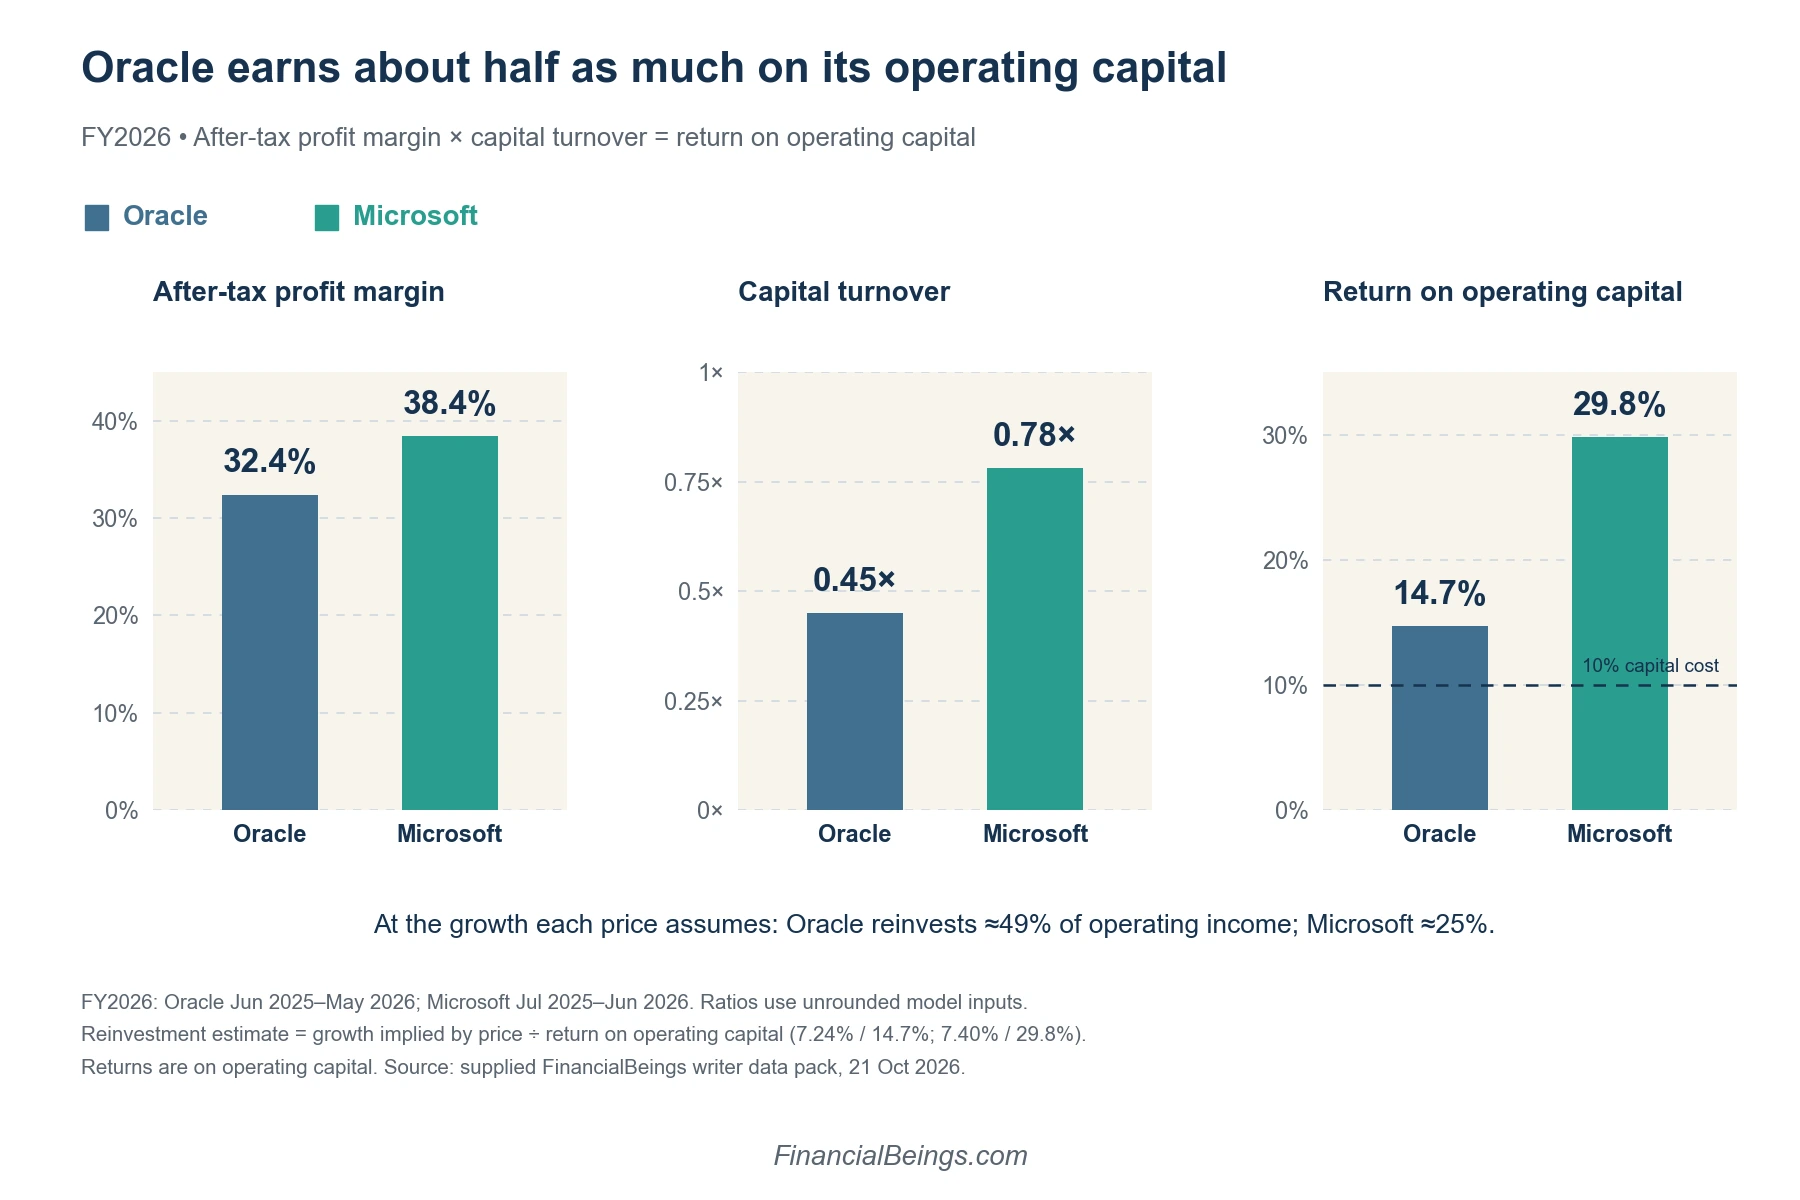
Operating capital is the capital invested in the business: data centres, servers, and equipment. Return on operating capital is the amount of after-tax profit generated by the operating assets in a given year, expressed as a percentage of the operating assets.
It’s two things multiplied: the profit margin (how much of each sale is kept as profit) and turnover (sales brought in per dollar of capital).
| FY2026 | Microsoft | Oracle |
| Profit margin (operating income after tax ÷ sales) | 38.4% | 32.4% |
| Turnover (sales ÷ average operating capital) | 0.78x | 0.45x |
| Return on operating capital | 29.8% | 14.7% |
Think of two lemonade stands. Each has a profit share of approximately one-third of each sale. One makes 78 cents of lemonade sales a year for every $1 the stand cost. The other makes $0.45.
Microsoft earns about 30 cents a year per dollar of operating capital; Oracle, about 15. Margins are close. Turnover is not, and it accounts for three-quarters of that deficit.
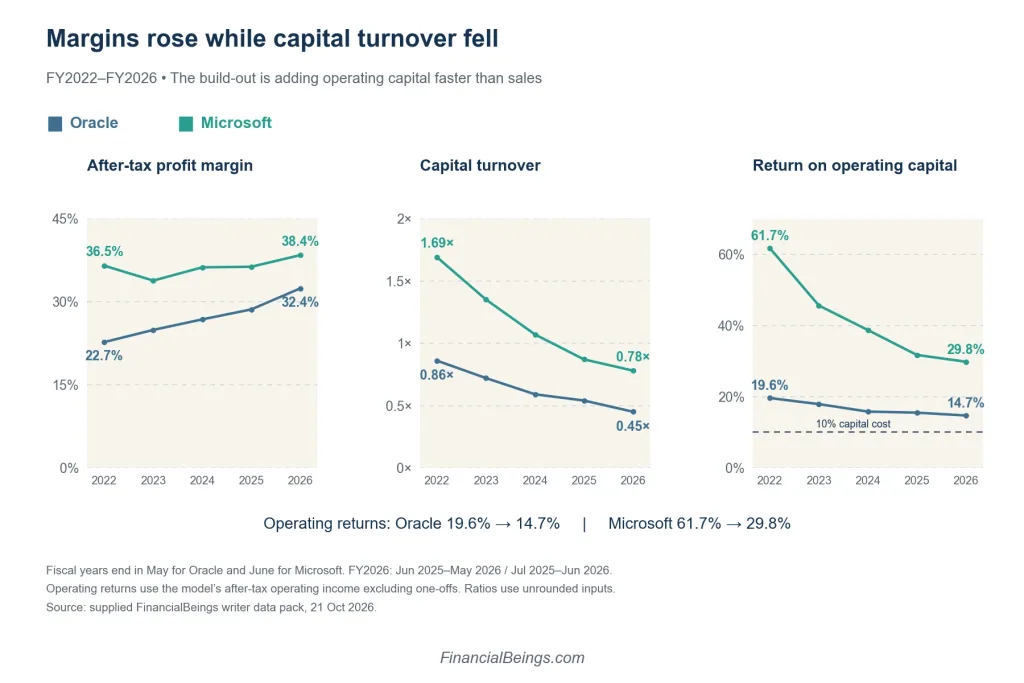
They’ve both been sliding. Since FY2022, Microsoft’s return fell from 61.7% to 29.8%, and Oracle’s from 19.6% to 14.7%. Turnover was reduced by about 50% at both, while margins increased. The AI build-out is landing on the balance sheet before it lands in sales.
What Growth Each Price Is Assuming
The required return is the minimum yearly return an investor demands. We use 10% for both companies.
Operating income left after a 10% charge for the capital it uses is called excess operating income.
It is at this point that the Oracle vs Microsoft Stock story gets interesting. Oracle’s price is based on this over-earning rising 7.24% annually for the long term. Microsoft’s assumes 7.40%. They are both approximately 1.8 times the long-run growth rate of the economy, which is around 4%.
The model shows that Oracle is worth $45.47 a share and Microsoft $182.34 with no growth at all. This equates to approximately 35% of each price. The remaining 65% is paying for growth. For a deeper look at what Microsoft’s price implies through 2030, see our Microsoft expected return analysis.
Growth comes at a cost, however. Oracle must reinvest about half its operating income to grow by 7.24% annually. Microsoft needs about a quarter. The same growth costs Oracle twice as much.
| Long-run growth | Microsoft value per share | % of price | Oracle value per share | % of price |
| 2% | $213.02 | 40.1% | $53.52 | 40.8% |
| 3% (Conservative case) | $234.94 | 44.2% | $59.37 | 45.3% |
| 4% | $264.17 | 49.7% | $67.17 | 51.2% |
| 5% (Base case) | $305.09 | 57.4% | $78.09 | 59.6% |
| 6% | $366.46 | 68.9% | $94.47 | 72.0% |
| 7% (Growth case) | $468.76 | 88.1% | $121.77 | 92.9% |
| 7.5% | $550.59 | 103.5% | $143.61 | 109.5% |
| 8% | $673.35 | 126.6% | $176.37 | 134.5% |
| Growth the price assumes | 7.40% | 100% | 7.24% | 100% |
Valuation is based on the latest full fiscal year of each company, ending 30 June 2026 for Microsoft and 31 May 2026 for Oracle (debt levels and operating capital at year-end), and share prices on 21 October 2026. Oracle’s share count includes the shares it issued between June and August of 2026, but the cash received from those sales isn’t reflected in its May 2026 balance sheet yet, meaning its per-share figures are conservative. A 10% required return is used for all figures.
Read each row as a condition, not a prediction. With 5% growth in excess operating income over the long run, the model puts Oracle’s value at $78.09, roughly 60% of the current share price.
Why Oracle’s Stock Swings So Hard
Oracle earns 4.7 points above its 10% cost of capital. Microsoft earns 19.8 points above it.
A lasting 1-point change in return on operating capital translates to a change in Oracle’s value of approximately 16% of its share price. It’s about 5% for Microsoft.
Oracle’s operating capital per share is $58.91, or 45% of its price. Microsoft’s is $66.58, just 13% of its price. On top of that, Oracle’s net debt equals 35% of its market value, meaning that every change in business value lands on a smaller slice of equity.
So, “fast profit growth at a low P/E” is only half of the equation. A P/E does not account for the debt and the capital that growth needs.
Why Did Oracle Stock Fall Over 50% While Microsoft Hit a Record?
| Date | Oracle price | Growth assumed | Microsoft price | Growth assumed |
| 21 Oct 2025 | $275.15 | 9.07% | $517.66 | 7.90% |
| 21 Jan 2026 | $173.88 | 8.51% | $444.11 | 7.50% |
| 21 Jun 2026 | $184.29 | 8.09% | $379.40 | 7.02% |
| 21 Jul 2026 | $127.05 | 7.13% | $397.75 | 6.37% |
| 21 Oct 2026 | $131.14 | 7.24% | $531.87 | 7.40% |
Monthly snapshots, not daily highs or lows.
Oracle’s drop took almost two points off its assumed growth, pushing it from 9.07% to 7.24%. A year ago, the market was hoping for much more from Oracle. Now it hopes for about what it hopes from Microsoft.
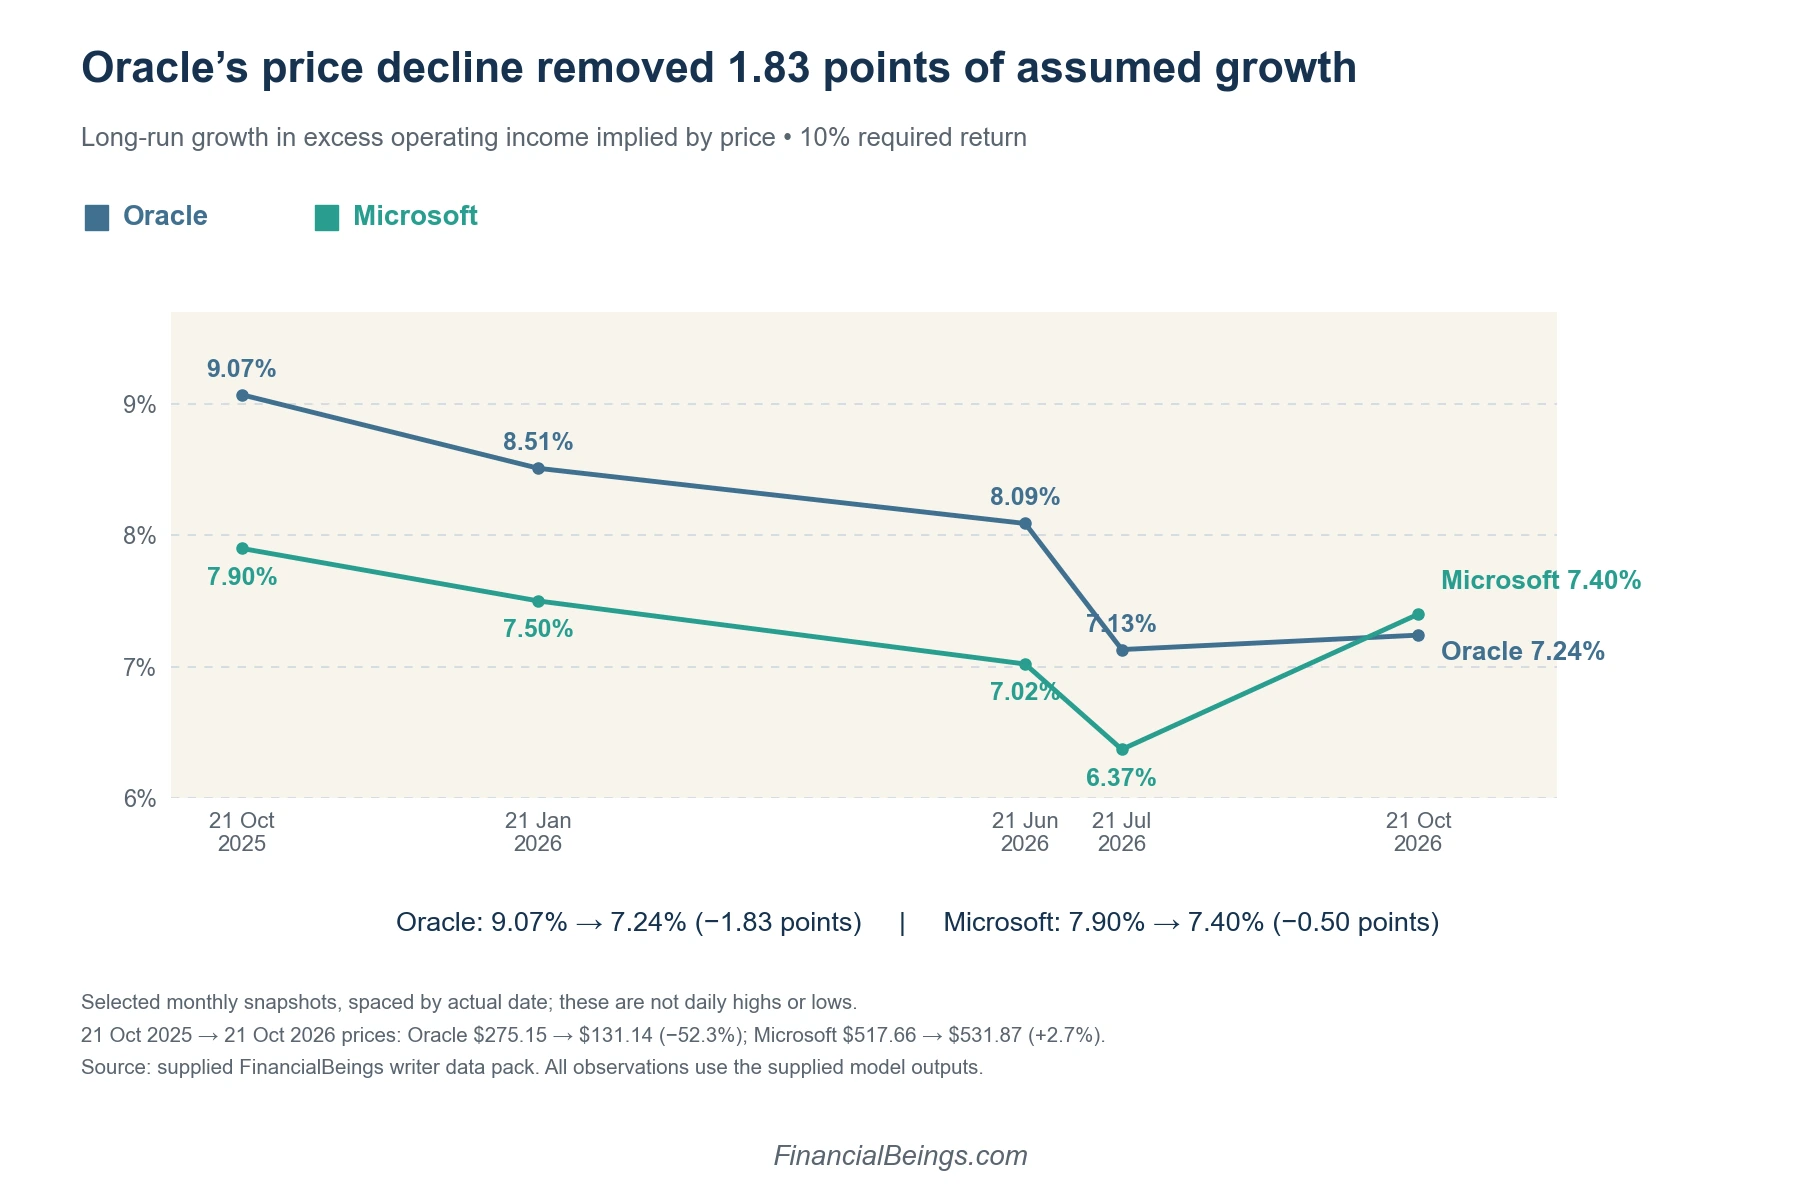
Microsoft also saw an increase of 40.2% from its lowest monthly snapshot, $379.40 on 21 June 2026.
Who Pays for the AI Build-Out, and Is the Dividend Covered?
Both are pouring money into data centers. Where does it come from?
| FY2026 | Microsoft | Oracle |
| Cash from operations | $182.9B | $32.0B |
| Capital spending | $115.9B | $55.7B |
| Left over | +$67.0B | −$23.7B |
| Operating capital growth | +37% | +50% |
| Net debt, prior year → year-end | $17.6B → $52.0B | $97.7B → $140.5B |
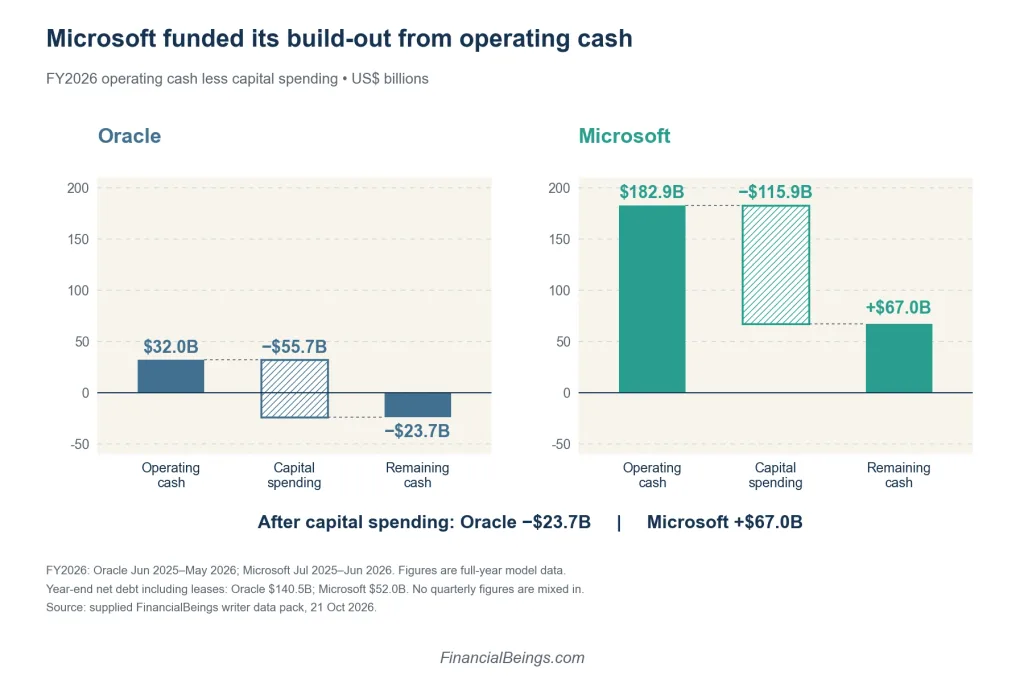
Microsoft used its own funds and had $67.0 billion remaining. Oracle spent $23.7 billion more on capital than its operations brought in. Microsoft’s cloud spending is also covered in our Microsoft vs Amazon AWS cloud growth comparison. However, in June–August 2026, it issued new shares worth approximately $19.9 billion, according to its Q1 FY2027 report.
For an owner, it’s the difference between growing a bakery from savings and on a loan. This is the question behind most AI spending today, and we look at it across the big names to see whether AI stocks are a good investment in 2026.
Dividend Check: Oracle vs Microsoft
Oracle pays $0.50 a share each quarter, a rate it declared again on 10 September 2026: $2.00 a year, or a 1.5% yield at $131.14. Microsoft raised its quarterly dividend to $0.98 on 15 September 2026: $3.92 a year, or a 0.74% yield at $531.87.
| Dividend | Microsoft | Oracle |
| Quarterly dividend per share | $0.98 | $0.50 |
| Yearly rate | $3.92 | $2.00 |
| Yield at 21 Oct 2026 price | 0.74% | 1.5% |
| Yearly cost at current rate | About $29.1B | About $6.0B |
| FY2026 cash left after capital spending | +$67.0B | −$23.7B |
| Covered by that cash? | Yes, 2.3 times | No |
At those rates, Microsoft’s dividend costs about $29.1 billion a year, and the $67.0 billion it had left after capital spending in FY2026 covers it 2.3 times. Oracle’s costs about $6.0 billion a year, plus about $0.3 billion on its preferred stock. With −$23.7 billion left after capital spending, Oracle’s dividend is not covered by free cash flow; in effect, borrowing and new shares are paying for it.
How Much of Each Backlog Rides on OpenAI?
A backlog is revenue a company has under contract but has not yet delivered. Oracle’s is big, and much of it is bound up in one customer, OpenAI.
There’s plenty of work in the backlog waiting to be done. However, if much of it depends on one customer, that customer’s health also becomes a part of the narrative.
ORCL vs MSFT: Latest Quarters Side by Side
| Latest quarter | Microsoft, Apr–Jun 2026 | Oracle, Jun–Aug 2026 |
| Sales | $90.0B | $19.3B |
| Sales growth vs a year earlier | 17.7% | 29.6% |
| Operating capital growth vs a year earlier | 36.9% | 60.8% |
| Return on operating capital, last four quarters | 29.8% | 14.6% |
Oracle’s sales are growing faster. Its capital is growing faster still.
What Could Go Right or Wrong
Growth Case and Conservative Case
| Growth case | Conservative case | |
| Oracle | Return climbs from about 15% to 20%: today’s price needs only about 5.0% growth | Return stays near 15%, growth settles at 3%: $59.37, or 45% of price |
| Microsoft | Return stays near 30%, growth runs at 7.5%: $550.59, or 104% of price | Return slides to 20%: today’s price needs about 8.6% growth |
What would make a difference? For Oracle, sales catching up with its new data centres, which would lift turnover. For Microsoft, turnover that stops falling as the spending lands.
The Bottom Line
Take the news away, and Oracle vs Microsoft stock reduces to three numbers.
The figures of Oracle and Microsoft show that Oracle’s operating income is 14.7% of its operating capital and Microsoft’s is 29.8%. Oracle’s net debt is equal to 35% of its market value, while Microsoft’s net debt is approximately 1%. But the market is demanding virtually the same growth: 7.24% and 7.40%.
You don’t need a verdict. You need to see what each price assumes. Oracle’s price asks for fast growth from a borrowed, heavy build-out. Microsoft’s asks for just a bit more growth, paid for from its own cash. If you want to look at Microsoft on its own, see our breakdown of whether Microsoft stock is a buy.
Frequently Asked Questions
Is Microsoft bigger than Oracle?
Yes. As of 21st October 2026, the market capitalization of Microsoft stands at $3,949 billion, whereas Oracle’s is $398 billion, representing a ratio of nearly 10:1. Microsoft’s sales of $90.0 billion in the latest reported quarters (April–June and June–August 2026) were about 4.7 times Oracle’s $19.3 billion.
Is Oracle stock cheap right now?
On P/E, yes: 21 times earnings vs. Microsoft’s 29.5. Count its debt and the gap narrows to 26.3 versus 29.8. Oracle’s price still assumes 7.24% long-run growth, less than Microsoft’s 7.40% growth, but on half the return on capital.
Why is Oracle stock down so much over the past year?
It wasn’t due to the fact that sales dropped; they increased 29.6% in the latest quarter. In FY2026, Oracle’s capital expenditure exceeded its operating cash flow by $23.7 billion, net debt increased to $140.5 billion, and return on operating capital dropped to 14.7%.
How exposed are Oracle and Microsoft to OpenAI?
Both are exposed in reality. A substantial proportion of Oracle’s backlog is reported to be from OpenAI, and Microsoft is reportedly a significant investor and partner of OpenAI. For accurate, up-to-date numbers, refer to the most recent filing by each company.
Did Warren Buffett ever own Oracle stock?
Yes, briefly. In July–September 2018, Berkshire Hathaway acquired approximately 41.4 million Oracle shares, valued at approximately $2.1 billion at 30 September 2018. It exited the whole stake in October–December 2018, as its next quarterly filing showed on 14 February 2019.
Sources
Company filings and announcements
-
Oracle Q1 FY2027 earnings release tables (8-K Exhibit 99.1)
About $19.9B of new shares issued in Jun–Aug 2026
View Source -
Oracle Form 8-K, 10 Sep 2026
$0.50 quarterly common dividend and $1,625 preferred dividend
View Source -
Oracle Form 10-Q, quarter ended 31 Aug 2026
3,023,736,000 common shares at 7 Sep 2026
View Source -
Oracle Form 10-Q, quarter ended 28 Feb 2026
Mandatory convertible preferred terms (50,000 shares, $100,000 each)
View Source -
Microsoft press release, 15 Sep 2026
Quarterly dividend raised to $0.98
View Source
News coverage
-
Fortune, 14 Feb 2019
Berkshire Hathaway exits its Oracle stake
View Source -
CNBC, 14 Feb 2019
Berkshire Hathaway exits its Oracle stake
View Source