
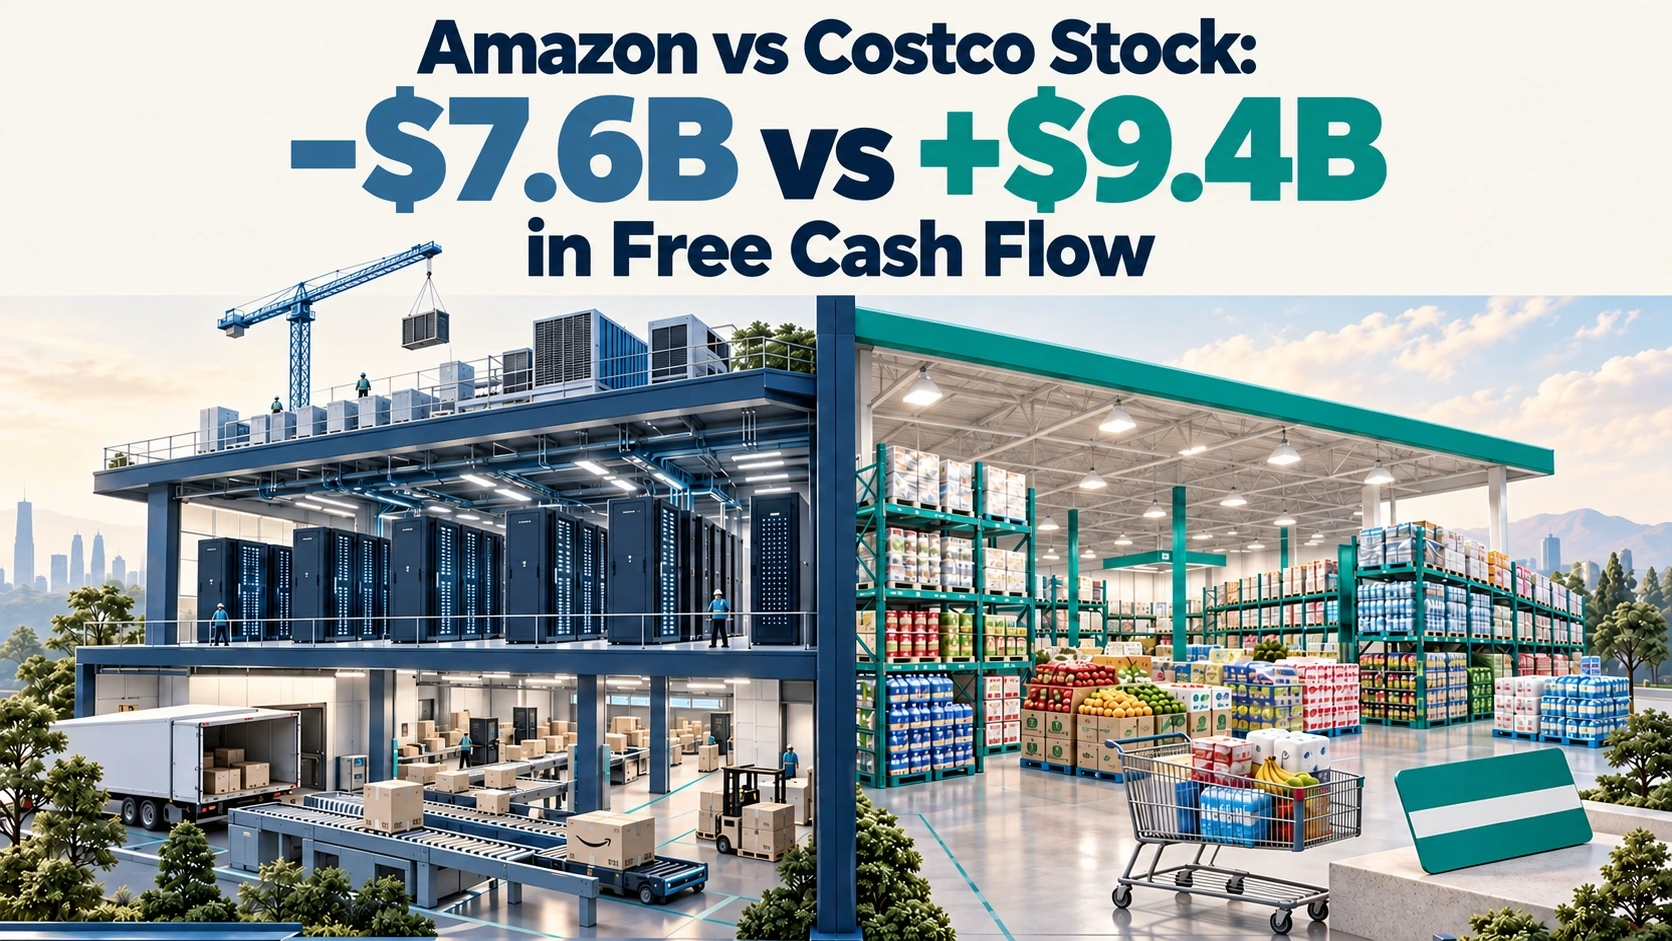
Amazon looks far cheaper on reported earnings (21x vs 46x), but much of that gap is one-off gains on its Anthropic investment. On analysts’ expected after-tax operating profit for the next fiscal year, it is about 32x vs 44x. At an 8% required return, both prices assume roughly 6% a year growth in profit above that return. Costco earns about 38% on its operating assets; Amazon about 19% while spending heavily on AI. Prices as of 9 Oct 2026; educational, not advice.
Figures cover the latest 12 months (Amazon to 30 June 2026, Costco to 30 August 2026), except the forward multiple, which uses analysts’ forecasts for Amazon’s 2026 and Costco’s fiscal 2027.
Required return means the minimum annual return an investor expects for the risk. Operating assets are the money tied up in running the business. After-tax operating profit measures business earnings after tax, excluding financing and investment gains. To see how these measures fit together, read how FinancialBeings values a stock

Cloud infrastructure and membership retail create different operating economics.
Amazon vs Costco stock at a glance: how has 2026 gone?
Amazon (AMZN) led Costco (COST) on share-price performance from 31 December 2025 to 9 October 2026, although Costco earned more on the money tied up in its operations.
Side-by-side comparison
| Metric | Amazon | Costco |
| Share price (9 Oct 2026 close) | $262.43 | $946.92 |
| Market value | about $2.83T | about $419B |
| Period | 12 months to 30 Jun 2026 | 12 months to 30 Aug 2026 (fiscal 2026) |
| Revenue | $775.7B (12 months) | $303.2B |
| Revenue growth (12 months) | +15.8% (Q2 alone +20%) | +10.1% |
| Earnings per share | $12.44 (12 months) | $20.76 |
| P/E (reported) | 21.1x | 45.6x |
| After-tax operating profit | $75.4B | $9.0B |
| Value ÷ expected after-tax operating profit (forward, consensus) | 32.1x (FY2026) | 43.9x (FY2027) |
| Return on operating assets | 19.2% | 37.6% |
| Dividend | None | $5.88 a year (~0.6%) |
| Free cash flow | -$7.6B (12 months) | about +$9.4B |
| Year-to-date share price change | +13.7% | +10.3% |
Amazon: 12 months to 30 Jun 2026. Costco: 12 months to 30 Aug 2026 (fiscal 2026). Prices: 9 Oct 2026 close. Sources: company filings; Costco filings; FinancialBeings calculations. Forward, analyst consensus: 10 Oct 2026. Dividend: current annualized rate.
The year-to-date leader has flipped
The early-2026 comparison has changed. From 31 December 2025 to 9 October 2026, Amazon rose from $230.82 to $262.43, or 13.7%; Costco rose from $858.55 to $946.92, or 10.3%. These are price changes, excluding dividends.
How do Amazon and Costco make money?
Cloud services generate most of Amazon’s operating income, while membership fees are central to Costco’s low-markup retail model. Operating income means profit from running the business before interest, investment gains and tax.
Amazon: retail, ads and AWS
Amazon earns revenue from online stores, third-party seller services, advertising, subscriptions and Amazon Web Services, its cloud-computing business. In the 12 months to June 2026, AWS generated about 58% of operating income from roughly a fifth of sales.
Costco: fees on top of thin margins
Costco’s US annual membership prices were $65 for Gold Star and $130 for Executive as of August 2026. At that date, it had 84.1 million paid members, including 42.3 million Executive members. Renewal rates were 92.3% in the US and Canada and 89.8% worldwide. Costco 2026 annual report.
Where the profit really comes from
Costco’s $5.9 billion of membership-fee revenue in the 12 months to August 2026 equalled about 51% of operating income, despite representing roughly 2% of revenue. That comparison does not mean every fee dollar is profit: Costco does not disclose a separate membership profit figure. Both are, in profit terms, something other than retailers.

Amazon combines retail, cloud and advertising; Costco combines merchandise sales and membership fees.
Which is growing faster, and what does that growth cost?
Amazon grew revenue faster over the latest 12 months, but its investment spending exceeded the cash its operations generated; Costco retained positive free cash flow.
Sales growth compared
Revenue grew 15.8% for Amazon in the 12 months to June 2026 and 10.1% for Costco in the 12 months to August 2026. Costco’s September 2024 fee increase has now passed its anniversary comparison, reducing that source of additional fee growth. Costco 2026 annual report.
Capex and free cash flow
Capital expenditure, or capex, pays for buildings and equipment. Free cash flow is cash left after paying for those investments.
On its 30 July 2026 earnings call, Amazon raised calendar-2026 cash capex guidance to about $220 billion. That is a spending plan, separate from the latest 12 months’ spending below.
| Measure | Amazon | Costco |
| Free cash flow | -$7.6B | about +$9.4B |
| Net capex | $169.0B | $6.4B |
| Net debt (cash) | about $119B net debt | $11.1B net cash |
| Net debt ÷ market value | about 4% | net cash |
Cash flows: 12 months to 30 June 2026 for Amazon and 30 August 2026 for Costco. Balance sheets: those period-end dates; market values: 9 October 2026. Sources: Amazon release, Costco cash-flow statement, FinancialBeings calculations.
Amazon’s new AI capacity requires cash before it contributes fully to earnings. Costco’s smaller investment requirement leaves more cash available. Net debt subtracts cash from financial obligations; net cash means cash exceeds those obligations.
Is Amazon really cheaper than Costco?
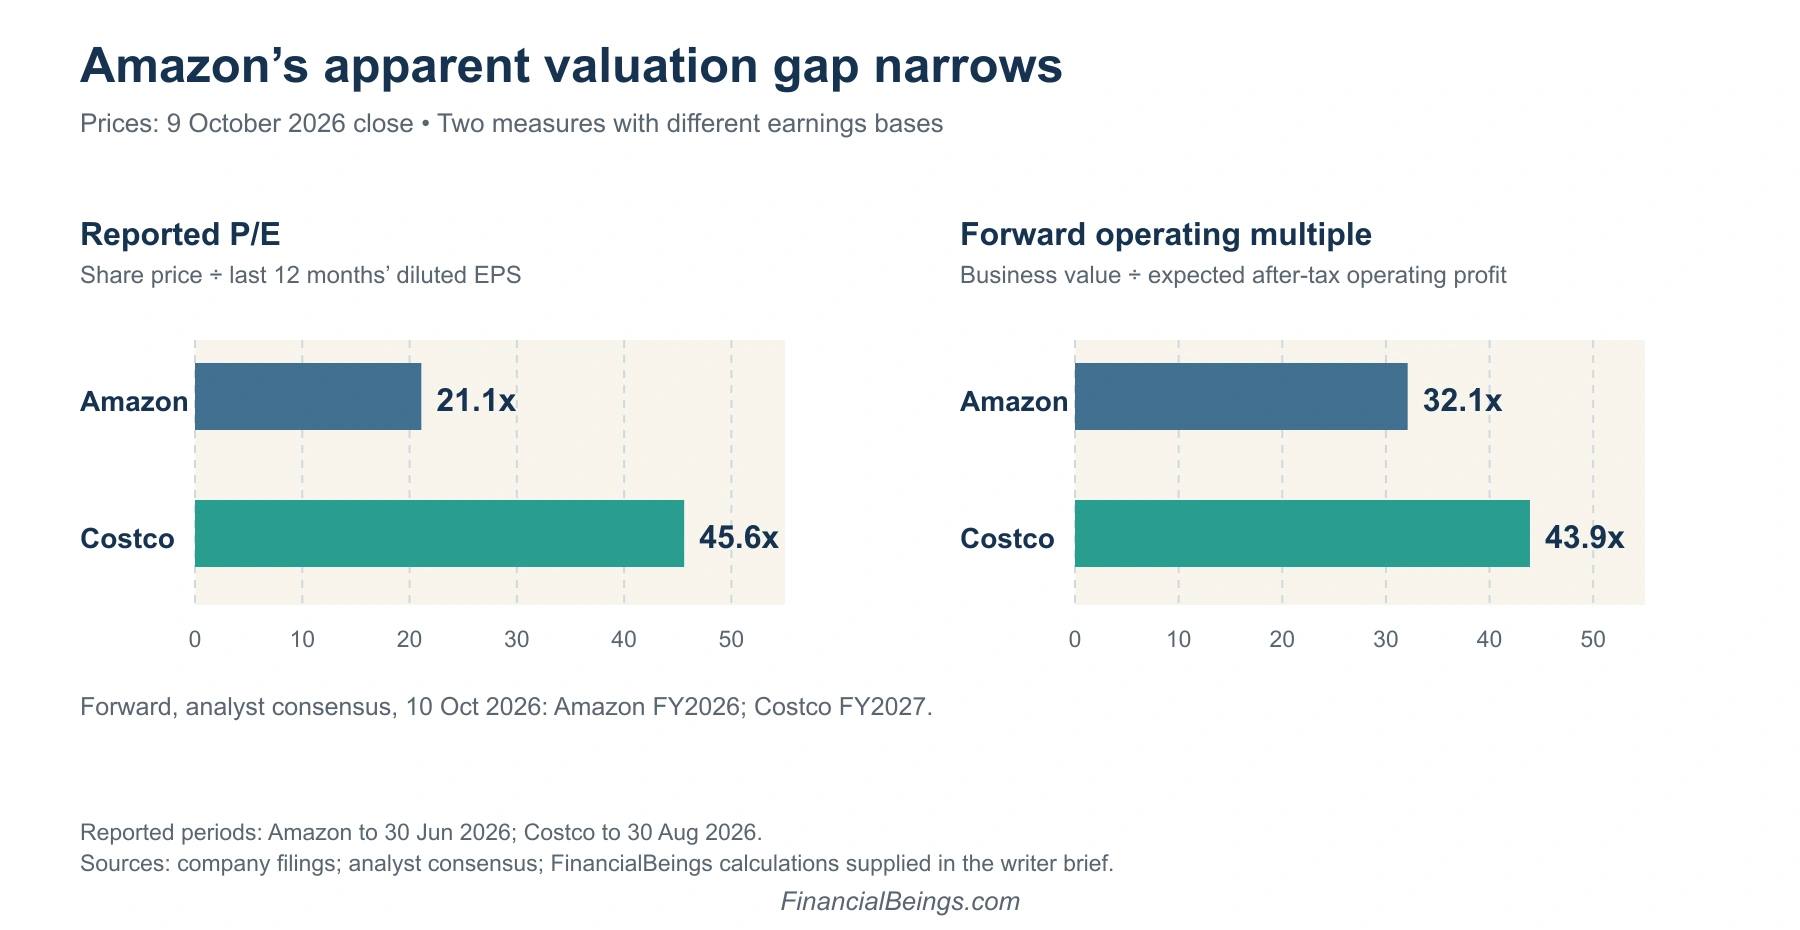
Amazon has the lower multiple, but the gap narrows substantially when the comparison uses expected operating profit rather than reported earnings.
Reported P/E vs profit from operations
| Measure | Amazon | Costco | Basis |
| P/E on reported earnings | 21.1x | 45.6x | Last 12 months, GAAP diluted EPS ($12.44 / $20.76) |
| Value of business ÷ expected after-tax operating profit | 32.1x | 43.9x | Forward, analyst consensus, 10 Oct 2026: Amazon FY2026, Costco FY2027 |
Prices: 9 Oct 2026 close. Sources: company filings; analyst consensus; FinancialBeings calculations.
The forward measure divides the operating business’s value by the average analyst forecast of after-tax operating profit. Amazon’s forecast year ends in December 2026; Costco’s in August 2027. It differs from P/E in both numerator and earnings period.
| Last 12 months | Amazon (to 30 Jun 2026) | Costco (to 30 Aug 2026) | Source |
| Net income (reported) | $135.3B | $9.2B | Quarterly filings, sum of 4 quarters |
| After-tax operating profit | $75.4B | $9.0B | FinancialBeings calculation |
| Non-operating income, first half 2026 (pre-tax) | $69.4B, mainly Anthropic | – | Amazon Q2 2026 release |
Non-operating income comes from outside the core business. Amazon’s first-half 2026 investment gains, mainly related to Anthropic, help explain why reported profit exceeds operating profit. Those accounting gains are real, but they are not earnings from retail or cloud services.
Return on operating assets
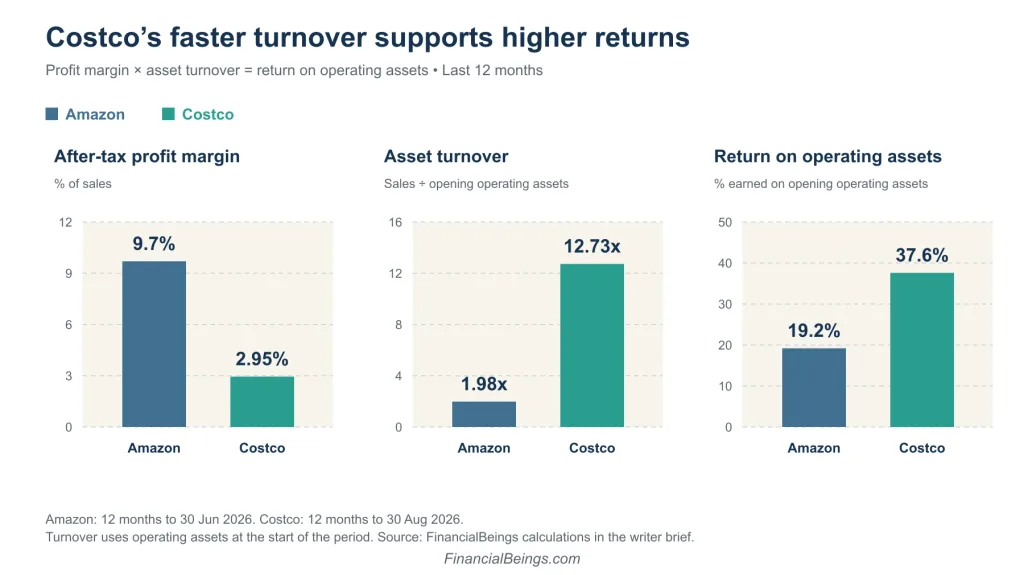
| Last 12 months | Profit margin (after tax) | Asset turnover | Return on operating assets |
| Amazon (to 30 Jun 2026) | 9.7% | 1.98 | 19.2% |
| Costco (to 30 Aug 2026) | 2.95% | 12.73 | 37.6% |
Turnover = 12 months of sales ÷ operating assets at the start of the period. Source: FinancialBeings calculations from company filings.
Profit margin measures after-tax operating profit per dollar of sales. Asset turnover measures sales per dollar tied up in operations. Multiply them to find return on operating assets.
During these periods, Costco earned about 3 cents per sales dollar and turned its operating money over almost 13 times; Amazon earned nearly 10 cents and turned it over about twice. Costco’s low margins therefore produced the higher return.
Across fiscal 2018–2025 and the latest 12 months, Costco stayed between about 29% and 38%; Amazon swung between about 7% and 51%. Amazon’s return also reflects data centres recorded as assets before they fully earn. To see the same return-based approach applied to another large cloud and AI company, read our Microsoft expected return analysis 2026-2030.
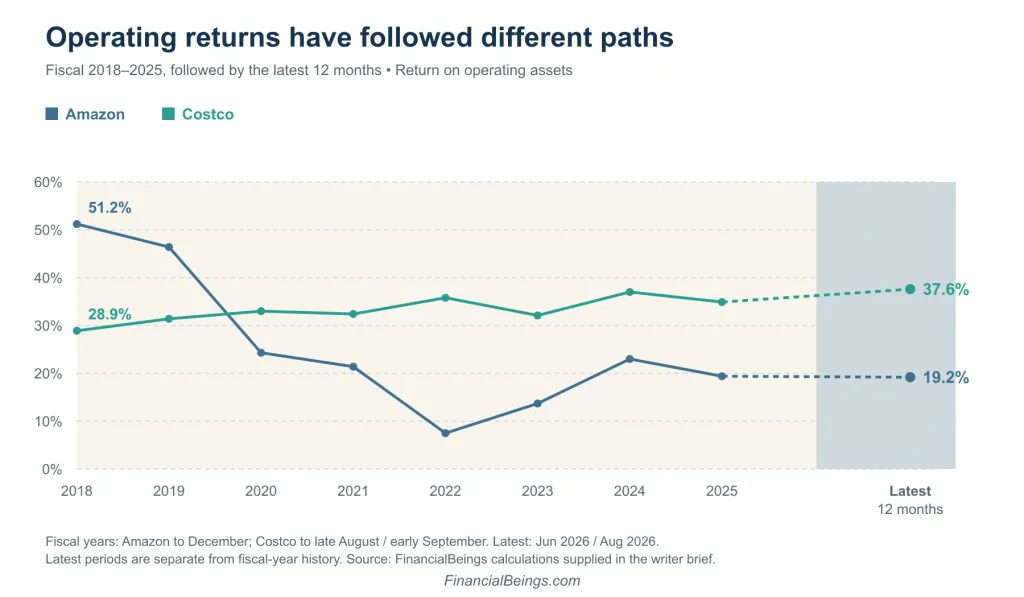
Fiscal years (Amazon to December, Costco to late August/early September). Source: FinancialBeings calculations from annual 10-K filings.
What growth each share price implies
| Required return | Amazon | Costco |
| 8% | 6.1% | 6.2% |
| 9% | 7.2% | 7.2% |
| 10% | 8.4% | 8.3% |
Yearly growth in profit above the required return that the 9 Oct 2026 price assumes, indefinitely. Last 12 months’ operating profit. Source: FinancialBeings calculations.
At an 8% required return, Amazon’s price implies 6.1% yearly growth in profit above that threshold; Costco’s implies 6.2%, indefinitely. These are model assumptions, not forecasts of sales or share prices. For a deeper look at how Amazon’s price changes with different growth rates, see our Amazon intrinsic value analysis.
The near-identical growth assumptions suggest Costco’s higher multiple pays for returns earned today. Amazon’s valuation depends more on capital already being committed producing additional profit.
What are the main risks for each stock?
Amazon’s risk centres on whether heavy investment earns enough; Costco’s centres on sustaining strong operations at a demanding valuation.
Amazon risks
Negative free cash flow in the 12 months to June 2026 increases Amazon’s financing needs. Long-term debt rose from $65.6 billion at December 2025 to $128.9 billion at June 2026. If AI capacity earns less than expected, returns have less support. Anthropic valuation changes can move reported earnings sharply, while regulatory scrutiny adds uncertainty. Heavy AI spending raises the same valuation question for other large tech companies, as in our Meta intrinsic value analysis.
Costco risks
At 45.6x reported earnings on 9 October 2026, Costco has limited room for disappointment. If membership-fee growth slows after the September 2024 increase passes its comparison period, the multiple has less support. Thin merchandise margins leave earnings sensitive to costs, while weaker consumer spending can reduce sales and membership demand.
What questions do investors ask about Amazon and Costco?
Investors commonly ask about valuation, dividends and where each company’s profit comes from.
Is Amazon or Costco the better stock to buy?
It depends on what you need. At an 8% required return, both share prices imply roughly 6% a year growth in profit above that return. Over the last 12 months Costco earned about 38% on its operating assets; Amazon earned about 19% while investing heavily in AI. This is education, not advice.
Why is Amazon’s P/E so much lower than Costco’s?
Amazon’s Q2 2026 profit included $53.4 billion of investment gains, mainly from Anthropic. That inflates trailing earnings. On reported earnings Amazon trades near 21x against Costco’s 46x; on analysts’ expected operating profit for the next fiscal year, the gap narrows to roughly 32x versus 44x.
Does Costco pay a dividend? Does Amazon?
Costco pays $1.47 a quarter ($5.88 a year), a yield of about 0.6% at 9 October 2026 prices, and has paid five special dividends since 2012. Amazon pays no dividend and reinvests its cash in the business instead.
How much of Costco’s profit comes from membership fees?
Costco collected $5.9 billion in membership fees in fiscal 2026, about half of its operating income, from roughly 2% of its revenue. Members renewed at 92.3% in the US and Canada and 89.8% worldwide.
How much of Amazon’s profit comes from AWS?
AWS produced about 58% of Amazon’s operating income over the 12 months to June 2026, from roughly a fifth of its sales. AWS sales grew 37% to $42.2 billion in Q2 2026, its fastest growth in 18 quarters.
Which kind of investor does each stock suit?
Costco fits investors who value a recurring dividend and an established membership model; Amazon fits those comfortable with substantial reinvestment and cash-flow uncertainty.
As of 9 October 2026, Costco’s regular dividend was $1.47 quarterly, or $5.88 annualized, yielding about 0.6%. Its five special dividends since 2012 are separate from that recurring income and should not be assumed to repeat. Amazon pays no dividend.
Both prices imply roughly 6% annual growth in profit above an 8% required return at the 9 October 2026 close. The difference is how each business gets there: Costco’s fast turnover supports high current returns, while Amazon commits much more capital to future capacity.
Read about FinancialBeings’ valuation approach, compare Walmart vs Costco stock, or explore the separate Costco stock forecast.
