
You have probably owned one of these two stocks. Or you have watched one of them run away without you.
Both have made people rich. Both have also punished people who arrived late. Since May, Tesla has swung from about $436 to $311 and back to $378. That is a lot of sleepless nights for one share.
So the useful question is not which chart looks prettier. It is simpler, and a little uncomfortable: what does each price ask you to believe?
We compare both companies using a 10% required operating return and the same NOPAT-based implied-growth measure. NOPAT (net operating profit after tax) is the profit from the day-to-day business after tax, leaving out interest, investment gains and other non-operating items. Separate scenarios based on residual operating income (ReOI, or residual profit), the operating profit left after charging a 10% return on the capital the business uses, show how valuation changes with growth. The analysis uses the latest full fiscal year for its valuations and newer quarterly evidence through July 2026.
The quick answer
On the same NOPAT-based measure, Nvidia’s current enterprise value (the market value of its shares plus debt, minus cash) implies 7.94% long-run growth, compared with 9.78% for Tesla. Nvidia earns well above the assumed capital hurdle; Tesla currently earns below it.
Table 1. Valuation comparison using the September 2026 workbook snapshot
| Nvidia (NVDA) | Tesla (TSLA) | |
| Share price | $224.58 | $377.94 |
| Market value | $5,422.9B (24.15B shares) | $1,492.7B (3,949.5M shares) |
| Return on operating capital, latest fiscal year | 131.6% | 7.8% |
| Operating income above a 10% cost of capital, latest four quarters | +$155.8B | –$1.6B |
| Current NOPAT-implied long-run growth | 7.94% (FY2026 earnings) | 9.78% (FY2025 earnings) |
| Model value per share at 5% growth | $93.39 (42% of price) | $15.66 (4% of price) |
| Trailing no-growth premium (% of price) | 78% | 95% |
Compared with what each business would be worth with no growth, approximately 78% of Nvidia’s price and 95% of Tesla’s price represent a growth premium.
Nvidia: a price that execution can still earn
Nvidia’s residual-profit valuation curve meets its $224.58 reference price at about 8.01% perpetual growth. This is a separate measure from the 7.94% above; the methodology section explains the difference.
In fiscal 2026 (the year to January 25, 2026), Nvidia sold $215.9B of products. It kept $109.5B as operating profit after tax. That is about 51 cents of every sales dollar.
It also earned 131.6% a year on the capital its operations use. Our bar is 10%. Nvidia clears it thirteen times over.
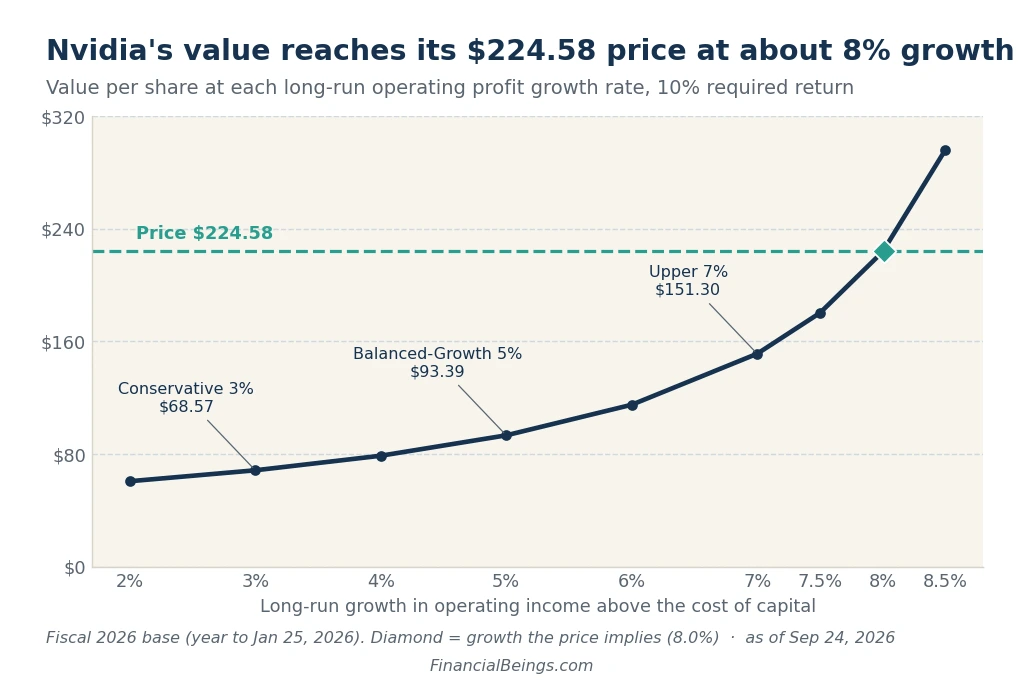
Nvidia’s value per share across perpetual residual-profit growth assumptions, with the $224.58 reference price and approximately 8.01% break-even growth.
Figure 1. NVDA: value per share vs long-run growth (10% required return).
The curve climbs steeply because Nvidia already makes big profits above its cost of capital. Growth multiplies something that is already large.
- Conservative (3% growth): $68.57 a share, 31% of the price.
- Balanced-Growth (5% growth): $93.39 a share, 42% of the price.
- Upper (7% growth): $151.30 a share, 67% of the price.
- At 8% growth: $223.70, almost exactly today’s price.
The residual-profit model therefore requires sustained growth above the selected 2%–4% reference range. Recent performance has been strong: over the latest four quarters, Nvidia’s sales reached $303.0B and sustainable profit above the capital charge reached $155.8B. Recent growth does not establish that such performance can continue indefinitely.
For a deeper look at Nvidia alone, see our Nvidia intrinsic value 2026 analysis.
Tesla: record sales, but the engine is running below cost
At a 10% required return, Tesla’s model value falls from $17.59 at 2% perpetual growth to $3.69 at 8.5%. At 5%, 7%, and 8%, the values are $15.66, $12.24, and $7.97, respectively, against a $377.94 reference price.
That gap is not a typo.
In 2025, Tesla earned 7.8% on its operating capital. Over the four quarters to June 30, 2026, it earned 6.6%. Our bar is 10%. So Tesla’s profit above the cost of capital was –$1.0B in 2025 and –$1.6B over the latest four quarters.
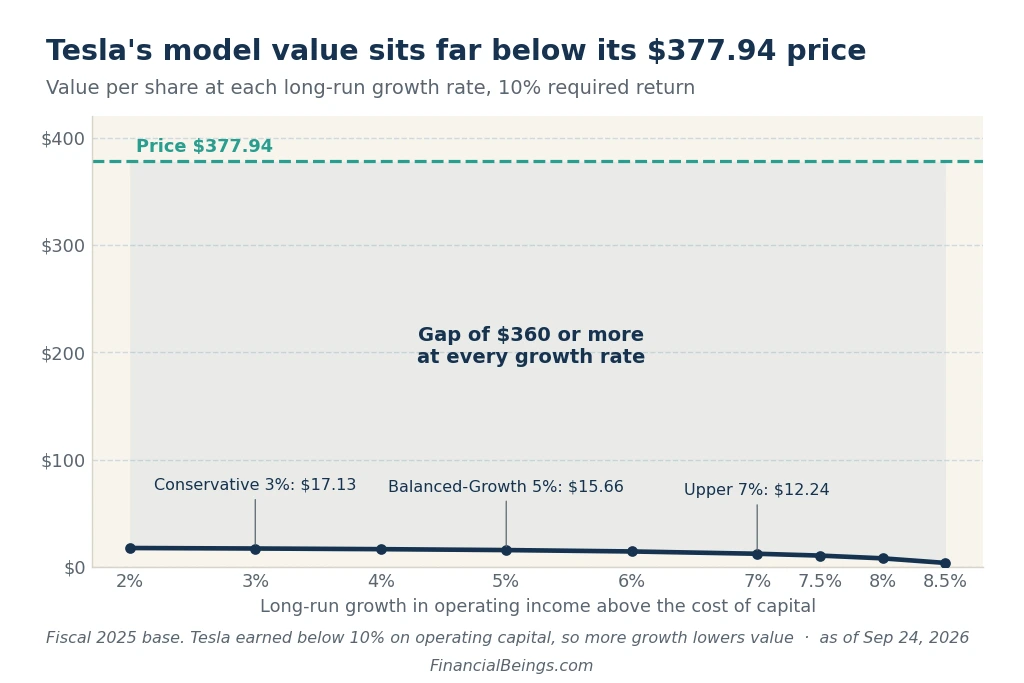
Tesla’s value per share across perpetual residual-profit growth assumptions. The declining curve assumes its negative residual-profit economics persist.
Figure 2. TSLA: value per share vs long-run growth (10% required return).
- With no growth at all: $18.24 a share.
- Conservative (3% growth): $17.13, 4.5% of the price.
- Balanced-Growth (5% growth): $15.66, 4.1% of the price.
- Upper (7% growth): $12.24, 3.2% of the price.
Higher growth lowers value in this particular scenario because it extends negative residual-profit economics. It does not mean that every additional sale destroys value. Better margins, improved capital efficiency, or profitable new investment could change the relationship.
Using the same NOPAT-based method as Nvidia, Tesla’s current enterprise value implies 9.78% long-run growth, versus Nvidia’s 7.94%. Separately, because Tesla’s residual profit is negative, no growth rate on its value curve matches the share price.
Tesla’s latest quarter also warrants a closer look. Trailing sales reached $103.6B, including a record $28.236B in April–June 2026. Reported earnings were $1.114B, while our estimate of its after-tax operating income was $0.328B. The filing discloses an approximately $1.00B gain on its SpaceX equity investment.
For what could push the price lower, see Is a Tesla stock crash coming?
Nvidia stock growth vs Tesla stock growth: how much of the price is covered
Under the unchanged residual-profit assumptions, growth narrows Nvidia’s valuation gap and widens Tesla’s. This chart compares those valuation sensitivities.
The chart shows “value coverage”: our model value divided by today’s price. At 100%, the value fully supports the price.
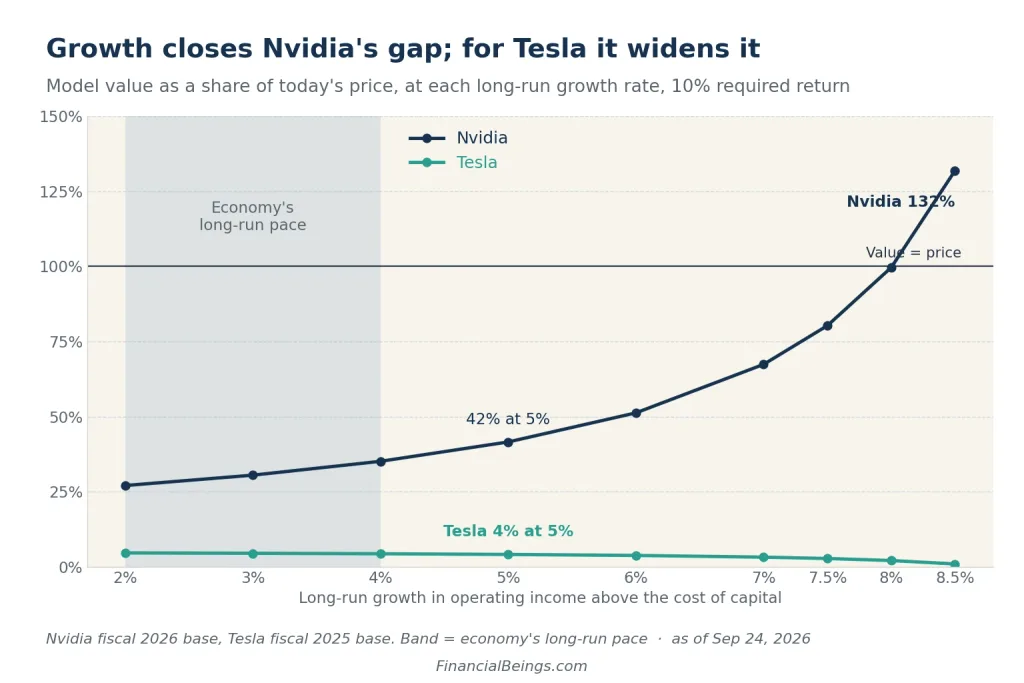
Model value divided by the reference share price. The shaded band is the selected 2%–4% long-run growth range.
Figure 3. Value coverage vs growth rate: NVDA vs TSLA (10% required return).
Table 2. Value coverage at selected growth rates
| Long-run growth | Nvidia: value ÷ price | Tesla: value ÷ price |
| 2% | 27% | 4.7% |
| 5% | 42% | 4.1% |
| 7% | 67% | 3.2% |
| 8% | 100% | 2.1% |
Within the selected 2%–4% growth range, Nvidia’s model value covers about 27%–35% of its reference price. Tesla’s covers under 5%.
Neither stock has a margin of safety in those scenarios. At higher assumed growth, Nvidia’s curve approaches its reference price, while Tesla’s declines under unchanged negative residual-profit economics.
Operating capital explains the shapes of the curves
Both companies are pouring far more money into their operations. What matters is what each dollar earns.
Operating capital, or net operating assets, is what a company has invested to run its business, such as factories, equipment and inventory, minus what it owes in day-to-day operations, such as supplier bills. Cash and borrowing are kept separate.
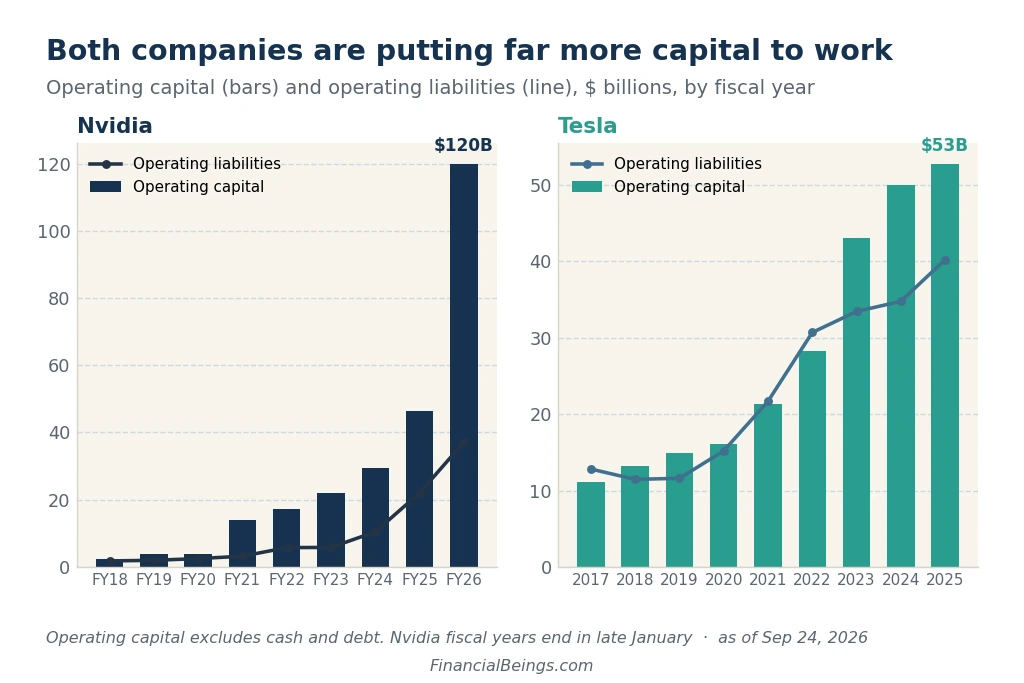
Operating capital (bars) and operating liabilities (line), $ billions. Nvidia’s fiscal years end in late January.
Figure 4. NVDA and TSLA: operating capital vs operating liabilities.
Nvidia’s operating capital went from $46.4B to $120.0B in fiscal 2026. By July 2026 it had reached $212.3B. That is roughly four times the level of a year earlier.
Tesla’s operating capital grew more slowly, from $52.8B at the end of 2025 to $59.4B by June 2026. But Tesla’s problem is not the size of the base. It is what the base earns.
Return on operating capital: the quality check
Return on operating capital tells you how hard each dollar in the business is working. It decides whether growth turns into value.
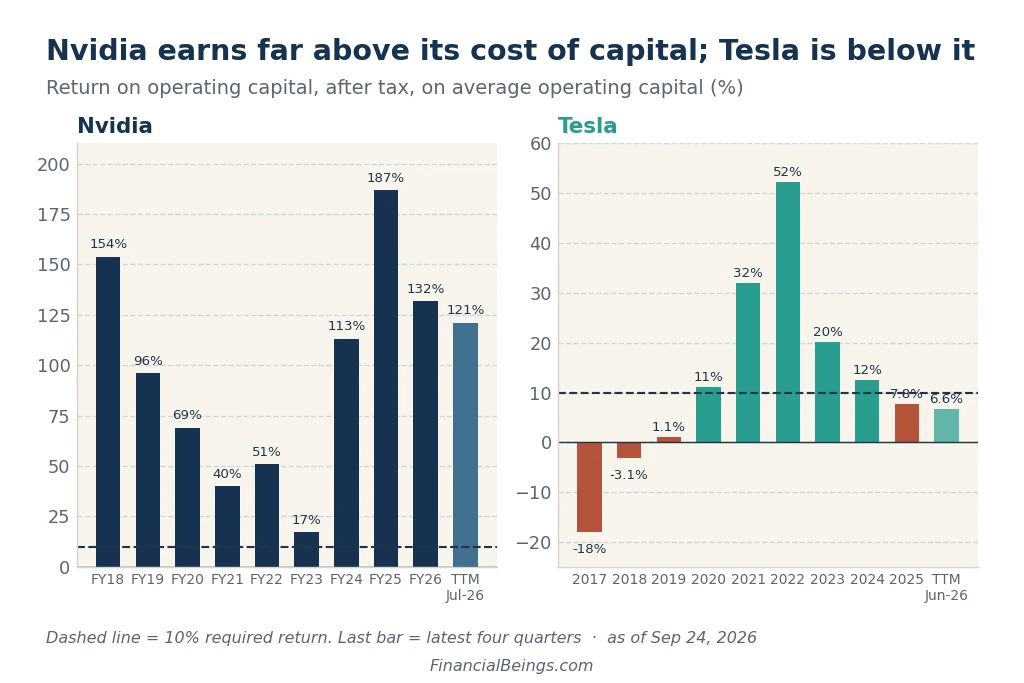
After-tax return on average operating capital, by fiscal year. The dashed line is the 10% required return. The last bar in each panel covers the latest four quarters.
Figure 5. NVDA and TSLA: return on operating capital.
Nvidia’s return swings a lot. It fell to 17% in fiscal 2023, jumped to 187% in fiscal 2025, and sits at 121% over the latest four quarters. Even its worst year cleared the 10% bar.
Tesla’s return peaked at 52.3% in 2022. It has fallen every year since: 20.2%, 12.5%, 7.8%, and 6.6% over the latest four quarters.
Why? Two things broke at once. In 2022, Tesla kept about 16 cents of every sales dollar as after-tax operating profit. In the latest four quarters it kept under 4 cents. And each dollar of operating capital now produces $1.83 of sales, down from $3.28.
Profit above the cost of capital: where value really comes from
A company creates value only when it earns more than its capital costs. Tesla did that from 2020 to 2024. In 2025 it stopped.
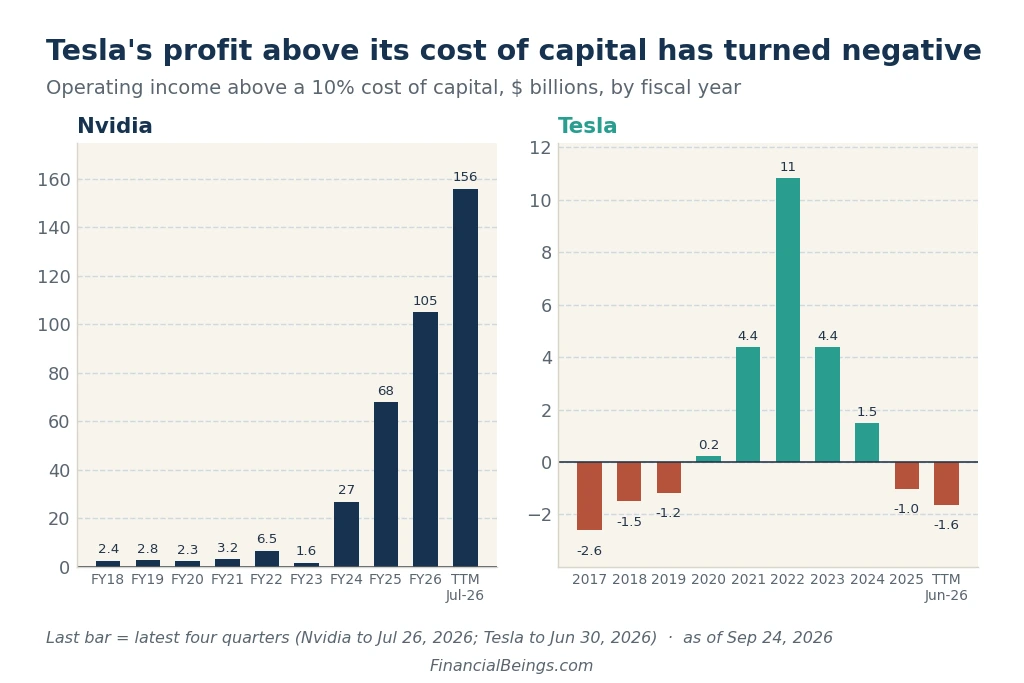
Operating income above a 10% cost of capital, $ billions. The last bar covers the latest four quarters (Nvidia to July 26, 2026; Tesla to June 30, 2026).
Figure 6. NVDA and TSLA: operating income above the cost of capital.
Tesla’s best year was 2022, with $10.8B of profit above its cost of capital. Then it fell: $4.4B, $1.5B, –$1.0B, and –$1.6B over the latest four quarters.
Nvidia’s excess profit stayed under $7B a year until fiscal 2024. Then it rose to $26.9B, $67.8B, $104.9B, and $155.8B over the latest four quarters.
What the market has asked for over time
On the common current NOPAT measure, Tesla’s 9.78% exceeds Nvidia’s 7.94% by 1.84 percentage points. The historical chart uses the same NOPAT formula.
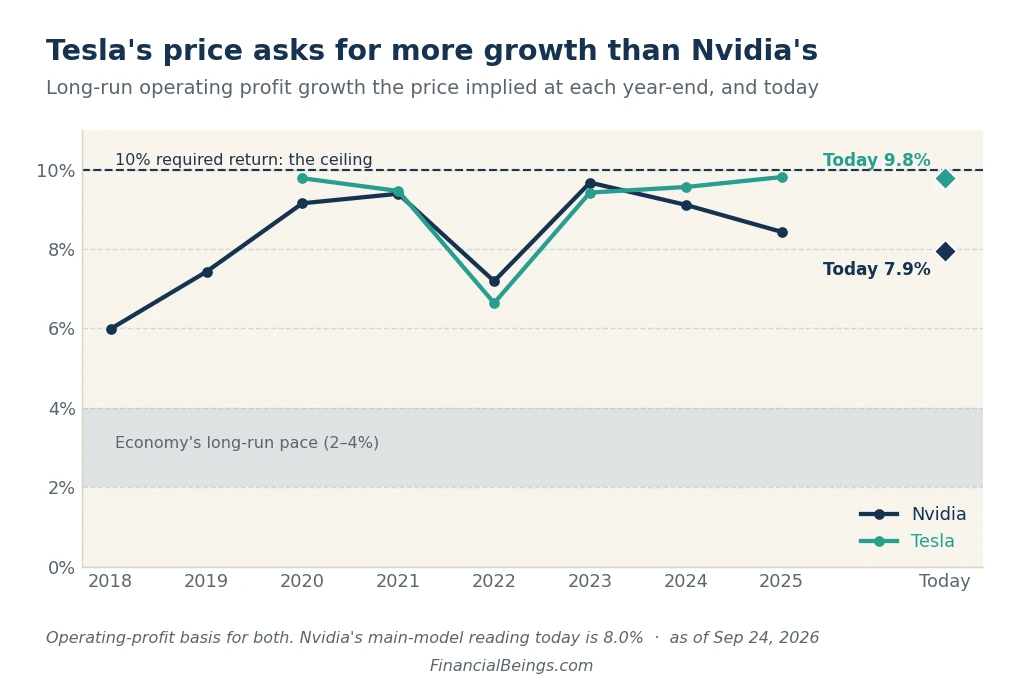
NOPAT-implied growth by year. The final point uses current enterprise value. The dashed 10% line is the assumed discount rate.
Figure 7. NVDA and TSLA: growth implied by the share price, by year.
The one time Tesla’s price asked for modest growth was the end of 2022, at 6.6%. The stock had just fallen to about $123. Since then it has asked for 9.4% to 9.8% every year.
For the year labelled FY2023, Nvidia’s NOPAT-implied growth was 9.7%. The current estimate is 7.94%.
The chart shows how the NOPAT-based valuation measure has changed.
Tesla vs Nvidia 2030 Valuation Scenarios at a 10% Annual Return
For a four-year illustration from September 2026 to September 2030, we compound each 2026 model value at 10% annually. The 5%, 6%, 7%, and 8% inputs determine the starting ReOI valuations; they are not the annual investment return used in this calculation.
Illustrative 2030 compounded amount = 2026 model value × 1.4641.
These are hypothetical compounded amounts, not trading-price predictions or fresh valuations of the businesses in 2030.
Table 3. Four-year compounded model values at an assumed 10% annual return
| Long-run growth | NVDA 2026 value | NVDA 2030 compounded amount | TSLA 2026 value | TSLA 2030 compounded amount |
| 5% | $93.39 | $136.73 | $15.66 | $22.93 |
| 6% | $115.10 | $168.52 | $14.38 | $21.05 |
| 7% | $151.30 | $221.52 | $12.24 | $17.92 |
| 8% | $223.70 | $327.52 | $7.97 | $11.67 |
Nvidia’s 8% residual-profit growth case starts at $223.70, close to its $224.58 reference price, and compounds to $327.52. The 5%–7% cases compound to amounts below that reference price. These calculations start from model values; compounding the $224.58 market price itself at 10% would instead give $328.81.
Tesla’s hypothetical compounded amount falls from $22.93 at 5% growth to $11.67 at 8% growth because its starting ReOI valuation declines as negative residual-profit economics are extended. Compounding the $377.94 market price itself at 10% would require $553.34 after four years. Neither calculation forecasts Tesla’s future operating performance.
The case against each stock, then what would have to be true
We name the risks first. A valuation you only read from the hopeful side is not a valuation.
The case against Nvidia
- The capital is ballooning. Operating capital roughly quadrupled in a year, to $212.3B. Returns have already slipped, from 187% in fiscal 2025 to 121% over the latest four quarters. If spending keeps outrunning profit, returns fall further.
- The residual-profit valuation still requires about 8.01% perpetual growth to meet the reference price. That exceeds the selected 2%–4% range. A slowdown in AI spending would test the assumption.
- Competition and customers. Big buyers building their own chips, or rivals cutting prices, would squeeze the margin that makes the curve so steep.
The case against Tesla
- Returns remain below the hurdle. Over the latest four quarters, Tesla earned 6.6% on its operating capital, versus the assumed 10%. Expanding without improving that return would add to the shortfall.
- NOPAT-implied growth is 9.78%. Because this is so close to the 10% discount rate, the valuation is very sensitive to small changes in assumptions.
- Reported profit flatters the engine. In the latest quarter, most of the earnings came from outside the operating business.
- Approximately 95% of the price is a growth premium over Tesla’s no-growth value.
What would have to be true for Tesla
Tesla’s valuation depends on improved returns and additional profit from expanding energy storage and successfully scaling autonomy and robotics. Energy is already an established contributor: the Q2 2026 filing reports $640M of energy-segment gross profit. The table below tests stronger operating-return assumptions.
Table 4. If Tesla’s return on operating capital recovers
| If the return settles at | Growth the price then needs | Value ÷ price at 4% growth |
| 20% | 9.6% a year | 11% (about $43) |
| 30% | 9.3% a year | 17% (about $65) |
| 40% | 8.9% a year | 23% (about $88) |
| 50% | 8.5% a year | 29% (about $110) |
At a 50% operating-return assumption, the table still requires about 8.5% perpetual residual-profit growth. That 50% is close to Tesla’s 2022 peak return of 52.3%. For comparison, Nvidia’s value curve needs about 8.01%.
That does not make Tesla’s future small. It makes today’s price large. The price has already paid for a great deal of success that has not happened yet.
What would have to be true for Nvidia
In the residual-profit scenario, Nvidia needs about 8.01% perpetual growth to match its reference price. At 7%, value covers 67% of the price; at 8%, it covers 99.61%, or approximately all of it. Maintaining strong returns as operating capital grows remains central to the case.
Portfolio fit 2026: what each kind of investor is really signing up for
We do not rate stocks. We show what each price assumes, so you can decide whether you agree with it.
Growth portfolio
If you own Nvidia, its current NOPAT-based valuation implies 7.94% long-run growth. The question to watch is whether operating returns stay high as the capital base grows.
If you own Tesla, the price relies heavily on improved profitability and future expansion beyond today’s earnings base. Existing automotive and energy operations already contribute to results; the uncertainty is how much additional value better execution and new activities can create.
Balanced portfolio
Nvidia’s model value is approximately fully covered at 8% residual-profit growth and two-thirds covered at 7%. Tesla’s is less than 5% covered across the displayed 2%–8.5% range at the 10% hurdle, while its residual profit stays negative.
Conservative portfolio
At the selected 2%–4% long-run growth assumptions, neither reference price is covered. Nvidia’s model value covers 27%–35% of its price, while Tesla’s covers under 5%. Neither offers a margin of safety within those scenarios.
Conclusion
The charts look alike from a distance: two famous growth stories with big prices. Up close, they are opposites.
Nvidia is priced for strong growth, and its business already earns enough that growth adds value. Its risk is that the pace slows or that its much larger capital base earns less.
Tesla’s current NOPAT-implied growth is 9.78%, compared with Nvidia’s 7.94% on the same basis. Tesla’s operating returns remain below the assumed hurdle. Its valuation therefore depends heavily on improved economics and future expansion; additional sales alone do not establish value creation.
Whichever you own, know what you are paying for. For Tesla’s longer road, see our Tesla stock forecast 2030. For a car-industry comparison, see Tesla vs Ford stock.
All calculations and valuation estimates are Financial Beings’ own, based on data from SEC filings by NVIDIA and Tesla (10-K and 10-Q). Use or reproduction without prior approval is prohibited.
Frequently Asked Questions (FAQs)
Is Tesla more expensive than Nvidia in 2026?
On the common current NOPAT measure, Tesla implies 9.78% long-run growth versus Nvidia’s 7.94%, a difference of 1.84 percentage points. Separately, at 5% residual-profit growth, model values cover approximately 4% of Tesla’s price and 42% of Nvidia’s.
What growth does Tesla’s stock price assume?
The current NOPAT-implied estimate is 9.78%, using the latest completed fiscal-year earnings and current enterprise value. Because this is so close to the 10% assumed discount rate, the calculation is very sensitive to small changes in assumptions.
What growth does Nvidia’s stock price assume?
The current NOPAT-implied estimate is 7.94%, using the latest completed fiscal-year earnings and current enterprise value. Separately, Nvidia’s ReOI valuation curve reaches the $224.58 reference price at about 8.01% perpetual residual-profit growth.
Why does Tesla’s value go down when growth goes up?
The displayed sensitivity extends negative residual-profit economics, so higher assumed growth lowers the model value. That does not establish that all future growth destroys value. Improved margins, better capital efficiency, or new investments earning above their hurdle could change the result.
What would Tesla need to deliver to justify about $378 a share?
Stronger profitability and sustained growth together. At a 50% return assumption, the reference price still requires about 8.5% perpetual residual-profit growth. This is a scenario, not a forecast of Tesla’s recovery.
How were these numbers calculated?
From each company’s SEC filings, using the same 10% required return for both companies. The methodology section below explains the details.
Methodology
- Required return. Both companies are tested against the same assumed 10% return. It is an investment hurdle, not either company’s borrowing rate.
- Two growth measures. NOPAT-implied growth equals 10% minus NOPAT divided by enterprise value. It uses each company’s latest completed fiscal year (Nvidia FY2026, Tesla FY2025), so the reporting periods are not identical. The value curves grow residual profit instead; Nvidia’s curve meets its price at about 8.01%. Because Tesla’s residual profit is negative, no growth rate on its curve matches its price. A rate close to 10%, like Tesla’s 9.78%, makes this constant-growth calculation very sensitive to small changes, but 10% is not a limit on growth over shorter periods.
- Base years and newer data. Valuations use the latest full fiscal year. Figures for the latest four quarters are shown for context and do not replace those bases.
- Returns and operating capital. Return charts divide sustainable after-tax operating income by average operating capital. Residual profit charges 10% on operating capital at the start of each period, so the two use different capital figures. Cash and financing debt are classified separately from operating capital. Table 4 applies each return to Tesla’s fiscal 2025 operating capital, so its 50% row is not directly comparable with Tesla’s 52.3% return in 2022.
- Growth premium and the 2%–4% range. The share of the price above no-growth value is a model split, not a probability or a measure of speculation. No-growth values use their own historical share-count conventions. The 2%–4% long-run growth range is a selected assumption, not a GDP forecast.
- Figure 7 dates. Each point pairs a calendar year-end enterprise value with the labelled fiscal year’s NOPAT; the final point uses current enterprise value. Because Nvidia’s fiscal year ends in late January, its FY2023 point uses the December 29, 2023 price with the fiscal year ended January 29, 2023. The series is not a valuation at Nvidia’s fiscal year-ends.
- Tesla’s quarter and energy figures. The $0.328B operating-income estimate is our calculation, not a split Tesla reports; taxes and other non-operating items also affect the reconciliation with reported earnings. Energy gross profit is not segment net income.
- 2030 illustration. It assumes no interim payouts, or payouts reinvested at the same 10%. The 10% is illustrative: the workbook separately estimates required returns on the shares of 9.96% for Nvidia and 9.87% for Tesla.
Sources
Source basis: Financial Beings valuation workbook dated September 25, 2026, with September 2026 reference prices of $224.58 for Nvidia and $377.94 for Tesla. Prices are presented as stored snapshot inputs rather than independently verified official closing quotes. The underlying company sources include the SEC filings linked below. Valuations and reformulated operating metrics are Financial Beings calculations.
Independent research for informational purposes only. Not investment advice.
