

Tesla and Ford present different investment choices, but their operating numbers reveal a shared problem. Both earned less than the 10% operating return assumed in our FY2025 analysis. Tesla generated more profit per dollar of revenue, while Ford generated more revenue per dollar of operating capital. Neither strength was enough to clear that hurdle.
Tesla has the stronger starting position on modeled operating profitability. Ford offers a regular dividend, but the positive recovery scenarios examined here require a much larger improvement in margin. Which stock is the better buy depends on the credibility of those improvements and the price investors pay for them.
Our comparison of Tesla vs Ford stock connects profit margin, asset turnover and revenue to show what progress could look like by 2027. The six combinations are conditional operating scenarios. They identify outcomes that fit specified revenue bounds, rather than predict future share prices.
Tesla vs Ford stock at a glance
| Measure | Tesla | Ford |
| Ticker | NASDAQ TSLA | NYSE F |
| Share price on October 16, 2026 | $354.72 | $12.43 |
| Equity market value in the dated snapshot | $1,400.98 billion | $49.57 billion |
| Q2 2026 consolidated revenue | $28.236 billion | $48.296 billion |
| Q2 revenue change from a year earlier | +25.52% | −3.76% |
| FY2025 sustainable operating profit margin after tax | 4.14% | 0.55% |
| FY2025 asset turnover | 1.898× | 4.743× |
| FY2025 return on net operating assets | 7.86% | 2.61% |
Sources: Financial Beings calculations and market snapshot; Tesla Q2 2026 filing and Ford Q2 2026 filing. Quarterly growth is calculated from comparable reported revenue. The operating ratios use the FY2025 model baseline.
Ford recorded more quarterly revenue, while Tesla grew faster in the second quarter. Those observations describe business activity. To understand the return earned on operating capital, we also need to examine how much profit survives each dollar of sales and how much capital supports those sales.
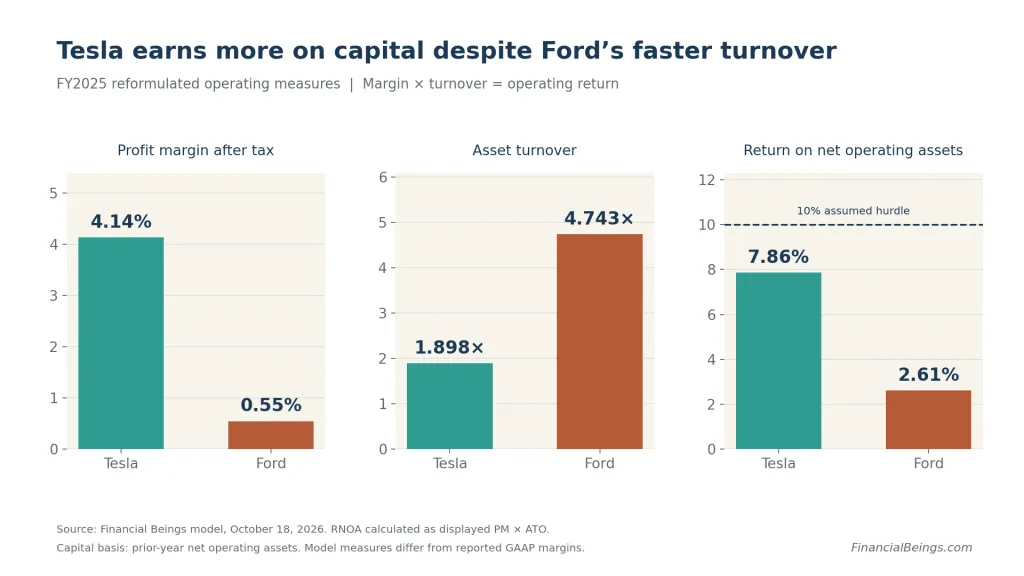
Figure 1. Tesla earned the higher modeled operating return despite Ford’s faster turnover. The 10% line is an assumed required operating return.
Why profit margin and asset turnover belong together
Profit margin, or PM, measures the sustainable operating profit after tax generated from revenue. At Tesla’s modeled FY2025 margin of 4.14%, each dollar of revenue produced about 4.14 cents of sustainable operating profit after tax. Ford’s corresponding figure was 0.55 cents.
Asset turnover, or ATO, measures revenue relative to net operating assets. Ford’s 4.743× turnover exceeded Tesla’s 1.898×. Under the model’s accounting classifications, Ford generated considerably more revenue per dollar of operating capital.
Multiplying the two gives return on net operating assets, or RNOA:
RNOA= profit margin x asset turnover
Tesla’s 4.14% margin multiplied by 1.898 gives an operating return of approximately 7.86%. Ford’s 0.55% margin multiplied by 4.743 gives approximately 2.61%. Tesla’s margin advantage therefore more than offset Ford’s faster turnover in this comparison.
These figures use our reformulated sustainable operating income after tax. They differ from reported gross margin, net margin and management’s adjusted EBIT margin. Sustainable other operating items are included where appropriate. Ford’s financing activities also affect the accounting comparison, so the figures should not be interpreted as returns from vehicle manufacturing alone.
The margin needed to cover the capital charge
At unchanged FY2025 turnover, Tesla would need a margin of approximately 5.27% to earn a 10% operating return. Ford would need approximately 2.11%.
| Company | FY2025 margin | Margin needed for 10% RNOA at unchanged turnover |
| Tesla | 4.14% | 5.27% |
| Ford | 0.55% | 2.11% |
The threshold measures the return on operating capital. It is separate from the return a shareholder might earn on the purchase price of the stock.
Both businesses also entered the comparison with weaker operating returns than a year earlier. On the same PM × ATO basis, Tesla’s RNOA fell from 15.57% in FY2024 to 7.86% in FY2025, a decline we also examine in “Is a Tesla stock crash coming“. Ford’s fell from 16.80% to 2.61%. A recovery thesis needs evidence that the drivers of those declines can improve.
Tesla has several possible routes to stronger operating earnings
Tesla can improve its operating return through higher margins, more productive use of capital, or both. Our selected 2027 scenarios show how those choices affect the revenue needed to support approximately $1.55 billion of residual operating income.
Residual operating income is the profit left after deducting the assumed charge for operating capital. It helps distinguish accounting profitability from the additional earnings generated above the required operating return.
| Tesla FY2027 scenario | PM after tax | ATO | RNOA | Required revenue |
| Greater capital efficiency | 4.14% | 3.40× | 14.08% | $129.29 billion |
| Margin and efficiency improvement | 5.14% | 2.60× | 13.36% | $119.80 billion |
| Greater reliance on margin | 7.14% | 1.70× | 12.14% | $123.25 billion |
Source: Financial Beings model, October 18, 2026. All three combinations fall within its FY2027 revenue interval of $99.74 billion to $151.79 billion and use a 10% capital charge. Figures are rounded.
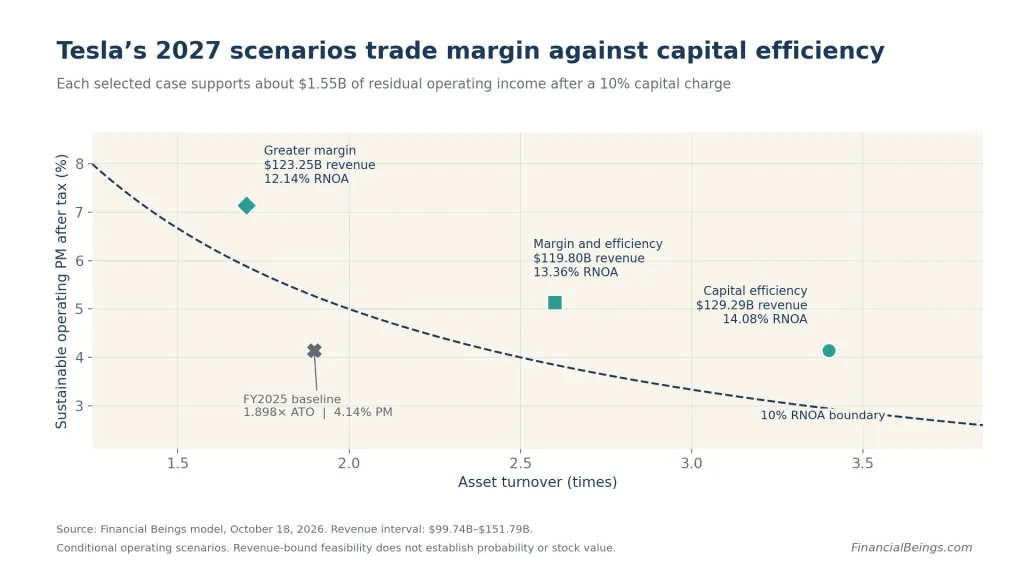
Figure 2. Tesla’s three scenarios trade margin against capital efficiency. Each reaches the same selected residual-income goal, through a different operating combination.
Greater capital efficiency
The first case holds margin at 4.14% but raises turnover to 3.40×. Revenue must reach approximately $129.29 billion. The assumption places a substantial burden on capital productivity: Tesla would have to generate considerably more sales per dollar of operating assets than it did in FY2025.
Investors following this route should examine whether facilities and working capital can support that improvement. Revenue growth accompanied by a similarly large increase in operating assets would limit the gain in turnover.
Margin and efficiency improvement
The second case combines a one-percentage-point margin increase with turnover of 2.60×. Required revenue is approximately $119.80 billion, close to the model’s FY2027 average revenue estimate of $121.68 billion.
This provides a useful operating checkpoint. Revenue near that level would need to arrive alongside the assumed margin and turnover. Reaching a sales estimate alone would not establish that the earnings goal had been met.
Greater reliance on margin
The third case assumes a 7.14% margin and turnover of 1.70×. Revenue of approximately $123.25 billion supports the selected residual earnings despite lower turnover than the FY2025 baseline.
Here, stronger profit per dollar of sales compensates for a larger capital requirement. The implied operating-capital denominator is approximately $72.50 billion, compared with $38.03 billion in the first case. This illustrates why the earnings contribution from a growing business must be assessed alongside the assets required to produce it.
Our Tesla stock forecast for 2030 examines the longer investment horizon. These 2027 combinations provide nearer-term checkpoints for the operating assumptions behind that outlook.
Ford needs a substantial margin recovery
Ford’s starting margin leaves less room for an investment case based on sales growth alone. The selected positive recovery cases require margin to rise from 0.55% to 4.55%, while turnover also improves.
We calculate these cases using the model’s $4.94 billion FY2027 pro forma residual operating income assumption. They are independently derived recovery scenarios using the model’s operating-driver inputs. All fit its broad FY2027 revenue interval of $171.57 billion to $193.70 billion.
| Ford FY2027 recovery scenario | PM after tax | ATO | RNOA | Required revenue |
| Higher revenue | 4.55% | 5.04× | 22.93% | $192.53 billion |
| Middle revenue | 4.55% | 5.44× | 24.75% | $182.17 billion |
| Higher turnover | 4.55% | 5.94× | 27.03% | $172.34 billion |
Source: Financial Beings calculations using the October 18, 2026 model inputs and a 10% capital charge. These positive recovery cases are separate from Ford’s exported fallback scenarios. They are not company guidance.
The middle case is particularly revealing. Its $182.17 billion revenue requirement is below Ford’s FY2025 revenue of $187.27 billion. Nevertheless, the assumed 4.55% margin and 5.44× turnover produce the selected positive residual earnings. The recovery depends heavily on earning more from each dollar of revenue and capital.
The required 4.55% margin is close to Ford’s 4.66% modeled margin in FY2022. That historical comparison provides context for the assumption, but does not establish that Ford can restore it by 2027. The turnover increases also need support from operating results.
Ford’s higher scenario RNOAs do not show that it is the superior investment. They describe stronger assumed recoveries from a weaker baseline. The Tesla and Ford tables also target different amounts of residual income, so they are not a ranking of expected shareholder returns.
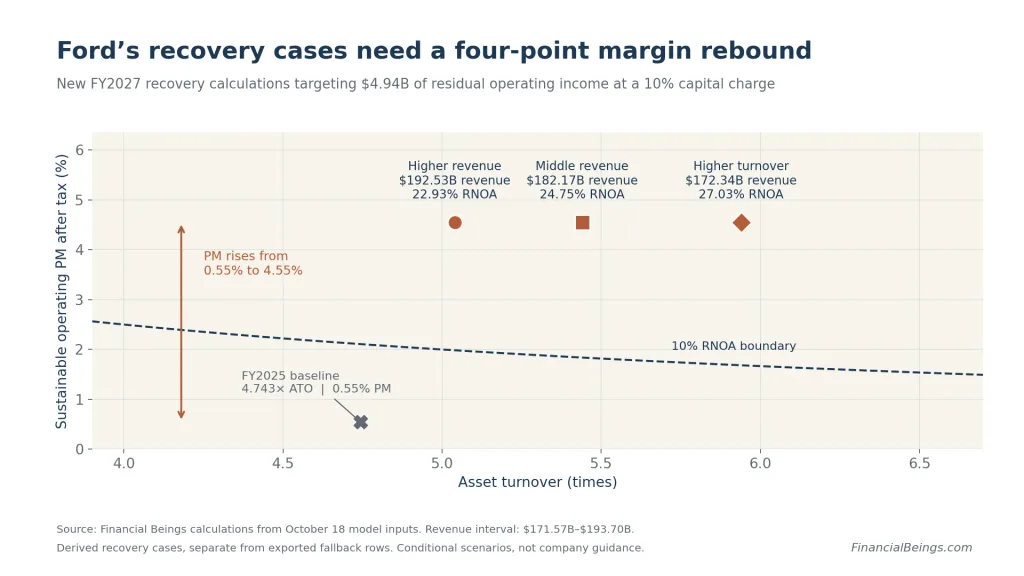
Figure 3. Every selected Ford case assumes a four-percentage-point margin rebound. Higher turnover reduces the revenue required to reach the selected earnings goal.
Revenue growth creates value only when returns support it
The relationship behind the scenarios can be written as:
Residual operating income = revenue × (PM – required return ÷ ATO)
PM and the required return are expressed as decimals in this equation. It shows why the same revenue can produce different economic outcomes depending on margin and capital intensity.
If a company expands while earning less than its required operating return, increasing sales at unchanged ratios can increase the earnings shortfall after the capital charge. Positive accounting profit and positive residual operating income are different tests.
In this analysis, a feasible combination means the arithmetic works and required revenue lies within the selected model bounds. Those bounds are screening assumptions rather than statistical confidence intervals. Demand, execution and access to capital determine whether a company can deliver the assumed outcome.
Is Ford stock cheaper than Tesla stock
Ford’s $12.43 share price looks modest beside Tesla’s $354.72 in the October 16 snapshot, but dollar share prices do not establish relative value. Share counts and the earnings represented by each share must also be considered.
The operating scenarios answer a narrower and useful question: what combinations could support a selected year’s residual earnings? Valuing the shares also requires an assessment of the earnings path beyond 2027, cash, financing obligations, dilution and the return investors require.
For Tesla, a convincing investment case must connect longer-term business opportunities with sustainable earnings after the capital required to deliver them. For Ford, it must establish that the assumed recovery can persist and support the price paid for the shares.
The evidence here supports Tesla’s stronger starting operating profitability and Ford’s greater dependence on margin recovery. It does not establish a reliable share-price target for either company.
Ford dividends offer income with a separate cash flow test
Ford declared a $0.15 regular dividend per share for Q3 2026. Continued for four quarters, that rate would annualize to $0.60 per share. At the dated $12.43 share price, the indicated annualized yield is approximately 4.83%, excluding supplemental dividends. Future payments remain subject to board approval. Source: Ford Q2 2026 earnings release.
Tesla states that it has never paid cash dividends on its common stock and does not anticipate doing so in the foreseeable future. Source: Tesla 2025 annual report.
Ford therefore offers the more direct income proposition. Assessing its durability requires a separate review of cash available for distributions and future capital needs. Consolidated cash flow that includes Ford Credit should not automatically be treated as automotive cash available to pay dividends.
What investors should watch next
For Tesla, examine whether margin improves alongside the capital needed to support growth. Stronger revenue with little improvement in turnover would place more weight on the margin assumptions. Improved utilization of operating assets would strengthen the case based on greater capital efficiency.
For Ford, look for sustained margin recovery and better turnover. A single improved quarter may be encouraging, but the selected scenarios require a substantial change from the FY2025 starting point. Separate recurring operating performance from accounting charges, and examine Ford Credit when assessing financing and cash generation.
Tesla has scheduled Q3 2026 financial results for October 21, after market close. Those results could change the analysis inputs. Production and delivery figures alone do not establish quarterly profitability. Source: Tesla Investor Relations. For another side-by-side view of two stocks on the same model, read our Nvidia vs Broadcom stock comparison.
Frequently asked questions
Which is the better buy Tesla or Ford stock in 2026
Tesla has the stronger FY2025 modeled operating return, while Ford pays a regular dividend. The better purchase depends on the price paid and confidence in future earnings. The selected Ford recovery cases require a larger margin improvement than Tesla’s cases.
Which company has higher asset turnover
Ford’s FY2025 modeled turnover is 4.743×, compared with Tesla’s 1.898×. Tesla nevertheless earns the higher combined operating return because its stronger margin offsets the lower turnover.
Can Ford improve without growing revenue
Yes, under the stated assumptions. The $182.17 billion Ford case reaches the selected residual-income goal with revenue below FY2025, because margin rises to 4.55% and turnover to 5.44×. Both improvements would have to be achieved.
Do the feasible combinations justify either stock price
They do not establish fair value. They show how selected operating assumptions can support an annual earnings goal within specified revenue bounds. A valuation requires the broader future earnings and financing assessment.
Methodology and sources
The analysis uses Financial Beings’ valuation model exported October 18, 2026, with a FY2025 reformulated operating baseline and FY2027 scenarios. PM is sustainable operating income after tax divided by revenue, including sustainable other operating items where classified as operating. Historical turnover and RNOA use prior-year net operating assets. Scenario capital is the consistent implied denominator, revenue divided by ATO. The assumed required operating return is 10%.
Tesla’s cases retain the model’s passing combinations. Ford’s positive recovery cases are newly calculated from its forward pro forma residual-income assumption; its original exported feasibility tables use an unsuccessful solver’s negative fallback path and have no passing rows. Full calculation references are retained in the accompanying research notes. All scenarios are conditional and rounded; no probabilities are assigned.
Quarterly reported revenue is sourced separately from the linked SEC filings. Model reformulations and estimates are Financial Beings calculations, rather than company-reported measures or management guidance. Share prices are dated observations, not live quotations. This article provides general investment research and does not assess an individual investor’s circumstances.