
TOPT stock isn’t outperforming the market it was created from. Over the year ending 30 June 2026, the fund returned 21.20%, while the plain old S&P 500 returned 22.28%. It’s a gap that is thin. But TOPT charges 0.20% a year to run — almost seven times what a basic S&P 500 fund costs. In sum, TOPT is worthwhile in the event that you make an intentional selection to put more money into just one or two large tech and chip stocks. It’s not a “safer, smarter” replacement for an index fund, because, at the moment, it’s not.
What Is the TOPT ETF?
An exchange-traded fund is sort of like a basket of stocks that you’re able to purchase and sell at the same time, like you do for Apple or Microsoft. TOPT is a BlackRock exchange-traded fund, known under the brand name iShares, which has only one thing on its list: the 20 largest companies in the S&P 500, the index of the U.S. stock market’s 500 largest public companies.
Here’s the fund at a glance, every number stamped with the date it was true:
| Detail | Figure |
| Launched | 23 October 2024 |
| Exchange | NYSE Arca |
| Tracks | S&P 500 Top 20 Select Index |
| Net assets | $655.4 million (31 July 2026) |
| Annual fee | 0.20% |
Just one note on housekeeping for those who are familiar with tech, the stock ticker is called “TOPT” and is unrelated to the tech term “TOTP” for a temporary login code generated by your phone. It’s also not a sibling fund like QTOP, which does the same ‘top 20’ thing but for the Nasdaq-100 as opposed to S&P 500. A third look-alike is a fund listed in Japan on the Tokyo exchange (ticker 313A), that tracks this exact same index. There are four names, four different things.
Why Does a “Top 20” Fund Hold 21 Stocks?
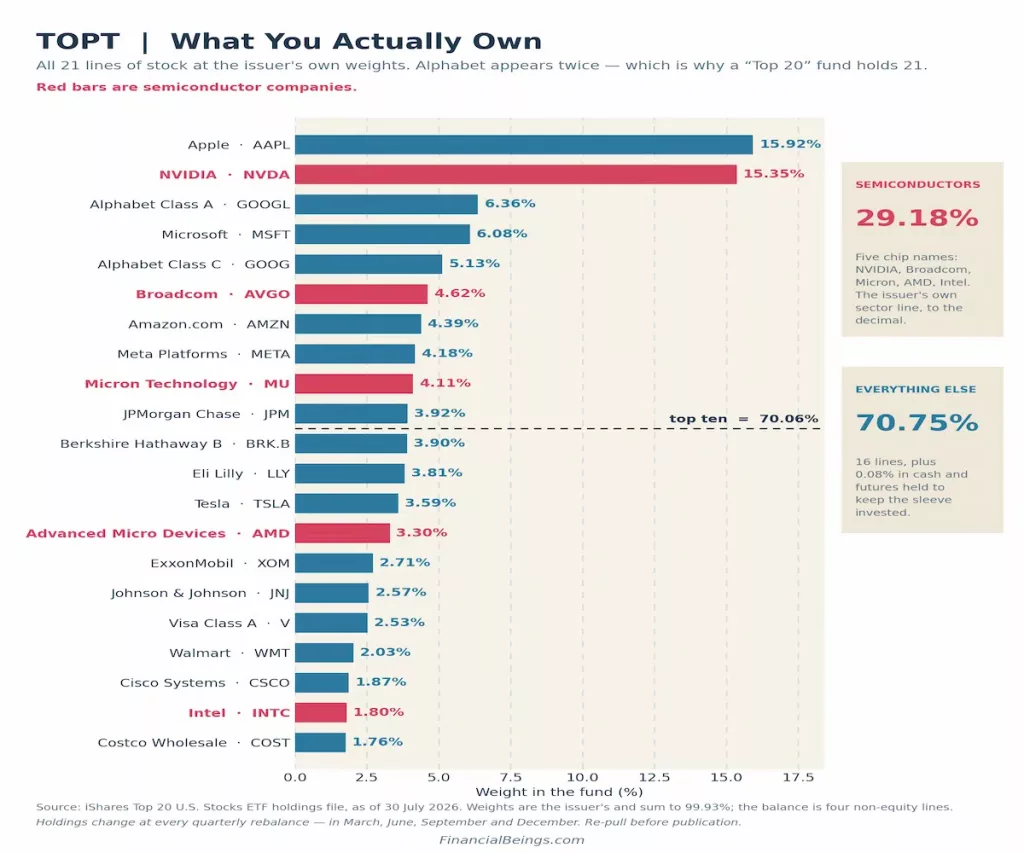
Here’s a little quirk that gets people when they show up on the holdings list: a “Top 20” fund that has twenty-one lines of stock. It isn’t padding nor is it a mistake. Google’s Alphabet is on the list twice.
There are two types of stock in Alphabet, namely Class A and Class C, and both are included in the index separately. Class A carries a weight of 6.36%, Class C sits at 5.13%. Neither line is that big individually, but add them all up and it turns out that Alphabet is TOPT’s third largest position with 11.49%.
There’s a second catch in here that is bound to surprise a lot of financial data websites. Some of them say that TOPT has 25 holdings, and not 21. This is because they also have four small non-stock lines — a cash holding, a Treasury money-market fund, a cash-collateral line and a few futures contracts all behind the scenes to ensure that spare cash is not sitting idle. All four of them combined make for less than 0.1% of the fund. If you are looking at 25 holdings, don’t expect 25 stocks.
Is TOPT Beating the S&P 500?
This is the question that actually matters, and the honest answer is no over the past year. However, the “no” is the more interesting part; the actual timing of the gap opening.
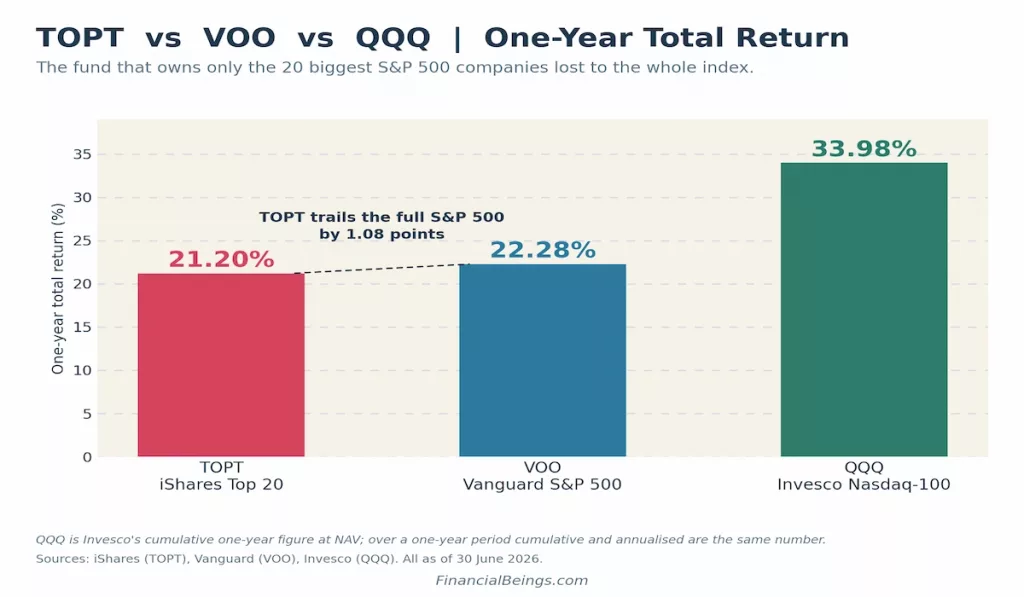
Over the twelve months to 30 June 2026, here’s how the three most-compared funds stacked up:
| Fund | 1-Year Return |
| TOPT (iShares Top 20) | 21.20% |
| VOO (Vanguard S&P 500) | 22.28% |
| QQQ (Invesco Nasdaq-100) | 33.98% |
The full S&P 500 was up approximately one point and the Nasdaq-100 was up by a lot more points. That’s due to part of it being simple math: the fees charged by TOPT are 0.20% per year, while the fees charged by VOO are 0.03% per year. That’s a significant portion of the deficit, but not the whole one, over the past 12 months. For a deeper look at how a low-cost index fund stacks up against a total-market option, see our VTSAX vs VOO comparison.
However, the narrative becomes more focused if you focus in on 2026 in particular. At the mid-point of the year, TOPT was just a little bit lagging; it gained 5.73% compared with VOO’s 10.19% for the year through the first 6 months.
A genuine, though not an extreme, difference. Then July happened. TOPT’s YTD return had gone backwards by the end of July, to 3.98% while VOO barely changed at 10.12%. The difference increased by almost 40% in four weeks. TOPT was not only underperforming in July but it was regressing as the market was standing still.
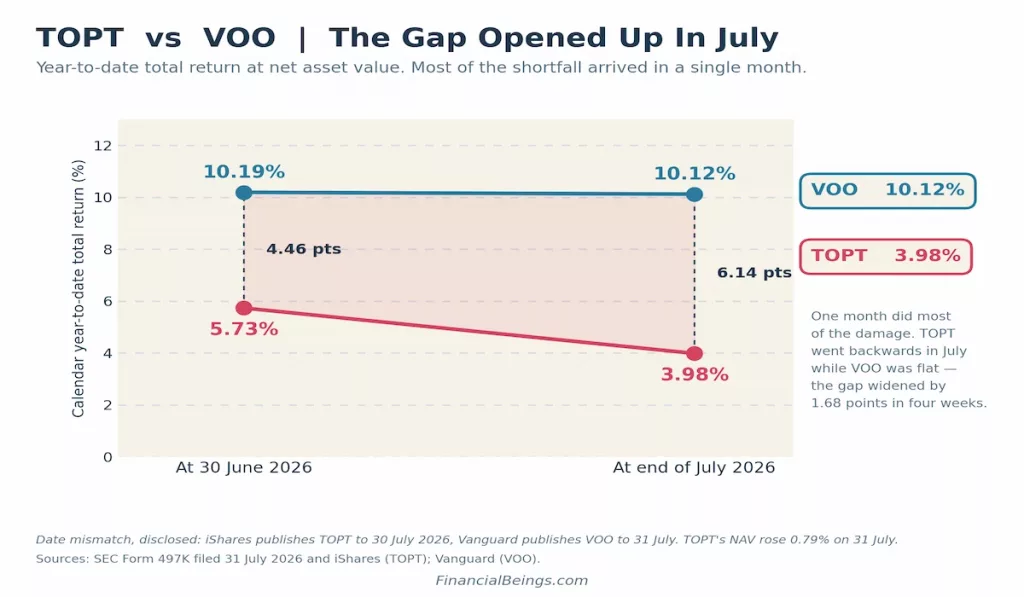
The one month is more important than any other fact in this review, because it helps to debunk the narrative that has been going around since the dawn of TOPT that owning only the biggest winners means you keep on winning. It was for a time held up. Then it stopped.
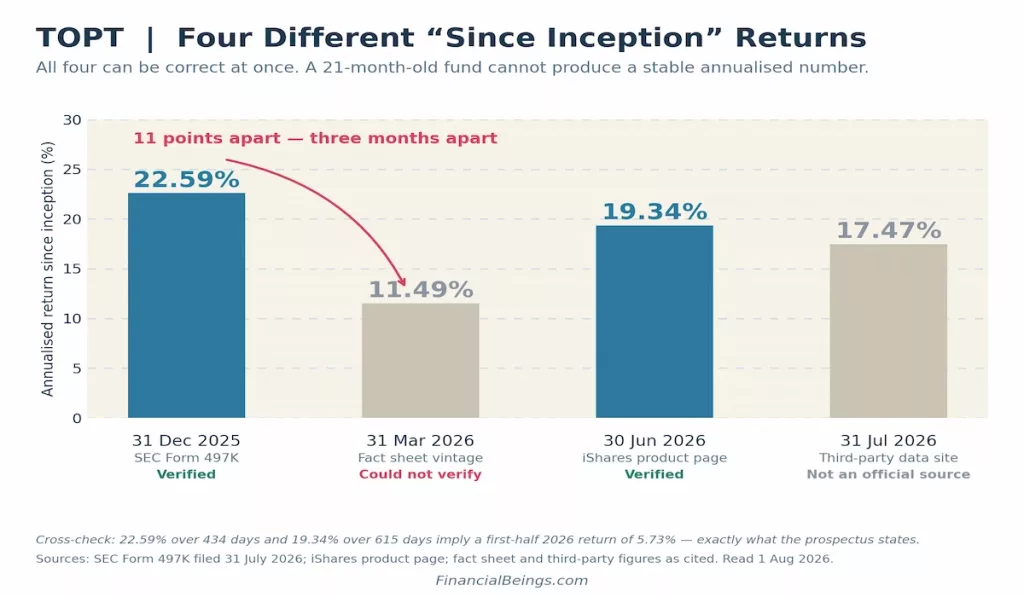
One more warning, in case you are tempted to check out TOPT’s performance for yourself: there are a couple of different “since inception” return figures out there, and they can vary wildly from a 22.59% annualized return at 31 December 2025 to a 19.34% annualized return at 30 June 2026. It is possible for both to be correct.
TOPT is a young fund, only just under two years old, so annualized returns vary greatly based on just what period of time you are calculating from. A number that isn’t supported by a definite date should not be considered a “since inception” number. When it doesn’t say, it doesn’t mean very much!
What Are You Actually Buying?
TOPT is a mega-cap fund, marketing itself as one based around the largest companies in America. That’s technically true. But, let’s get deeper into the numbers and a more specific story emerges: TOPT is, fundamentally, a wager on semiconductors.
There are five companies that make up almost a third of the fund, as a whole: Nvidia, Broadcom, Micron, AMD and Intel. It’s not a “best guess” of how many semiconductors the fund has in its portfolio; it’s simply the actual number the fund makes public for the semiconductor sector weighting. Almost one-third of the value in a 21-stock fund is in one of just five chipmakers.
This information directly relates to July’s slide. Semiconductor stocks were rough at the end of July 2026 and TOPT is loaded with the stocks in that sector.
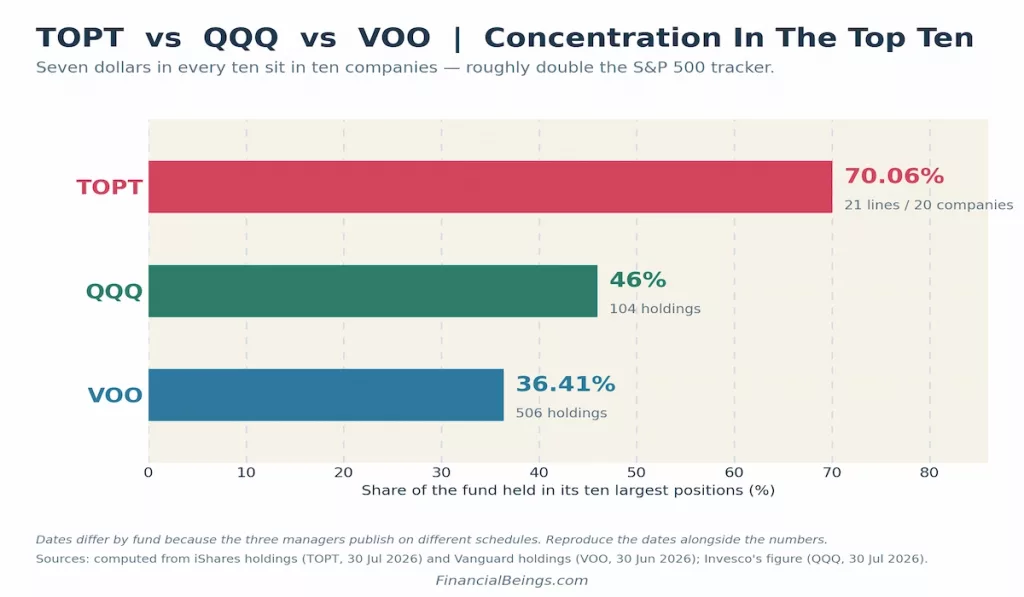
The concentration doesn’t stop at semiconductors, either. Look at how much of each fund sits in just its ten largest positions:
| Fund | Top-10 Weight |
| TOPT | 70.06% |
| QQQ | 46% |
| VOO | 36.41% |
Ten companies hold seven out of 10 dollars in TOPT. That figure is nearer to three and a half dollars in VOO. The true risk and reward of TOPT stock is that it’s not as dispersed as it could be and it’s more about a few big winners.
How Often Does TOPT Rebalance?
TOPT is not a “buy it and it will remain unchanged” fund. It is rebalanced four times a year (March, June, September and December), which means that it assesses and/or adjusts the list of companies included in the underlying index.
Four companies exited the fund from end 2025 to end-Jul 2026, and were replaced by 4 new companies. Those that exited were Mastercard, Palantir Technologies, AbbVie, and Netflix. They were replaced by Micron Technology, Advanced Micro Devices, Cisco Systems and Intel. There is a trend: Three out of four newcomers are chip companies. That’s how the semiconductor concentration described above comes about, not by chance; it comes about by rebalance.
The amount of turnover in this relatively straightforward index fund is unusually high. The share of TOPT’s portfolio that is turned over in a year is 27% (portfolio turnover). VOO’s is 2.4%. TOPT has a much higher frequency of changes than a normal S&P 500 tracker.
There is something that is to be known of a rule as well, for it explains what is likely to follow. The fund’s own legal prospectus, which sets out how the fund must run, limits any one company’s representation to 22.5% of the index, and includes a limit that any one collection of companies weighted more than 4.5% at each rebalance combined may not exceed 48% of the fund. However, between rebalances, prices fluctuate and those weights could end up exceeding the cap.
That’s what has transpired so far, as of 30 July 2026. Apple sits at 15.92%, NVIDIA at 15.35%, Alphabet (both share classes combined) at 11.49%, Microsoft at 6.08%, and Broadcom at 4.62%. If you add them all up, that group is at about 53.5%, which is about five and a half percentage points above the 48% cap the fund is meant to meet once every quarter.
In short: the fund is running a little more top-heavy than its rulebook would allow between rebalances, and the next rebalance in September will likely cut those biggest positions back down unless the gap narrows on its own first.
Is the 0.20% Fee Justified?
The expense ratio is just the percentage of an investment that a fund uses in order to pay its expenses. TOPT’s is 0.20%. VOO’s is 0.03%. Both on paper look rather small either way. Based on the same example from the fund, if you invest $10,000 you can expect to spend about $20 in year one and about $255 over ten years. The same length of time for VOO would be a fraction of that.
It is not so much the question of whether 0.20% is expensive, but rather that it is very inexpensive by almost any historical standard. The fair question is: What are you getting for that price that you are paying that is different? And the answer is a partial one. TOPT’s top holdings are quite a bit like VOO’s top holdings, as both are taking from the same pool of giant American companies.
But if you’re looking for concentrated exposure to a few mega-cap and semiconductor stocks, then TOPT delivers that with a single ticker. When you’re looking for a broad, low-cost core holding, you’re paying extra for something that you could almost duplicate — minus the semiconductor tilt — within a standard S&P 500 fund at a much lower cost.
Verdict: Who Should Own TOPT?
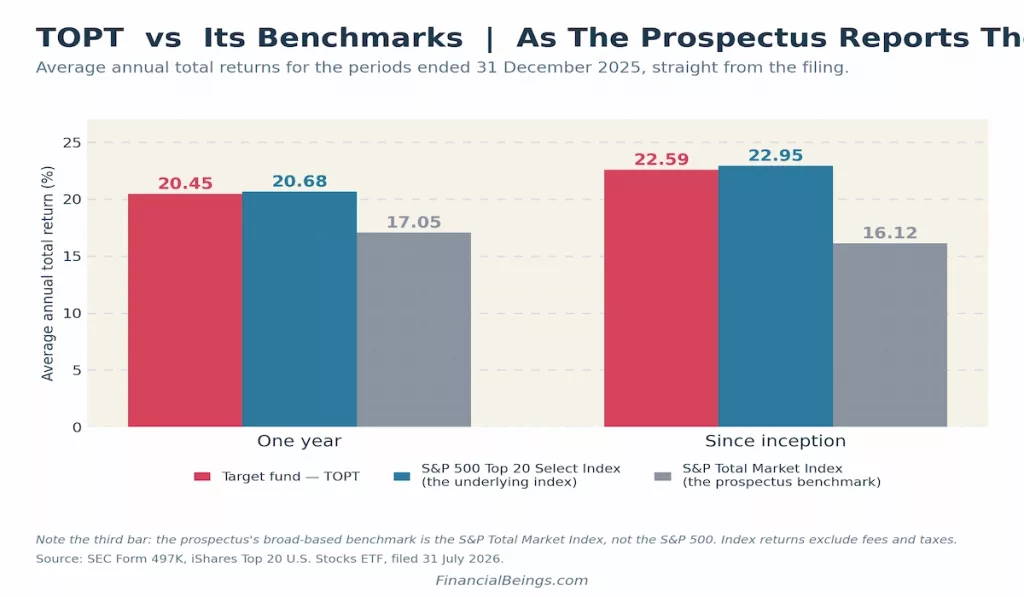
As a conscious satellite bet, TOPT stock is a vehicle for some folks to increase their exposure to the mega-cap and chip-sector portfolios they already own. It doesn’t make sense as a core holding for all things, and it doesn’t even make sense now as a way to “beat” the S&P 500 with fewer stocks, as the numbers over the past year indicate.
For those who already have a wide S&P 500 index or total-market index fund and are specifically looking for concentrated gains in a few dominant tech and chip stocks, TOPT provides a clear and reasonable way to achieve that — with an understanding of the higher expense, and the volatility that can be associated with it.
This is not for the person looking for a cheap and easy investment base. That’s the same job that VOO, the larger and more affordable index fund, already does.
FAQ
Is TOPT ETF a good buy?
Only as a conscious move to get the mega-cap. TOPT trailed the S&P 500 over the year to 30 June 2026 — 21.20% against 22.28% — while charging 0.20% a year versus 0.03%.
What stocks make up TOPT?
Twenty-one lines of stock in 20 companies. Apple (15.92%) and NVIDIA (15.35%) lead. Alphabet is counted twice, as Class A and Class C. Weights as of 30 July 2026.
Does TOPT pay a dividend?
Yes, quarterly. The twelve-month trailing yield was 0.38% at 30 June 2026, and the 30-day SEC yield was 0.29%.
Is TOPT better than VOO?
There’s no record of that yet. TOPT has 21 lines to VOO’s 506 stocks over the last year and year to date, and is about seven times more expensive to own.
How often does TOPT ETF rebalance?
Quarterly, March, June, September and December. During the period from 31st December 2025 to 30th July 2026, 4 companies left the fund and 4 companies entered it. The reported portfolio turnover was 27%.
How does TOPT compare to QQQ?
QQQ won comfortably: 33.98% over the year to 30 June 2026 against TOPT’s 21.20%. QQQ also cost less, at 0.18% versus 0.20%, and holds 104 positions.
