
Maria is 54. She’s not a trader. She reviews her retirement account once a month, typically at night with a cup of coffee. One evening, she typed in “Eli Lilly stock forecast 2030” into a search bar, since Lilly is her largest stock holding and she was curious about whether she could remain calm or become alarmed.
What she found didn’t help. According to one site, Lilly’s stock price will reach $4,832 by 2030. Another released the same week said $1,071. Same company. Same day. An increase of over four and a half times. No one was explaining why two intelligent-sounding predictions should be so far off, and that distance was what made Maria uneasy. What will she do with her own money if the experts can’t agree on it within a factor of 4?
The good news is that there is no real debate about whether Lilly’s drugs will keep selling. Nearly all predictions are based on Lilly making more money. The true argument that no one voices aloud comes down to one number: how many times its 2030 earnings the stock should be worth. This is where the wild spread in any Eli Lilly stock forecast for 2030 begins to make a lot of sense.
The Number Nobody Names
Right now, Lilly trades at $1,189.41 a share (as of the New York Stock Exchange close on August 26, 2026). That price has a story behind it: how much bigger and more profitable Lilly will be.
One idea is required to view that story: the multiple. A stock’s price-to-earnings ratio (P/E) shows how many dollars investors are willing to pay today for each dollar a company earns per year. When a stock is priced at 20 times earnings, the investor is paying $20 for every $1 that the firm currently earns per share, based on the assumption that the firm’s earnings will continue to increase.
Divide each of those 13 published 2030 targets by a reasonable estimate of what Lilly might earn per share in 2030; let’s use $62.86, our own estimate based on Wall Street’s 2027 figures, since Lilly doesn’t project so far out. That math results in multiples from 17 times to 77 times. Here’s the true disparity. The explanation was within our grasp all along.
But here’s the kicker: Lilly’s share price only has to be around 18.9 times earnings by 2030 to break even (with no gain, no loss). Some of those bottom-of-range predictions are NOT bad news for Lilly’s business. They’re merely doing lots of mathematics, very straightforward.
| Metric | Value |
| Current price (Aug 26, 2026 close) | $1,189.41 |
| Published 2030 target range | $1,071 – $4,832 |
| Spread (high ÷ low) | 4.5× |
| Implied 2030 P/E range | 17× – 77× |
| Break-even 2030 P/E (no gain, no loss) | 18.9× |
| House 2030 EPS estimate | $62.86 |
Why the Estimates Are So Far Apart
Why is it that so many websites aren’t anywhere near the 18.9× break-even math? Most are not predicting the future of Lilly’s business, they’re projecting the stock price.
One popular forecasting website simply extrapolates the stock price, just like you’d take a rubber band and try to guess where it will bounce back. Another site goes so far as to say it has no multi-year financial model for Lilly; it’s just an approximation, no engine behind it. A third site has the same numbers listed for 2028 in two different tables, indicating that someone didn’t bother to double check before pressing publish.
None of this means those sites are lying. Just another way of saying their “forecasts” are extrapolations in disguise. That is the second thing that any forecast of the price of Eli Lilly stock in 2030 should have you do before taking it on faith: consider the multiple that it assumes and ask if the site shows its work.
What the Price Is Actually Betting On
Let’s do our own reality check not with a chart, but with the accounting that Lilly reports.
Begin by reading the two ways to assess the value of a company. The “unlevered” read focuses on the business as it is, without debt taken into account — imagine a lemonade stand without considering how well the lemonade mix tastes. The “levered” read is the number we know from the stock market — debt is added back, and this is the number we pay per share.
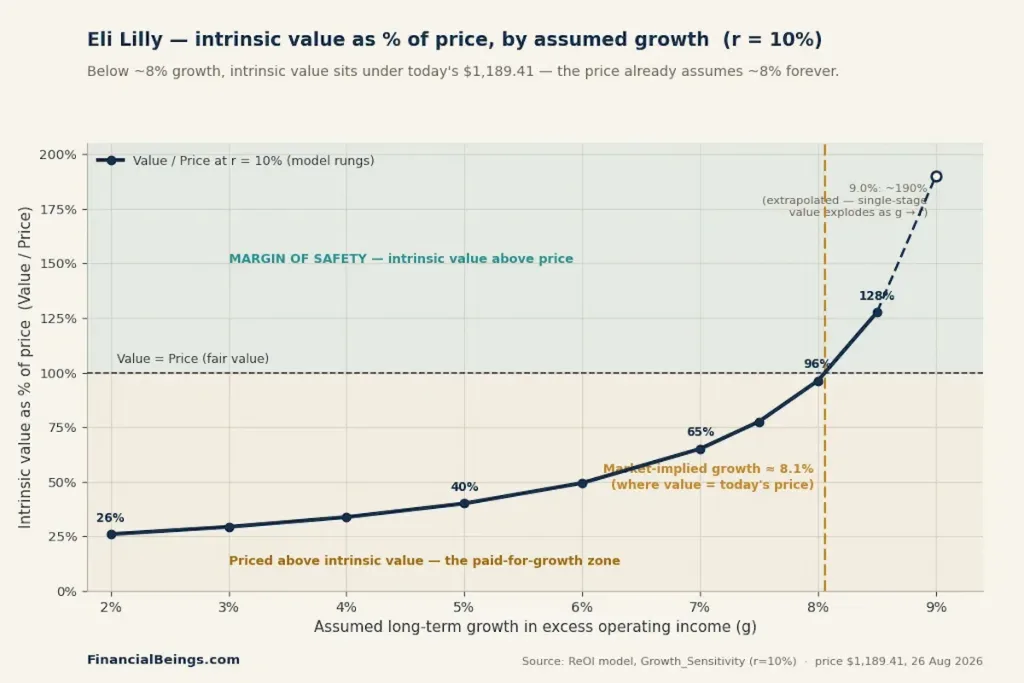
On an unlevered basis, Lilly trades at approximately 44.9 times operating earnings and the price suggests the company’s operating earnings above a “cost of capital” charge will continue to grow at approximately 8.2% year-in, year-out. While not all headlines mention it, that’s the 8.2% that’s actually being debated in every Eli Lilly stock forecast 2030 headline.
| Basis | Multiple | What it implies |
| Unlevered (EV ÷ NOPAT) | 44.9× | ~8.2% perpetual growth in excess operating income |
| Equity, forward (price ÷ 2026 guidance EPS) | 33.0× | The familiar headline multiple, after debt is layered back in |
| Earnings-per-share path | Value |
| FY2026 guidance EPS | $36.00 |
| FY2027 Street consensus EPS | $47.23 |
| FY2030 house estimate EPS | $62.86 |
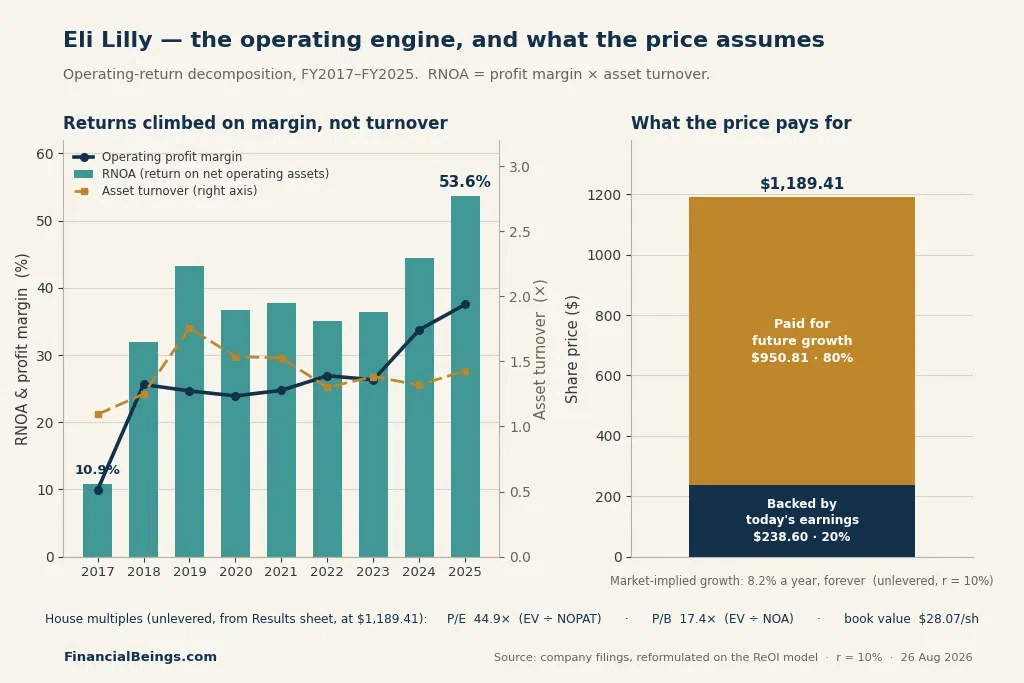
Now divide the price into 2 parts. Only approximately $238.60 (about 20%) of the $1,189.41 is supported by the earnings that Lilly is generating today. The $950.81 difference is the market expectation of growth that hasn’t yet occurred, or about 80% of the whole share price.
| What you’re paying for | Per share | % of price |
| Backed by today’s earnings | $238.60 | ~20% |
| Paid for future growth | $950.81 | ~80% |
| Total price | $1,189.41 | 100% |
Is that crazy? Not necessarily. Check out the performance of Lilly’s operating engine. A related metric, operating return (profit per dollar invested in the business), jumped from 10.9% in 2017 to 53.6% in 2025. This is nearly five times as much. That rise was almost entirely due to a fatter profit margin (9.9% of sales up to 37.5%) and not because factories and equipment were used more, which hardly changed.
In layman’s terms: Lilly did not become busier. It became much more profitable per sale, in large part due to Mounjaro and Zepbound. We break down this same operating-return comparison between two other pharma giants, AbbVie and Johnson & Johnson Stock, if you want to see how Lilly’s numbers stack up against the sector.
| Fiscal Year | Revenue ($B) | Profit Margin | Asset Turnover | Operating Return (RNOA) | Excess Operating Income ($B) |
| 2017 | 19.97 | 9.9% | 1.09× | 10.9% | 0.15 |
| 2018 | 21.49 | 25.6% | 1.25× | 32.0% | 3.79 |
| 2019 | 22.32 | 24.7% | 1.76× | 43.3% | 4.23 |
| 2020 | 24.54 | 23.9% | 1.54× | 36.7% | 4.27 |
| 2021 | 28.32 | 24.8% | 1.53× | 37.8% | 5.15 |
| 2022 | 28.54 | 26.9% | 1.30× | 35.0% | 5.49 |
| 2023 | 34.12 | 26.3% | 1.38× | 36.4% | 6.51 |
| 2024 | 45.04 | 33.8% | 1.32× | 44.5% | 11.79 |
| 2025 | 65.18 | 37.5% | 1.43× | 53.6% | 19.90 |
As the table above illustrates, the company’s “excess operating income”… This is a tangible motor, not a narrative. Lilly now ranks among the largest healthcare companies by market capitalization — a position earned through margin expansion, not financial engineering.
However, there’s an Honesty Check that’s worth taking. Revenue growth ranges between an 11.7% gain and a 15.3% gain annually in order to achieve our $62.86 2030 estimate, all else equal. For a company like Lilly, that’s not impossible given its pipeline. However, it is challenging, and it takes for granted that nothing really goes wrong in the process.
Selling More, or Charging More?
But, if you fear that Lilly is simply inflating figures to boost its sales, the data shows otherwise at least for now. Lilly’s drug volume increased by 60% across all markets in the 2Q26, but the selling price of drugs collected by Lilly dropped by 13%. In the U.S., realized prices declined approximately 3 percent (or 9 percent excluding rebates and discounts).
Prices outside the U.S. dropped a whopping 36%, primarily due to China’s government reimbursement rates for Lilly’s drugs, which have been lowered, and not because of any U.S. pricing agreement you may have heard about.
Translation: It is not squeezing existing patients harder, but rather putting more of the drugs into circulation. That’s healthy growth and it correlates with those profit margins that increased above.
The Clock Is Ticking on Some Products
As with any growth story, there are no guarantees, and Maria’s real question — will this still be the case in four years? — should be answered head-on.
Between now and 2030, four Lilly products go off patent in the U.S. Cyramza in 2026, Trulicity in 2027, Jardiance in 2029, and Taltz in 2030. Those drugs accounted for approximately 17% of Lilly’s 2025 revenue, combined. To top it off, two drugs, Trulicity and Verzenio, are among those the U.S. government will price for Medicare, starting January 1, 2028, cutting into what Lilly makes on them in the domestic market.
| Product | Event | Year |
| Cyramza | Loses U.S. patent exclusivity | 2026 |
| Trulicity | Loses U.S. patent exclusivity | 2027 |
| Trulicity & Verzenio | Move to government-set Medicare prices | Jan 1, 2028 |
| Jardiance | Loses U.S. patent exclusivity | 2029 |
| Taltz | Loses U.S. patent exclusivity | 2030 |
| Tirzepatide (Mounjaro/Zepbound) | U.S. data protection lapses | 2027 |
| Tirzepatide (Mounjaro/Zepbound) | Core U.S. compound patent expires | 2036 |
The bright side for Lilly’s most promising candidate: The patent for tirzepatide, the drug in Mounjaro and Zepbound, extends through 2036 in the U.S. A separate legal shield, its “data protection,” runs out in 2027, which is significant but not as impactful as losing the entire patent. For a side-by-side look at how Lilly’s patent cliff compares to its closest rival, see AbbVie vs Eli Lilly Stock 2026.
Reading the Room Before You Read the Numbers
As with a stranger’s calculation, before believing any Eli Lilly stock forecast 2030 value you see on the web, it is advisable to verify its source. Several of the sites that come up highest on this exact search are having issues.
One of the more popular ones is repeating the exact same column of numbers for 2027 and 2028, with no one noticing the mistake. Another calls its own internal spreadsheet outputs “real analyst price targets.” A third simply says that Lilly doesn’t pay a dividend, which is untrue: It does, and it has been doing so for years. None of these is in bad faith for the sites.
It simply means that “published” does not equal “checked.” The same pattern shows up in UnitedHealth’s intrinsic value forecasts too — different company, same sloppy math.
Three Honest Roads to 2030
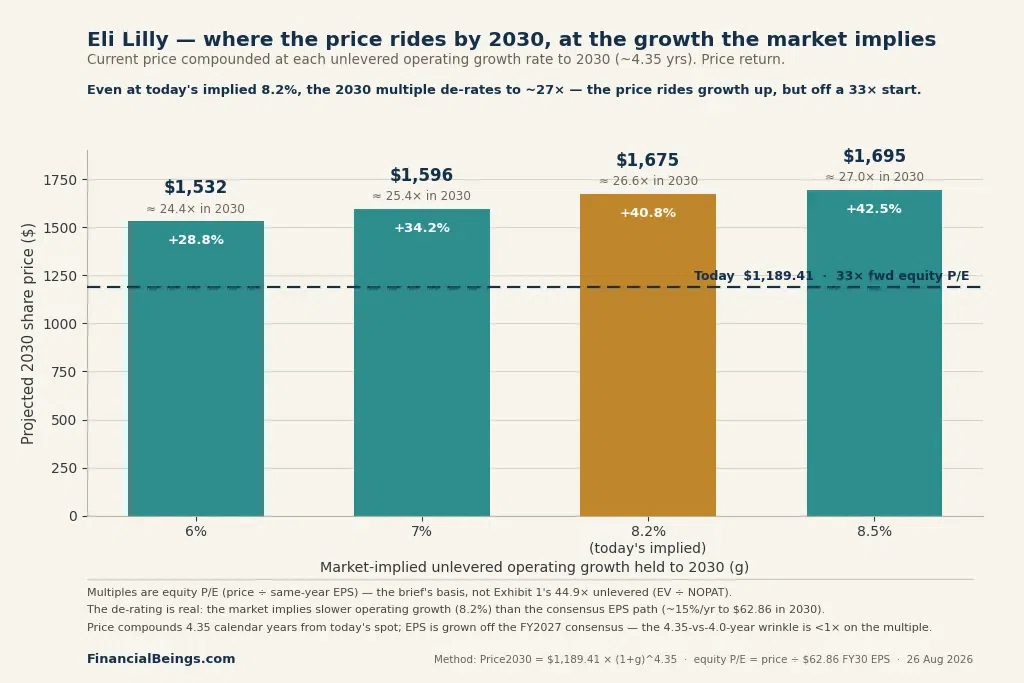
So, how about Maria (and you)? No one can give a guaranteed number for 2030. However, we can spell out the outcomes for varying, distinctly labelled growth scenarios, and apply the same 10% required return to which Lilly must aspire.
| Scenario | Assumed growth rate | Projected 2030 price | Cumulative gain | Annualized return (incl. dividend) |
| Conservative | 6.0% | $1,532 | +28.8% | ~6.6% |
| Balanced-Growth (today’s implied rate) | 8.2% | $1,675 | +40.8% | ~8.8% |
| Above-implied | 8.5% | $1,695 | +42.5% | ~9.1% |
The required-return hurdle is set at 10% for all scenarios, compounding the current price of $1,189.41 (as of December 31, 2030 ~4.35 years).
Frequently Asked Questions
What is Eli Lilly’s stock price forecast for 2030?
Published targets range from $1,071 to $4,832, which works out to 17 times to 77 times a $62.86 2030 earnings estimate. At a 25× multiple, Lilly would sit around $1,571 about 6.6% a year in gains from today’s $1,189.41.
Is Eli Lilly stock overvalued at 33 times earnings?
All depends on 2030 earnings materializing. The break-even multiple is only 18.9×, suggesting that the price could see a multiple de-rating of 43% and still be a breakeven situation for investors if Lilly beats the current consensus estimates for 2027.
Will Eli Lilly stock reach $2,000 by 2030?
To reach $2,000, it would take about a 31.8 times multiple of 2030 earnings which is about equal to the current 33 times multiple. One of the more realistic of the higher forecasts out there, but it assumes the stock’s rich multiple barely moves over four years, which is an assumption, not a certainty.
Does Eli Lilly pay a dividend?
Yes. Lilly currently pays a dividend yielding 0.58% based on today’s price, or $1.73 a quarter and $6.92 a year; the dividend has been frozen from 2009 to 2014, but has been raised for 12 consecutive years. For more dividend-focused picks, check our best dividend stocks to buy guide, or the highest dividend paying stocks list.
When do Eli Lilly’s patents expire?
Tirzepatide’s main U.S. patent is set to expire in 2036, with its separate data-protection exclusivity ending in 2027. U.S. exclusivity also ends for Cyramza, Trulicity, Jardiance, and Taltz, combined making up approximately 17% of 2025 revenue, between 2026 and 2030.
Will Medicare price negotiation affect Eli Lilly before 2030?
Yes. Trulicity and Verzenio are slated for negotiation in January 2026, and will begin the process of transitioning to government-negotiated Medicare pricing on January 1, 2028.
References
-
Eli Lilly Investor Relations. “Lilly Reports Fourth-Quarter 2025 Financial Results and Provides 2026 Guidance.” February 4, 2026.
investor.lilly.com
Source for: FY2025 revenue of $65.18B; the 33× multiple on 2026 guidance EPS. -
Eli Lilly Investor Relations. “Lilly Reports Second-Quarter 2026 Financial Results, Raises Full-Year 2026 Guidance.” August 5, 2026.
investor.lilly.com
Source for: volume +60% / realized price −13%; U.S. realized price −3%; ex-U.S. realized price −36% (driven by China). -
Eli Lilly Investor Relations. “Dividends & Stock Splits.”
investor.lilly.com
Source for: $1.73/quarter dividend, $6.92 annualized, 0.58% yield, 12 consecutive years of increases, 2009–2014 dividend freeze. -
U.S. Securities and Exchange Commission. Eli Lilly and Company, Form 10-K for fiscal year 2025, Items 1 & 1A. Filed February 12, 2026.
sec.gov
Source for: patent expiration timeline (Cyramza, Trulicity, Jardiance, Taltz; tirzepatide core patent 2036, data protection 2027); ~17% of 2025 revenue tied to expiring products; operating-return decomposition financials. -
Centers for Medicare & Medicaid Services. “CMS Announces Selection of Drugs for Third Cycle of Medicare Drug Price Negotiation Program.”
cms.gov
Also see: Centers for Medicare & Medicaid Services. “CMS Announces Manufacturer Participation in Third Cycle of Medicare Drug Price Negotiation.” March 13, 2026. cms.gov
Source for: Trulicity and Verzenio moving to government-set Medicare prices effective January 1, 2028. -
StockAnalysis.com. “Eli Lilly and Company (LLY) Stock Overview.”
stockanalysis.com
Source for: live share price of $1,189.41; FY2027 consensus EPS of $47.23 used to derive the $62.86 2030 house estimate.
