

Advanced Micro Devices (AMD) closed at $552.90 on November 11, 2026, and that price is the starting point for this AMD stock forecast. Four providers showed price targets ranging from $596.74 to $658.53 the next morning. A $650 target implies a multiple of 36.74× the FY2027 consensus estimate of $17.69 in adjusted earnings per share. At 30×, AMD would need to earn $21.67 per share to reach $650. (Historical close · Consensus EPS)
AMD Stock Forecast: The Quick Answer
The four published targets were about 8% to 19% above the November 11 close.
A price target is an analyst’s estimate of where a stock could trade at a stated horizon, typically 12 months.
The lowest individual target shown is $260. The highest is $1,250. Provider ratings for the stock range from “Moderate Buy” to “Strong Buy.”
The FY2027 consensus of $17.69 in adjusted earnings per share (EPS) is more than double the FY2026 estimate. If AMD misses that estimate, reaching $650 would require a higher multiple.
The published targets imply 33.73 to 37.23 times FY2027 adjusted EPS.
We use the same $17.69 adjusted EPS forecast for FY2027 to compare all four providers’ targets. The price reference is $552.90 from the November 11 close.
Why Do AMD Price Targets Differ From Site to Site?
Each site will have a different set of analysts in its average and a different time frame. That is, the “consensus” can shift by a few percent even if not one analyst’s opinion has shifted.
Here’s what four major sites showed on November 12, 2026, before U.S. trading:
| Provider | Analysts | Rating | Published target | Low–high | Upside | Implied FY2027 P/E |
| Public.com | 38 | Buy | $596.74 | Not shown | 7.93% | 33.73× |
| MarketBeat | 43 | Moderate Buy | $642.47 | $260–$1,250 | 16.20% | 36.32× |
| TipRanks | 32 | Strong Buy | $650.41 | $540–$800 | 17.64% | 36.77× |
| Stock Analysis | 53 | Strong Buy | $658.53 | $525–$1,250 | 19.10% | 37.23× |
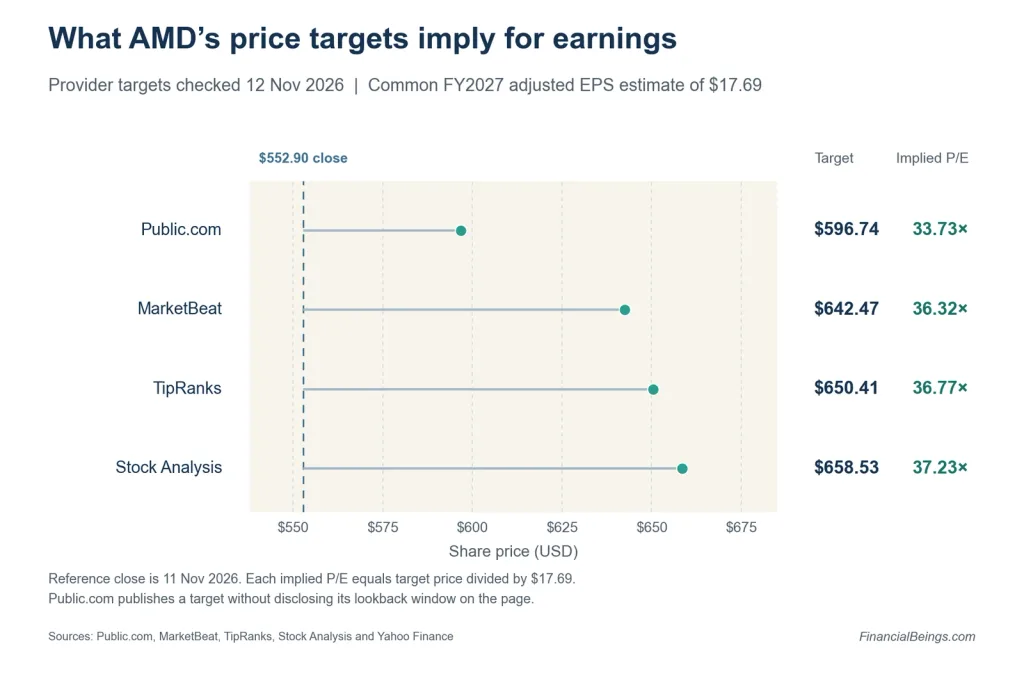
Why the gap? Mostly timing. MarketBeat averages the latest eligible target from each analyst over a 12-month window. Its $260 low dates to April 27. TipRanks only recognizes the last three months of targets. Stock Analysis uses S&P Global’s data. Public.com does not reveal its lookback window.
The labels are also different. Stock Analysis and TipRanks show “Strong Buy,” MarketBeat shows “Moderate Buy,” and Public.com shows “Buy.”
Public.com showed “0.00%” upside next to a $596.74 target. Against the November 11 close, the upside is 7.93%. 24/7 Wall St. placed its own $541.16 estimate and Hold rating next to a separately reported $657.49 Street average. (Public.com forecast · 24/7 Wall St. forecast)
What Is AMD Itself Guiding for 2026 and 2027?
AMD anticipates $17 billion in Q4 2026 sales and expects sales to be over 80% higher in 2027. AMD expects its Data Center segment to drive most of that growth.
AMD reported its third-quarter results after the market closed on November 3. (AMD Q3 earnings release · Earnings call transcript)
| Q3 2026 (actual) | Q4 2026 (outlook) | 2027 (management outlook) | |
| Total sales | $13.4B, up 45% YoY | About $17B (±3%) | Growth above 80% YoY |
| Data Center | $8.5B, up 97% YoY | Up about 50% from Q3 | More than 80% of total sales |
| Client and Gaming | $3.7B, down 8% YoY | Down more than 20% from Q3 | — |
| Adjusted EPS | $2.09 | — | — |
The new product items mentioned by CEO Lisa Su and CFO Jean Hu were Instinct MI450 AI chips, full Helios server racks and the next-generation EPYC “Venice” processors. They also predicted that server sales will roughly double year over year in 2027.
Analysts forecast sales of $52.23 billion in FY2026 and $95.86 billion in FY2027. That’s 83.5% growth. (Analyst estimates)
The vulnerability is Client and Gaming, which includes PC and console chips. Gaming revenue alone fell 40% year over year in Q3.
What Earnings Multiple Does Each Forecast Imply?
At $17.69 in expected FY2027 adjusted EPS, a $650 target implies 36.74× earnings. At 30×, AMD would need to earn $21.67 a share, up 22.5% from analysts’ estimates.
Two quick definitions. Earnings per share (EPS) is the amount of profit per share of a company. AMD’s “adjusted” EPS leaves out certain costs, such as stock-based pay and acquisition charges. Price/earnings ratio (P/E): It is the share price divided by the EPS. Forward P/E uses expected EPS for a specified future period.
Analysts expect adjusted EPS of $8.08 for 2026 and $17.69 for 2027. That’s growth of 118.9%. At $552.90, AMD traded at 68.43× estimated FY2026 adjusted EPS and 31.25× estimated FY2027 adjusted EPS.
Now, the key test:
| If investors pay… | AMD’s price at $17.69 EPS | EPS needed to hit $650 |
| 25× | $442.25 | $26.00 |
| 30× | $530.70 | $21.67 |
| 35× | $619.15 | $18.57 |
| 40× | $707.60 | $16.25 |
The break-even test holds AMD’s share price at $552.90 and varies EPS growth from the $8.08 FY2026 estimate.
| FY2027 EPS growth | FY2027 adjusted EPS | P/E to hold $552.90 |
| 50% | $12.12 | 45.62× |
| 75% | $14.14 | 39.10× |
| 100% | $16.16 | 34.21× |
| 118.9% (consensus) | $17.69 | 31.25× |
How about the $1,250 high target? It implies 70.66× estimated FY2027 adjusted earnings.
AMD Stock Forecast 2027 to 2030: What Growth Is Already in the Price?
At the November 11 close, our model implied 9.14% constant long-run growth in after-tax operating profit at a 10% required return.
NOPAT is net operating profit after tax, before financing costs. Our model puts AMD’s reformulated NOPAT at $7.79 billion for the four quarters through Q3 2026. The enterprise value of AMD is about $900.24 billion at the reference close, or the value of the entire company, including debt, minus cash.
That is an operating earnings yield of about 0.865% on enterprise value. The model subtracts that yield from its assumed 10% required return to get the 9.14% implied growth rate.
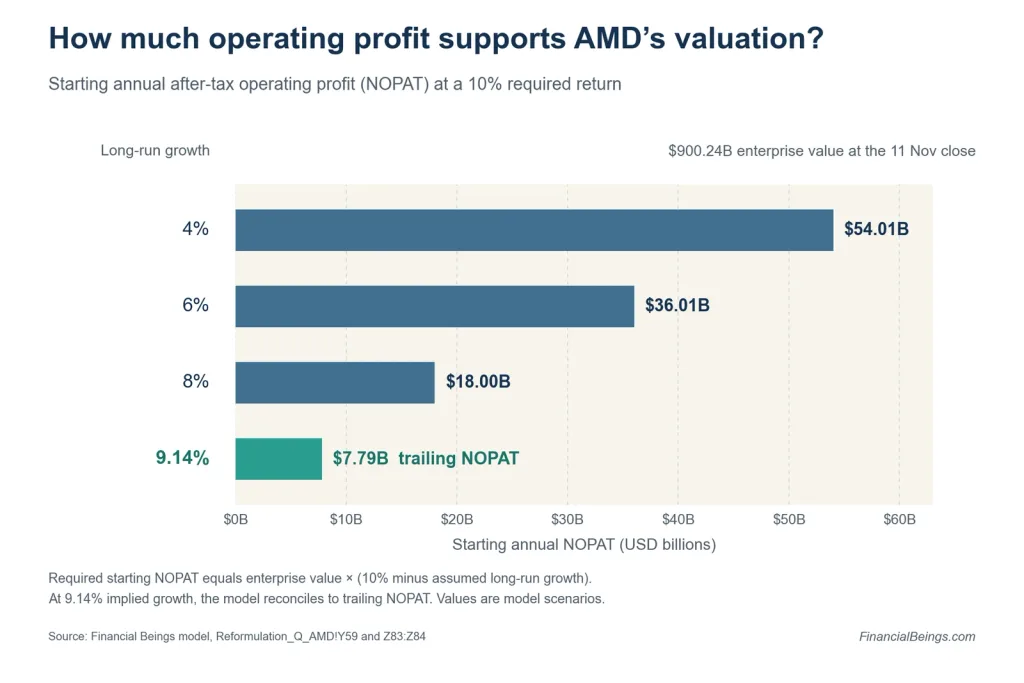
Flip it around. At 4% assumed long-run growth, the model would require about $54 billion in starting annual NOPAT to support the reference valuation, almost seven times trailing NOPAT.
At the November 11 enterprise value, 6% and 8% assumed growth imply $36.01 billion and $18.00 billion in starting annual NOPAT, respectively.
Can AMD Turn Its AI Investment Into Enough Profit to Justify $650?
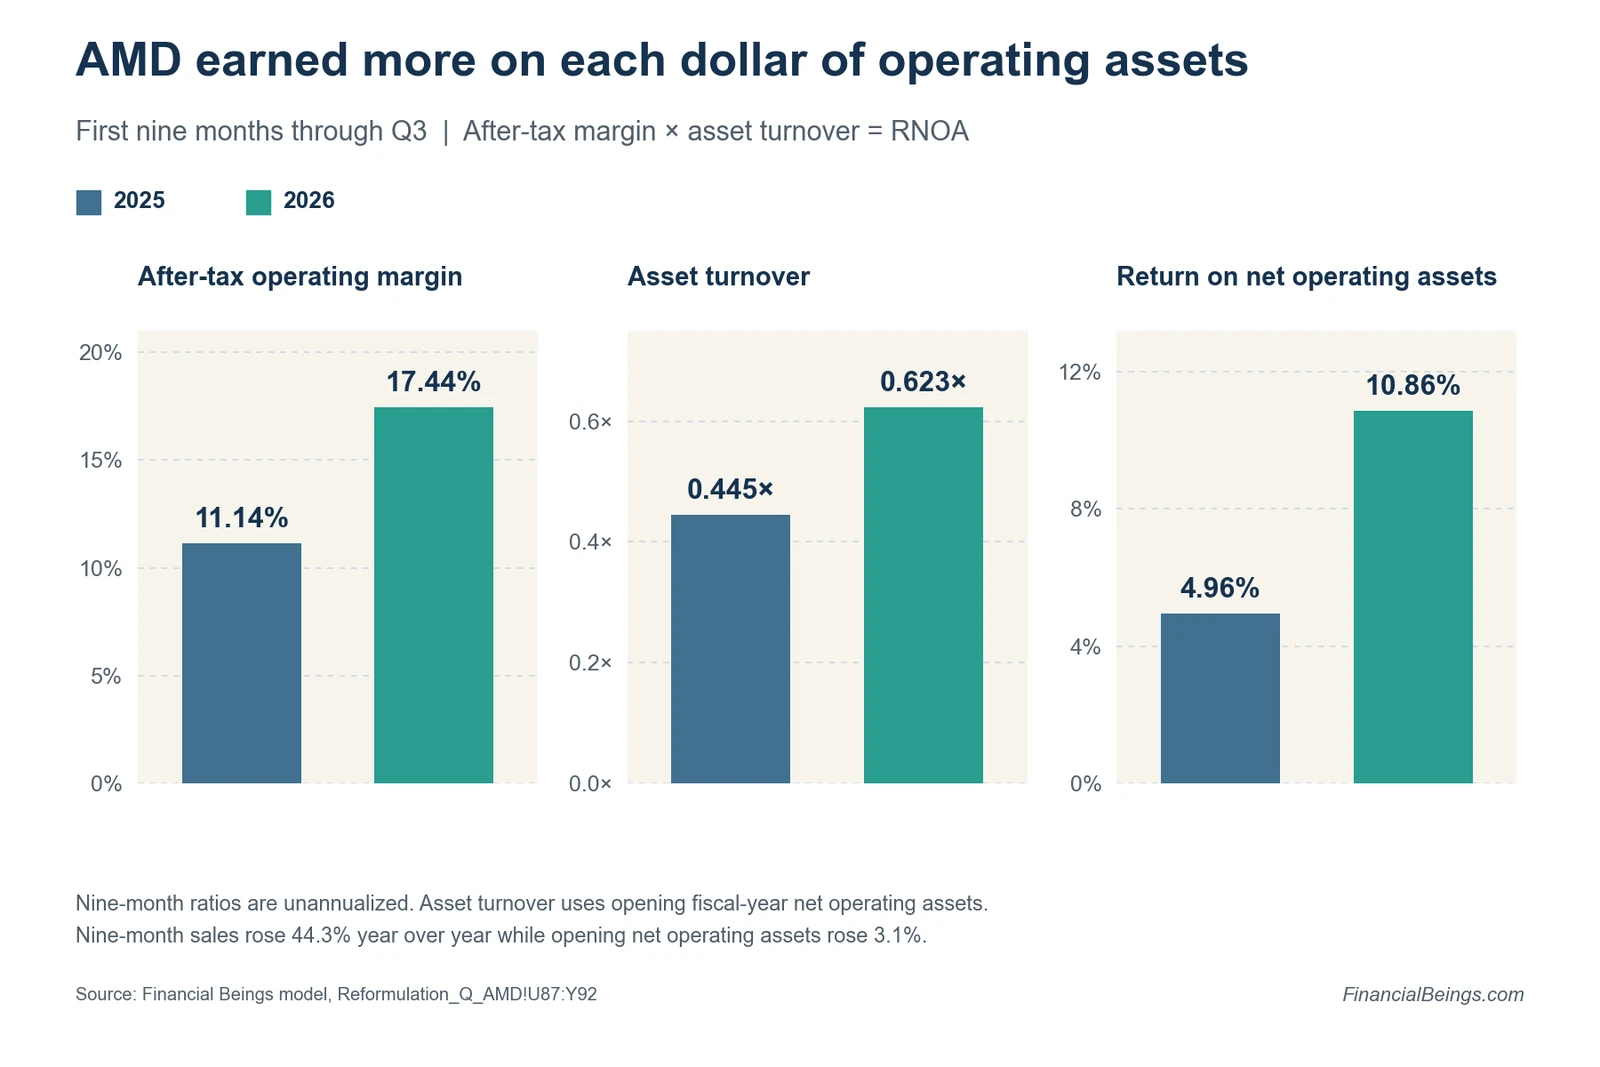
There’s real progress. Return on net operating assets (RNOA) is the profit AMD gets on the capital it has invested in its business. It is equal to after-tax operating margin multiplied by asset turnover, or sales per dollar of opening net operating assets. Nine-month sales grew 44.3%, while opening net operating assets rose 3.1%, lifting turnover.
| Nine months to Q3 | 2025 | 2026 |
| Sales | $24.37B | $35.17B |
| After-tax operating margin | 11.14% | 17.44% |
| Asset turnover | 0.445× | 0.623× |
| RNOA (not annualized) | 4.96% | 10.86% |
The AI ramp ties up working capital. Inventory and receivables (money that customers owe) increased by $6.44 billion combined from FY2025 year-end to Q3 2026. Work in process and raw materials rose, while finished goods fell. AMD tied the inventory build primarily to its Data Center ramp. Payables, the bills AMD owes suppliers, rose $4.83 billion and offset about 75% of the combined increase on the balance sheet. Payment timing was a factor contributing to this, according to AMD.
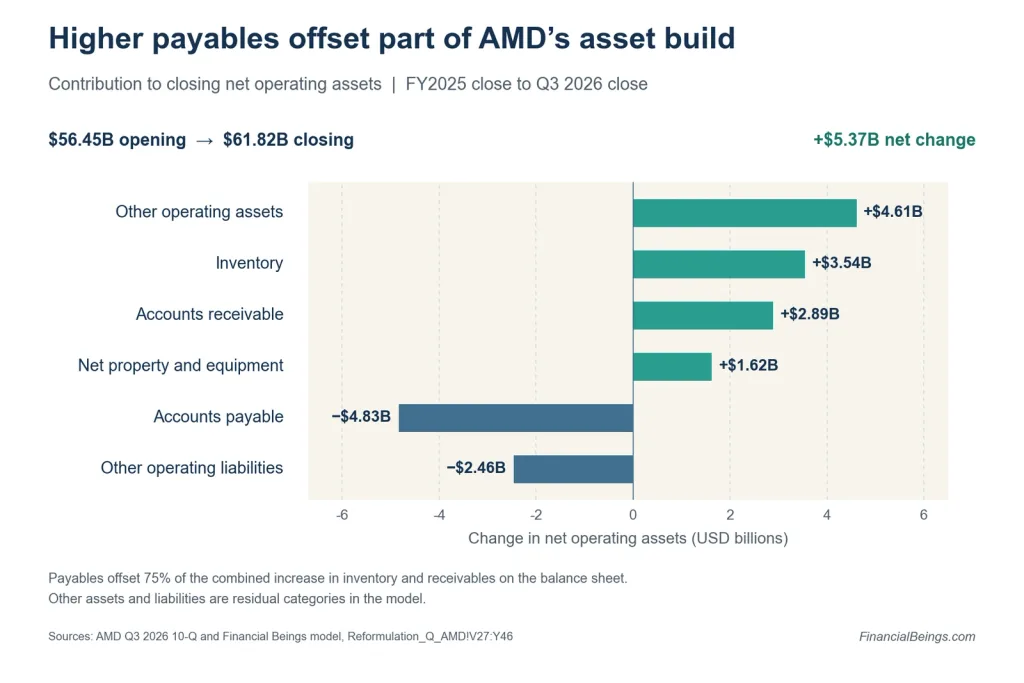
Overall, closing net operating assets increased $5.37 billion. (AMD Q3 10-Q, Note 3 and cash-flow discussion)
The $650 test hasn’t changed: about 37 times $17.69. AMD has to sell that inventory and still have high margins. For another look at how much profit and growth AMD’s price requires, see our AMD vs Apple stock analysis.
What Could Break the Forecast?
The forecast depends on the AI ramp arriving on time. Weak PC and gaming sales, export restrictions, and delays in bringing data centers online could also affect the outlook.
The AI ramp has to arrive on time (Helios and MI450 volumes)
Keep an eye on the next earnings report. Is AMD turning inventory into sales? Are customers paying on time? Do payables fall as supplier bills come due?
Client and Gaming is shrinking
Client and Gaming revenue fell 8% year over year in Q3. AMD expects the segment’s revenue to fall more than 20% in Q4 compared with Q3. To see how AMD’s PC and client chip business compares with a direct rival, read our AMD vs Qualcomm stock comparison.
Export controls and the potential impact on AMD
Government restrictions on chip sales to certain countries are known as export controls. AMD identifies them as a risk in its filings. (AMD Q3 10-Q risk factors)
Limits on data center construction
AI deployments need buildings, cooling, and power. Delays at customer sites could delay sales. (Financial Beings analysis of Applied Digital)
A 36.2% drop from October 2 to November 5 followed by a 36.7% recovery by the close of November 11
| Date | Close | Move |
| October 2 | $633.91 | — |
| November 3 (before results) | $483.90 | — |
| November 4 | $488.78 | +1.0% |
| November 5 | $404.40 | −17.3% from Nov 4 |
| November 11 | $552.90 | +36.7% from Nov 5 |
Is AMD Stock a Buy at the November 11 Close?
Two questions matter. Will AMD’s adjusted earnings per share be close to $17.69 in FY2027? What multiple will investors pay for those earnings?
At $552.90, AMD traded at 31.25× estimated FY2027 adjusted EPS. The provider targets imply 33.73× to 37.23×. To reach $650 at 30×, AMD would need $21.67 in adjusted EPS.
At the consensus EPS estimate, $650 requires a 36.74× multiple. At a lower multiple, AMD would need to earn more than analysts expect.
For more background, see our Nvidia vs AMD comparison and our AMD vs Broadcom analysis.
Frequently Asked Questions
What is the AMD price target for the next 12 months?
Published provider targets range from $596.74 (Public.com) to $658.53 (Stock Analysis) as of November 12. The number of analysts and the date of the data should be taken into account, rather than just the number, at each site.
What is the highest AMD price target?
The highest is $1,250 as seen on MarketBeat and Stock Analysis. That is equivalent to 71 times earnings at the $17.69 earnings estimate for 2027, much higher than the other targets.
What will AMD stock be worth in 2030?
The 12-month targets discussed here do not establish a 2030 price. A 2030 scenario needs an explicit FY2030 EPS estimate and valuation multiple.
Is AMD a buy, sell or hold right now?
The providers reviewed rate AMD from Moderate Buy to Strong Buy, with Public.com showing Buy. The actual question, however, is whether or not the 2027 earnings will materialize and whether investors are willing to pay a premium.
Why did AMD stock fall after earnings?
AMD reported after the November 3 close. Shares rose 1.0% on November 4, then fell 17.3% on November 5. They recovered 36.7% from that close by November 11. The price history does not establish why shares fell. (Historical closes)
Does AMD pay a dividend?
AMD currently pays no cash dividend, according to its investor FAQ. (AMD investor FAQ)