
Apple wins the Amazon vs Apple stock comparison on operating profitability and capital efficiency. Amazon offers more direct exposure to cloud infrastructure and AI investment. Amazon also has the higher implied economic-profit growth requirement: 8.19% a year versus Apple’s 7.74% at a 10% required return. Its recorded price therefore requires faster long-term economic-profit growth under our model.
Our preference is Apple for business quality. At the recorded prices, neither offers growth for free.
Amazon vs Apple stock Comaprison Table
Apple generates a higher YTD after-tax operating margin and turns its opening net operating capital faster. Amazon has the larger revenue base, but its infrastructure investment makes the return on that growing capital base particularly important.
FinancialBeings comparison of YTD operating ratios and valuation
| Metric | Apple AAPL | Amazon AMZN |
| Recorded share price | $344.63 | $240.35 |
| Market capitalization | $5.03 trillion | $2.60 trillion |
| YTD period | Nine months to 27 June 2026 | Nine months to 30 September 2026 |
| YTD revenue | $364.36 billion | $584.07 billion |
| YTD after-tax operating profit margin PM | 27.85% | 19.84% |
| YTD net operating asset turnover ATO | 6.79 times | 1.28 times |
| YTD return on net operating assets RNOA | 188.98% | 25.30% |
| Implied economic-profit growth at an 8% hurdle | 5.73% | 5.89% |
| Implied economic-profit growth at a 10% hurdle | 7.74% | 8.19% |
YTD PM measures after-tax operating profit as a share of sales. ATO and RNOA use opening fiscal-year net operating assets and are not annualized. The reporting dates differ, and the valuation rows use the separate FY2025 model base.
Which stock has performed better in 2026
Apple has outperformed Amazon in 2026. From 31 December 2025 to 30 October 2026, Apple gained approximately 26.8%, compared with 4.1% for Amazon. These are price changes, excluding dividends, rather than total investment returns.
The calculation uses Apple’s move from $271.86 to $344.63 and Amazon’s move from $230.82 to $240.35. That gives Apple a lead of roughly 22.6 percentage points.
Past performance does not establish which stock offers the better return from here. A rising share price can reflect improving business prospects, higher expectations, or both. The relevant buying question is whether future profit can justify the price investors now pay.
For Apple, recent operating momentum provides useful context: its June-quarter release reported revenue growth of 16%. Amazon’s latest results show strong AWS expansion, but investors must also assess the cash demands of that growth.
Is Amazon really cheaper than Apple
Amazon’s headline earnings multiple needs an accounting adjustment before it can support a buying decision. Investment gains can increase reported earnings without demonstrating a matching improvement in the recurring profitability of AWS, advertising, or retail.
Amazon’s September 2026 Form 10-Q records $62.8 billion of upward adjustments to Anthropic preferred stock during the first nine months of 2026. Those adjustments appear in other income. They are distinct from revenue and operating profit.
A higher earnings denominator can make the price-to-earnings ratio look lower. Investors who extrapolate that denominator risk treating an investment revaluation as recurring earnings power.
The investment still has value. A consistent valuation would assess the operating businesses and the financial investment separately, accounting for valuation uncertainty, taxes, and restrictions. It would also avoid counting the same investment value twice.
Our analysis distinguishes YTD operating ratios from the sustainable-profit assumptions used in valuation. Reading both requires attention to reporting periods and consistent treatment of investments, debt, cash, and other financial assets. Our Amazon intrinsic-value analysis explains the broader valuation approach.
Which business earns more on its capital
Apple leads on the YTD operating comparison. Its after-tax profit margin is 27.85%, compared with Amazon’s 19.84%. Apple’s net operating asset turnover is 6.79 times, against 1.28 times for Amazon. Together, those figures produce YTD RNOA of 188.98% and 25.30%, respectively.
Return on net operating assets, or RNOA, combines two measures:
YTD RNOA = YTD after-tax operating profit margin × YTD net operating asset turnover.
We calculate PM as YTD reformulated after-tax operating income divided by YTD sales. ATO divides those sales by net operating assets at the start of the fiscal year. Multiplying them gives the profit earned during the period relative to that opening capital base.
For Apple, YTD sales of $364.357 billion divided by opening net operating assets of $53.690 billion produce turnover of 6.786 times. Its $101.464 billion of reformulated after-tax operating income produces a margin of 27.847%. Using unrounded inputs gives RNOA of 188.981%.
Amazon’s corresponding inputs are $584.069 billion of sales, $457.970 billion of opening net operating assets, and $115.868 billion of reformulated after-tax operating income. They produce turnover of 1.275 times, PM of 19.838%, and RNOA of 25.300%.
Apple’s margin is approximately 1.4 times Amazon’s, while its turnover is about 5.3 times higher. Turnover therefore explains more of the return gap than margin alone.
These are nine-month returns, not annualized rates: Apple’s period ends on 27 June 2026 and Amazon’s on 30 September 2026. These ratios use reformulated after-tax operating profit; valuation relies on a separate sustainable-profit estimate. Amazon’s investment-related gains remain relevant to the earnings-quality assessment above.
Apple’s high RNOA also reflects a relatively small net asset denominator. Supplier funding and other operating liabilities reduce net operating assets, while internally developed intangible value is not fully recorded. The ratio does not mean shareholders earned 188.98% on their investment.
Our Walmart versus Costco comparison applies the same distinction between margins and the capital needed to support sales.
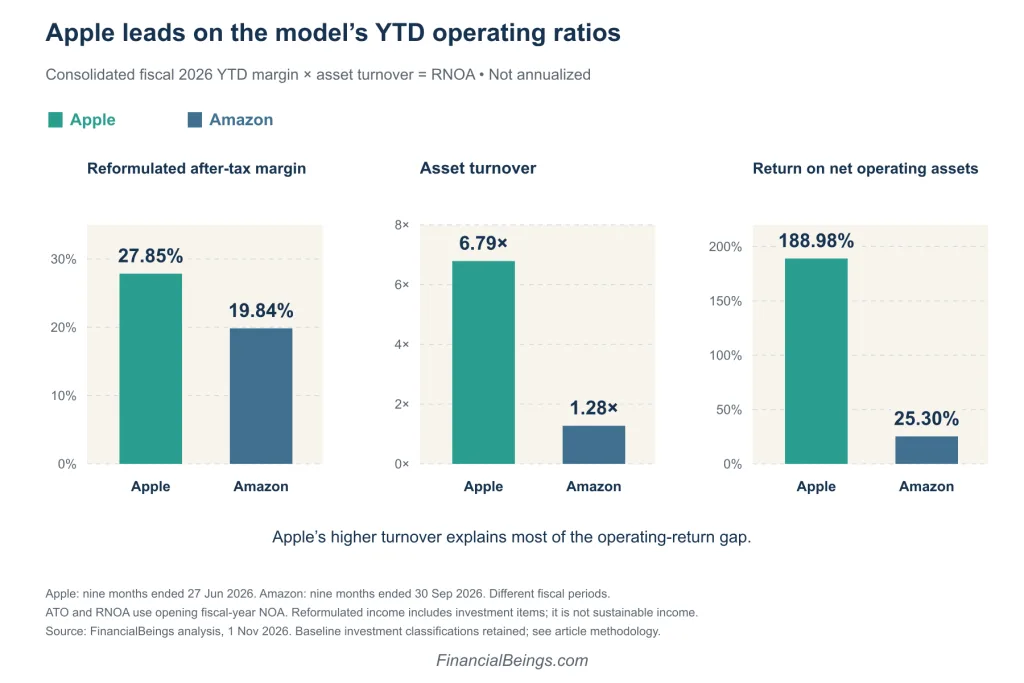
Apple and Amazon fiscal 2026 YTD profit margin asset turnover and RNOA using opening fiscal-year net operating assets without annualization.
Why Amazon has negative free cash flow
Amazon’s negative free cash flow reflects infrastructure spending that exceeds cash generated by operations. Its Q3 2026 earnings release reports $168.3 billion of trailing operating cash flow and $210.7 billion of net property and equipment purchases, leaving a $42.4 billion outflow.
Negative free cash flow during expansion does not automatically indicate a failing business. The investment question is whether the assets eventually generate enough additional cash to compensate shareholders for their cost and risk.
Amazon’s filing maintains approximately $220 billion of planned 2026 cash capital expenditure. It also reports about $578 billion of future contractual commitments, primarily related to AWS. Those commitments support the demand case, but they are future revenue obligations, not cash already collected or guaranteed profit.
Apple’s latest cash statement shows a different allocation pattern. During the nine months ended June 2026, it spent $62.1 billion on repurchases and $11.8 billion on dividends, against $6.8 billion of property and equipment payments. The company statement provides the underlying figures. Apple’s capital spending looks very different when set against another mega-cap platform, as our Apple vs Google stock comparison shows through capital expenditure, margin, turnover and operating returns.
Buybacks help continuing owners when shares are purchased at sensible prices. Their size alone does not establish that management created value.
What growth is each share price assuming
Amazon has the higher implied growth rate at every tested hurdle. At a 10% required return, its price implies 8.19% annual growth in residual operating income, compared with Apple’s 7.74%. The gap is 0.45 percentage points. Amazon’s requirement is also higher at the 8% and 9% hurdles, and the gap widens as the required return rises.
Long-term economic-profit growth implied by the share prices
| Required annual return | Apple | Amazon |
| 8% | 5.73% | 5.89% |
| 9% | 6.73% | 7.04% |
| 10% | 7.74% | 8.19% |
Residual operating income means sustainable after-tax operating profit minus a charge for the capital employed. The model works backward from market value to infer the growth assumption consistent with that price.
These percentages describe economic-profit growth. They are neither revenue forecasts nor promised shareholder returns. They also represent a perpetual single-stage assumption, making even a seemingly moderate percentage demanding over a long horizon.
Apple must preserve strong profitability while expanding its earnings base. Amazon must grow operating profit sufficiently to cover the capital charge on an expanding asset base. Faster sales growth can coexist with disappointing economic returns if investment grows even faster.
A 5–6% growth requirement is therefore conditional on an 8% hurdle rate. At a 10% required return, both requirements are materially higher, with Amazon requiring the faster growth.
For a longer horizon, our Apple stock forecast through 2030 explores how operating assumptions affect valuation.
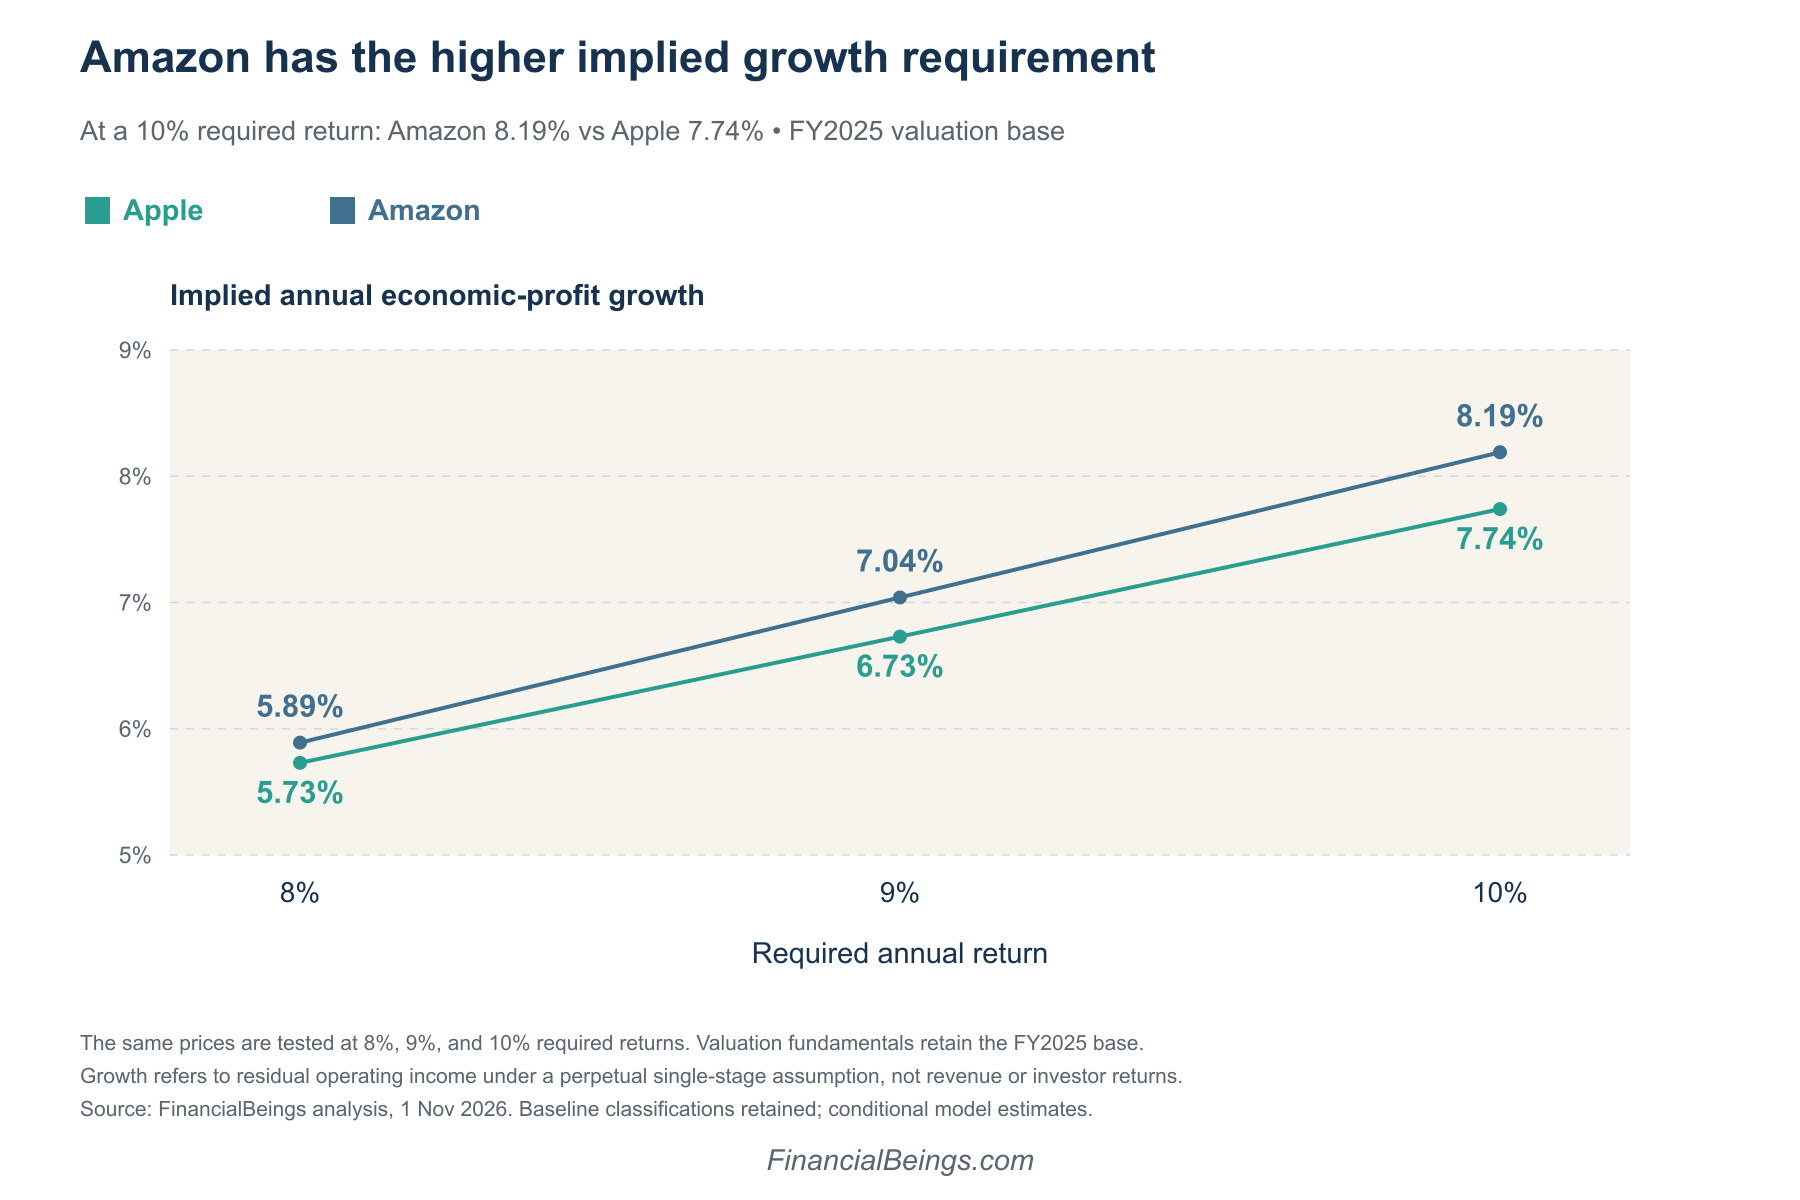
Amazon has higher implied economic profit growth than Apple at every tested hurdle rate.
Valuation at different growth rates with a 10 percent hurdle
At a 10% required return and 5% annual economic-profit growth, our analysis values Apple at $158.78 per share and Amazon at $111.21. Those values represent about 46% of their recorded prices. Both valuations rise sharply as the growth assumption increases.
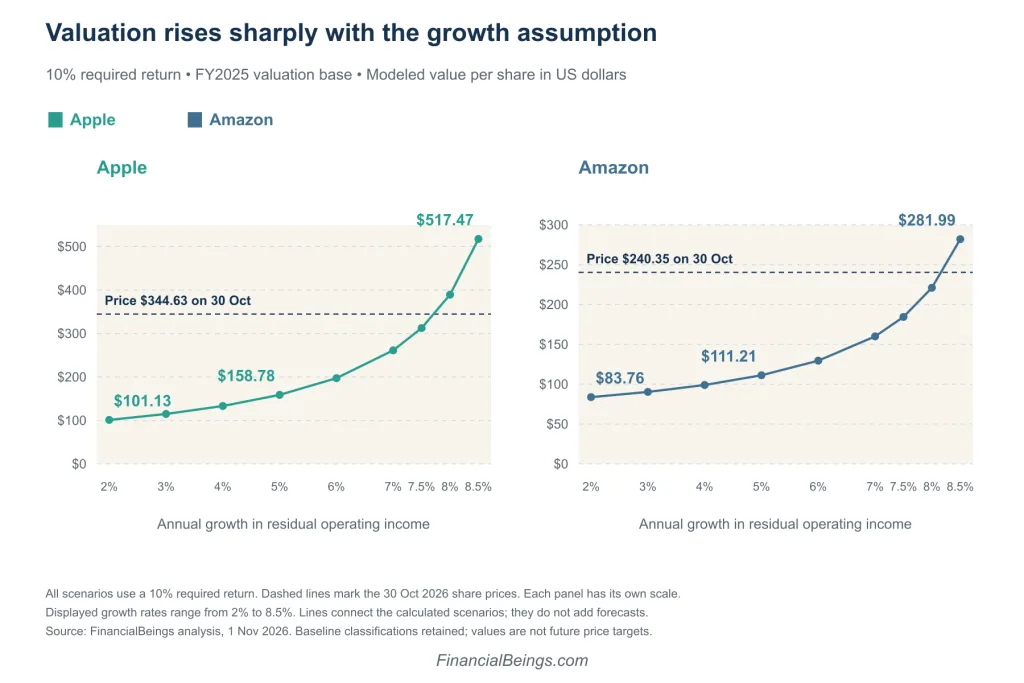
Apple and Amazon model valuations at 2 to 8.5 percent economic profit growth with a 10 percent hurdle rate.
Valuation per share at a 10% hurdle
| Growth in economic profit | Apple value per share | Apple value / price | Amazon value per share | Amazon value / price |
| 2% | $101.13 | 29.34% | $83.76 | 34.85% |
| 3% | $114.86 | 33.33% | $90.29 | 37.57% |
| 4% | $133.16 | 38.64% | $99.01 | 41.19% |
| 5% | $158.78 | 46.07% | $111.21 | 46.27% |
| 6% | $197.21 | 57.22% | $129.50 | 53.88% |
| 7% | $261.26 | 75.81% | $160.00 | 66.57% |
| 7.5% | $312.50 | 90.68% | $184.40 | 76.72% |
| 8% | $389.37 | 112.98% | $220.99 | 91.95% |
| 8.5% | $517.47 | 150.15% | $281.99 | 117.32% |
The price benchmarks are $344.63 for Apple and $240.35 for Amazon, recorded on 30 October 2026. Value / price means modeled value divided by that benchmark, not an expected investment return. Apple’s value exceeds its recorded price in the 8% scenario; Amazon’s does so in the 8.5% scenario.
These are conditional model valuations using growth in residual operating income, not revenue growth or guaranteed price targets. The displayed scenarios cover growth rates from 2% to 8.5%. As growth approaches the hurdle rate, valuation becomes increasingly sensitive to small assumption changes.
How much of the price depends on future growth
At a 10% required return, our valuation attributes 76.23% of Apple’s price and 68.94% of Amazon’s price to growth beyond a flat residual-income baseline. This percentage of price is a different measure from the implied annual growth rate. Apple has the larger growth-premium share, while Amazon has the higher implied growth rate of 8.19%, versus Apple’s 7.74%.
The corresponding no-growth equity values are approximately $81.91 per Apple share and $74.65 per Amazon share. These are theoretical values assuming residual operating income remains flat indefinitely under the model’s convention. They are not price targets, liquidation values, or predicted trading floors.
The growth-premium share depends on the no-growth valuation relative to price; the implied growth rate also reflects the economic-profit base and capital charge. The two measures can rank the companies differently. Amazon’s lower growth-premium share therefore does not establish a lower growth hurdle or prove undervaluation.
What could change the investment verdict
Apple’s case strengthens if revenue growth continues without material erosion in margins or cash conversion. Its July results included tariff-refund benefits, so investors should distinguish underlying profitability from temporary assistance when assessing the next release.
Leadership is another consideration. John Ternus became CEO effective September 2026. Product execution, China exposure, and the commercial contribution of AI features deserve scrutiny under the new leadership.
Amazon’s case strengthens if AWS growth produces improving cash generation after infrastructure expenditure. Its Q3 release reported AWS revenue growth above 39%. The next evidence investors need concerns capacity utilization and returns on new investment. For another view of how AWS growth and capital intensity feed into valuation, see our Walmart vs Amazon stock analysis, which tests how modeled value changes against the current price at different growth rates.
Investors should also watch the timing difference between spending and depreciation. Cash leaves when infrastructure is purchased, while its accounting cost is recognized over time. Operating profit can therefore remain strong during a spending surge. Conversely, low free cash flow can precede profitable expansion. Following both measures helps investors judge whether the current investment cycle is producing an adequate return rather than simply increasing reported scale.
A lower share price could also improve either opportunity without any change in business quality. Conversely, weaker sustainable profits would make the current valuation harder to defend.
Should you buy Amazon or Apple stock
Apple is our preferred business for capital efficiency and cash distributions. Amazon is the more direct cloud-and-AI infrastructure investment, with greater dependence on successful reinvestment.
For a new purchase, our analysis supports price discipline with either stock. Apple leads on capital efficiency and requires lower implied economic-profit growth at each tested hurdle. Amazon’s 8.19% growth requirement at a 10% hurdle, alongside its infrastructure spending, requires confidence in durable returns on new capital. Apple’s larger growth-premium share of price remains a separate valuation risk.
Frequently asked questions
Is Amazon or Apple a better stock to buy
Apple leads on operating profitability and capital efficiency in our model. Amazon offers more direct cloud and AI infrastructure exposure, but has the higher implied growth requirement: 8.19% versus Apple’s 7.74% at a 10% hurdle. Our preference is Apple for business quality, subject to entry-price discipline.
Does Amazon pay a dividend
Amazon does not currently pay a regular dividend. Apple’s latest declared quarterly dividend is $0.27 per share, according to its dividend history. Annualizing that rate gives $1.08, approximately 0.31% of the $344.63 share price on 30 October 2026.
Which company is bigger
Apple is larger by market capitalization as of 30 October 2026, at approximately $5.03 trillion versus Amazon’s $2.60 trillion. Amazon is larger by the disclosed nine-month YTD revenue, at $584.07 billion versus Apple’s $364.36 billion; their fiscal reporting dates differ. The answer depends on the measure.
Why is Amazon free cash flow negative
Its trailing net property and equipment purchases exceeded operating cash flow. Amazon reported a $42.4 billion free-cash-flow outflow through September 2026. The longer-term investment outcome depends on whether the new infrastructure produces attractive cash returns after its funding and operating costs.
Is Apple stock overvalued
Our model shows substantial growth expectations in Apple’s price, rather than proving a universal fair value. At a 10% required return, 76.23% of the recorded price sits above the flat-economic-profit baseline. Whether that premium is justified depends on future performance.
Sources
- Apple Q3 FY2026 results: View Source
- Apple financial statements: View Source
- Apple dividend history: View Source
- Apple CEO transition: View Source
- Amazon Q3 2026 results: View Source
- Amazon September 2026 Form 10-Q: View Source