
Say you have $10,000 sitting in a savings account, doing basically nothing. You want to put it in a stock you can hold for many years, and not trade in and out of. You keep circling two names – Apple and Google. Everyone you know owns one or the other or both and swears there is nothing better.
So, you begin comparing. And the first thing you notice makes Google look like the obvious winner.
The stock price of Apple is approximately 37 times its annual profit. Google, on the other hand, costs approximately 17 times its annual profit. If the profit never increased, in simple terms, that “times profit” figure, known as a P/E ratio, would tell you how many years it would take the stock to pay you back your money. Generally, a lower number indicates a lower price.
According to the math, Google is on sale. Apple looks expensive. Case closed, right?
Not quite. And that disparity between “looks cheap” and “actually cheap” is where things get interesting in this tale of Apple vs. Google stock, and where you could easily make your decision based on a number that is lying to you.
Why Google’s 17x Price Tag Doesn’t Mean What It Looks Like
Here’s the thing about that 17x number: it includes money Google didn’t actually earn from running its business.
Google’s official profit in the past year was $244 billion. However, $117.5 billion of that, almost half, was from another sector altogether: the growth in Google’s paper value of investments in other firms, such as SpaceX and Anthropic. Google didn’t sell those stakes. It didn’t get that money. The figure simply ticked up on the books, and accounting rules count that as profit.
Those paper profits accounted for 70% of Google’s reported profit in the latest quarter (Q2 2026) alone. Seventy percent. That didn’t come from the services that people use every day: Search, YouTube, or Google Cloud.
| Quarter | Reported Profit | Paper Investment Gains | Operating Profit (after tax) | Gains as % of Profit |
| Q3 2025 (Jul–Sep) | $35.0B | $8.4B | $22.5B | 24% |
| Q4 2025 (Oct–Dec) | $34.5B | $1.8B | $31.6B | 5% |
| Q1 2026 (Jan–Mar) | $62.6B | $29.3B | $25.2B | 47% |
| Q2 2026 (Apr–Jun) | $112.2B | $78.1B | $33.1B | 70% |
| Last 12 months | $244.2B | $117.5B | $112.3B | 48% |
Notice the trend in that table. Not one odd quarter; the paper gains have jumped in each of the last two quarters, and they’re a larger portion of Google’s “profit,” as stated in their reports. That’s important because it is a degradation of the reliability of the headline P/E, not an improvement.
Now strip that noise out and price each company on what its actual business earned – not the accounting extras. Suddenly the picture changes a lot. For a deeper, standalone breakdown of how we get to Google’s operating value and intrinsic value, see our full Google intrinsic value analysis.
How we calculate “operating P/E”
| Step | Alphabet |
| Shares × price | 12.088B × $338.46 = $4,091B market cap |
| Less net cash (cash & securities minus debt, June 2026) | −$124B |
| = Value of the business (what you pay for operations, ignoring the cash pile) | $3,968B |
| ÷ After-tax operating income, last 4 quarters (Q3-25 $22.5B + Q4-25 $31.6B + Q1-26 $25.2B + Q2-26 $33.1B) | $112.3B |
| = Operating P/E | 35.3x |
We strip out net cash because a company holding a large cash pile looks artificially cheap on a plain market-cap-to-profit basis — you’re paying for the cash too, not just the business. Apple’s operating P/E uses the same method; it barely moves the number because Apple carries a small net debt position rather than a cash pile.
| Measure | Apple | What it means | |
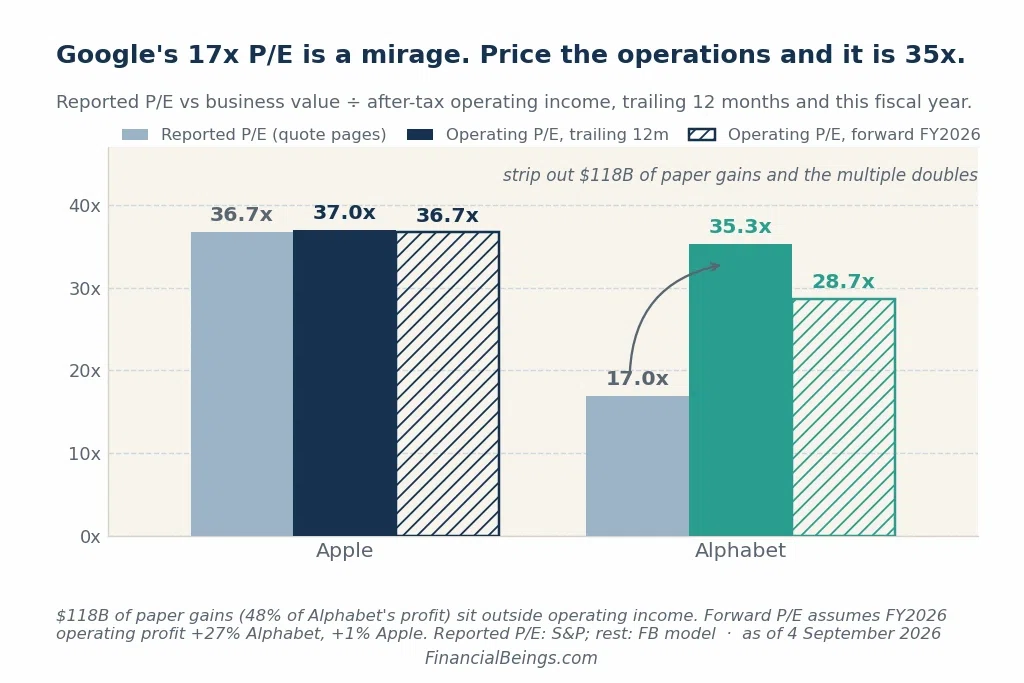
| Reported P/E (headline number) | 36.7x | 17.0x | Includes paper gains |
| Operating P/E (last 12 months) | 37.0x | 35.3x | Strips out paper gains |
| Forward operating P/E (this fiscal year, estimated) | 36.7x | 28.7x | Assumes Google’s operating profit jumps 27% |
When you price the actual operations, Google’s price tag isn’t that much lower than Apple’s. It’s just a bit less expensive, at 35x as opposed to 37x. The number ahead, 28.7x, sounds more appealing, but is based on a forecast of Google’s actual profits rising significantly in the second half of the year. A forecast isn’t a fact. Before putting your $10,000 behind it, remember this.
This will be the first lesson in any fair Apple-to-Google stock comparison to follow: You don’t always get what you pay for. It’s like purchasing a used car online that is being sold at a low price only to discover that the engine is in need of replacement. The number on the sign wasn’t wrong, per se. But it wasn’t quite that simple.
Same Profit Margin, Three Times the Return – So What’s Really Different?
Here’s where it gets genuinely interesting, and where the decision starts to have a real answer.
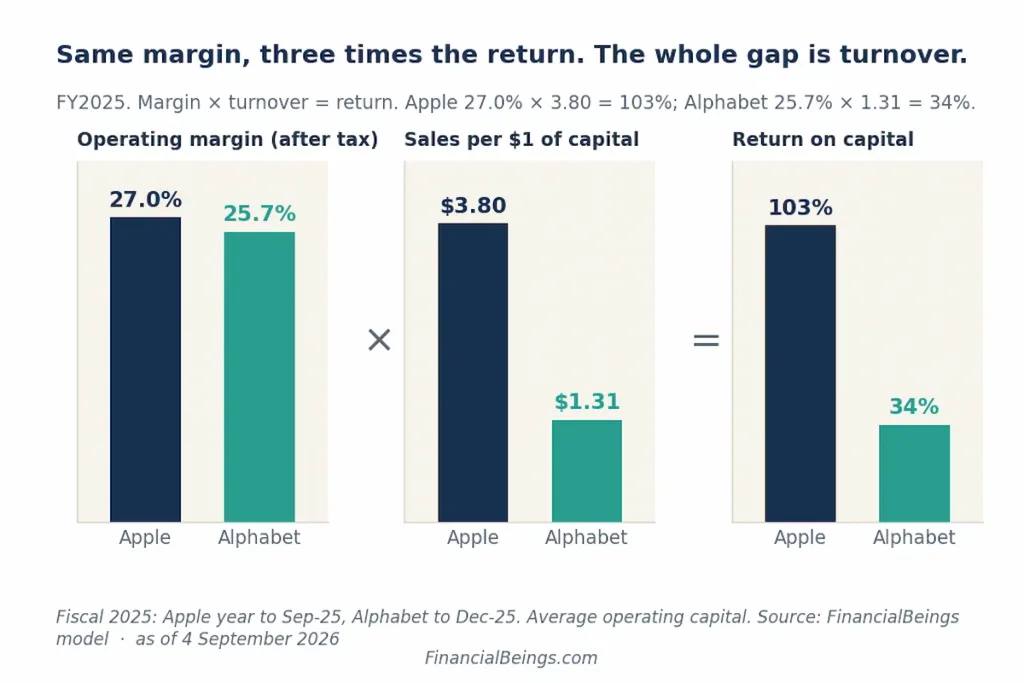
Apple and Google’s profits are virtually the same per dollar of sales. After tax, Apple has a profit margin of approximately 27 cents on every dollar sold. Google holds 25.7 cents. Only a scant difference; you might have called both “about a quarter” and not been too far wrong.
When you look at how much profit each company is making on the dollar invested in the business (investors call this return on capital), things get rather more interesting. The return on capital of Apple is 103%. Google’s is 34%. Apple is making about three times the profits on each dollar invested in the business.
| Apple | ||
| Profit margin (after tax) | 27.0% | 25.7% |
| How many times a year the business “turns over” its capital | 3.80x | 1.31x |
| Return on capital (margin × turnover) | 102.6% | 33.6% |
Once you understand the math, it’s easy to see that a 27.0% margin multiplied by 3.80 turns results in approximately a 103% return. 25.7% margin times 1.31 turns equals about 34%. Margin makes little difference. The entire difference is turnover, the ability of each company to make use of money.
Imagine two lemonade stands that sell the same number of cups for the same profit. It requires $10,000 of equipment for one stand. The other must run a $30,000 factory to sell the same number of lemonade drinks. Same margin, very different returns on the invested money. If an investor put money into one of those two, they would value them very differently, even if the lemonade is the same.
So it’s Apple vs. Google, on a micro scale. It also gives you an idea of why two companies with almost identical sales in the top line ($416 billion v. $403 billion) can have such different bottom lines when you ask, “how much did it cost to make that money?”
Why Apple Travels Light, and Google Doesn’t
Apple is not the manufacturer of its iPhones. Machines, buildings, and inventory are owned by companies such as Foxconn or TSMC. Apple’s part is to design the phone and entrust the rest, and the price tag, to third parties. Even the new Siri will be powered by Google’s own AI model, Gemini, rather than built from scratch. That means that Apple’s suppliers and customers are effectively financing roughly 59% of its day-to-day operating assets, an arrangement that most companies could not pull off.
Google is the opposite. It constructs and operates its data centers, which serve Search, YouTube, Cloud, and its AI capabilities. Now, it has reached a level of physical equipment that is 61% of its annual sales, while Apple is only at 12%. Last year, Google alone spent $91.4 billion on buildings and equipment, seven times as much as Apple did.
| Fiscal Year | Apple Capex | Google Capex |
| 2019 | $10B | $24B |
| 2021 | $11B | $25B |
| 2023 | $11B | $32B |
| 2025 | $13B | $91B |
| 2026 (guidance) | – | $195–205B |
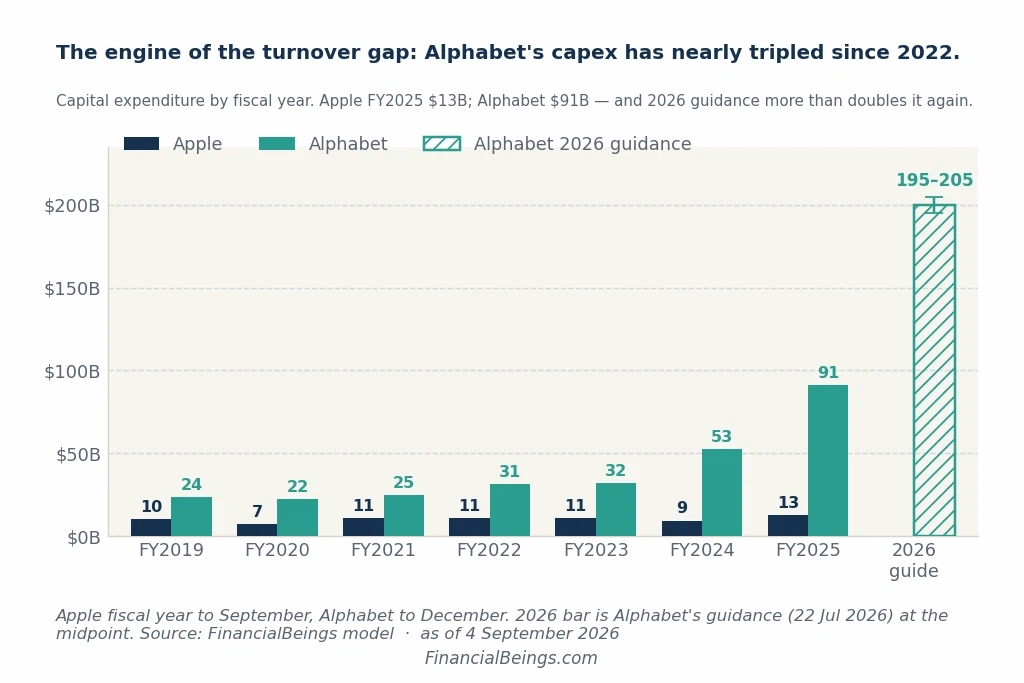
The last line is eye-catching. Google has announced that it will be spending close to $200 billion on capital expenditures in 2026; that figure is not an outside analyst’s prediction, but guidance from Google itself. That’s the AI buildout in one number, and it’s more than six times what Google was spending four years ago. That spending doesn’t just build data centers — a large share of it flows straight to the chipmakers powering the AI boom, which is why we compared Nvidia vs. Google as a 2026 buy in a separate piece.
This also accounts for something that seems shocking on the surface: Apple’s price relative to its book value (the accounting worth of all that it owns) is a wild 43.5x compared to a mere 6.7x for Google. It’s not because Apple charges too much money. It’s because, over decades, Apple has reduced its on-paper equity to near zero with stock buybacks as the company continues to make profits.
Remove the accounting distortion, and compare what investors pay per dollar of capital invested in each business (39.6 vs. 11.5, the ratio of the market value of the company to its capital invested), and it does not look like a warning sign; it is the mirror image of Apple’s far higher return on that capital. We go deeper into Apple’s full 2030 valuation picture, including how much growth its price already assumes, in our Apple stock forecast and valuation analysis.
The Trend Line: One Company Rising, One Company Betting Big
The return on capital of Apple has been rising every year from 79% in 2022 to 103% in 2025. It continues to churn out more with less, a quarter at a time, almost without complaint.
Google’s return has been declining, from 51% in 2021 to 34% in 2025, and slipped further in the latest quarter. That’s not necessarily a red flag. Google just invested an astronomical amount of money in deploying AI infrastructure that hasn’t yet begun to pay off. The money that new data centers are supposed to generate takes years to be realized; the data centers themselves are recorded on the books as they are constructed.
The number everyone should keep a close eye on every quarter from here on: does Google’s operating profit grow at a faster clip than the capital it is putting to work? If it does, then the AI bet is on point and today’s returns may be a blip on the screen until it gets bigger. Otherwise, today’s number is now the new normal, and that alters the entire picture.
What the Stock Price Is Already Betting On
The stocks are valued on the expectation that operating profits above the cost of capital continue to rise at near 8% per year over the long run, which is about twice the economy’s long-run growth rate. Apple’s price suggests that there is 7.77% expected long-run growth. Google’s implies 7.92%.
Neither of these numbers is a free lunch. Apple’s number is near the top of its own nine-year range. Google’s is just a hair below its 2017 high. Both companies are being asked to outrun the economy, over the long run, to justify what people are paying right now.
Here’s a simple way to see how much that growth assumption matters. If you dial the expected growth rate down to a more modest 5% a year:
| Assumed Growth Rate | Apple Value/Share | Google Value/Share |
| 2% (Conservative) | $92.70 | $113.23 |
| 5% (Balanced-Growth) | $145.29 | $160.80 |
| 7% (Upper) | $238.77 | $245.36 |
| ~7.8–7.9% (today’s price) | ~$319 | ~$339 |
At 5% growth, already faster than the economy, both stocks would be worth roughly half of what they trade for today. That’s not a prediction that they’ll fall. It’s a reminder of how much optimism is already baked into the price. One extra point of growth, from 7% to 8%, adds 45–50% to either company’s value. That steepness cuts both ways: it rewards patience if the growth shows up and punishes it hard if it doesn’t.
So, Apple vs. Google Stock: Which Should You Actually Buy?
There is no safe winner here, and anyone claiming otherwise is probably selling something. The true Apple vs. Google stock debate isn’t about which is cheaper; it’s about which business can continue to grow at a faster rate than the economy for longer.
The Apple case: They have proven for years that they can do it with very little money to make a lot of money, and that they get better at it. You pay a high price for that reliability, and so far it has held up.
Google’s case: The market is putting a slightly smaller price tag on what they’re willing to pay for its future versus Apple’s. That raises a very real question, however, that of whether its jaw-dropping AI spend will turn into profit before investors lose their patience.
You won’t come away with a resounding “buy this one”. You walk away knowing what you are paying for, and that’s the best thing that can happen. If Apple is on your shortlist, you might also want to see how it stacks up against another mega-cap: Apple vs. Microsoft stock comparison.
FAQs
Is Google actually cheaper than Apple right now?
A bit, not by a lot. After stripping out one-time investment gains, Google trades at roughly 35 times its annual operating earnings, compared with roughly 37 times for Apple – not nearly the difference the headline P/E seems to indicate.
Why does Google’s official profit look so much bigger than its real business profit?
Nearly half of Google’s reported profit over the past year came from the rising paper value of stakes it owns in other companies, not from Search, YouTube, or Cloud.
Why does Apple earn so much more per dollar invested than Google?
Apple owns very little in its business; it depends on suppliers to make the products; it needs much less cash to operate the business. Google owns its data centers and equipment fully and ties up a lot more capital. For the full buy/hold verdict on Apple beyond just this efficiency angle, see is Apple stock worth buying in 2026?
Is Google’s falling return on capital a warning sign?
Not necessarily. It’s a sign of huge AI investment which hasn’t yet yielded results. The main point of interest is whether Google’s operating profit growth will outpace the growth in its operating capital over time.
What growth rate does each stock’s price assume?
Apple’s price implies about 7.8% a year over the long run and Google’s about 7.9%, both close to their own historical highs.
Figures as of the 4 September 2026 close. Valuation figures come from the FinancialBeings model at a 10% required return; reported P/E and price-to-book from S&P Global.
Sources
The financial figures referenced in this analysis are sourced directly from the companies’ official regulatory filings with the U.S. Securities and Exchange Commission (SEC).
Compiled by FinancialBeings.com · Last updated: 4 September 2026
