
2026 has been a confusing year for both stocks. On Feb. 3, Walmart surpassed a $1 trillion market value, reached a new high of $135.16 on May 19, and dipped down to just about $105. In August, Amazon was moving closer to the $2.8 trillion valuation mark.
Both have had volatile years, on very different paths. Anyone interested in Walmart stock vs Amazon stock should recognize the danger of reading the surface numbers, and the fact that in the same month two quite different quarters were misread by the market.
Walmart vs Amazon Stock at a Glance
Quick terms: P/E ratio tells you how much investors pay per dollar of earnings. Beta measures how much a stock swings versus the market – above 1 is more volatile, below 1 is calmer.
| Metric | Amazon (AMZN) | Walmart (WMT) |
| Share price | $254.92 | $105.92 |
| Market cap | $2.75 trillion | $843 billion |
| Trailing P/E | 21.20x | 39.08x |
| Adjusted forward P/E | 28.76x | 35.60x |
| TTM revenue | $775.7B | $735.8B |
| Beta | 1.45 | 0.61 |
| Dividend yield | None | 0.93% |
| Analyst consensus target | $327.67 | $127.73 |
Take a look at the trailing P/E spread. Walmart’s 39.08x is nearly double the level that Amazon is trading at, at 21.20x. Just stop reading right here, and you’d assume this is the obvious deal for Amazon. It’s not, and we will explain why below.
Amazon’s Q2 2026: A $200 Billion Quarter With an Asterisk
The second quarter, which was reported on July 30, was indeed a strong quarter for Amazon. Revenue hit $200.6 billion, up 20%. Operating income rose 43% to $27.5 billion.
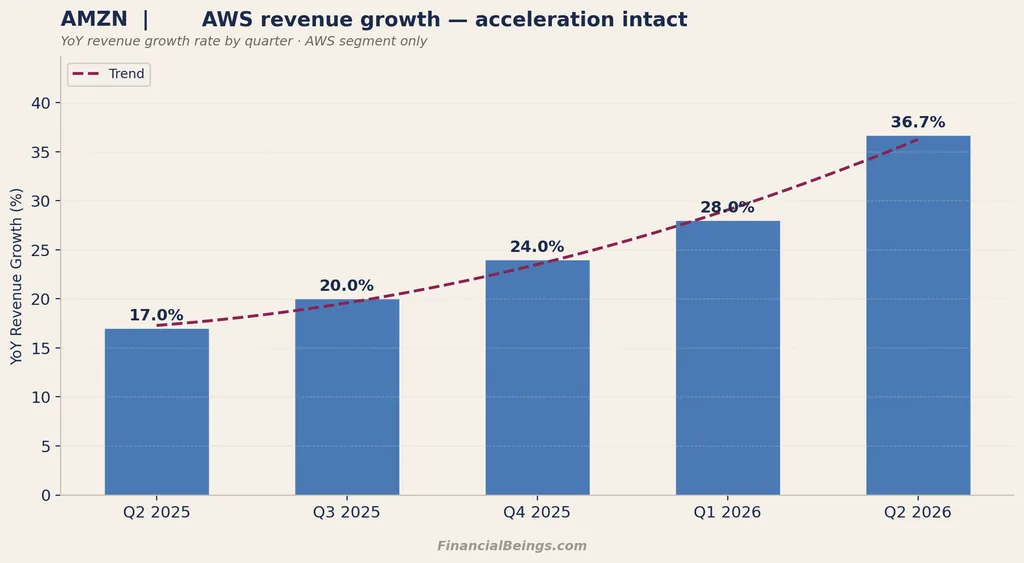
AWS, the cloud division of Amazon which leases computer storage and processing power to other firms, was the star. AWS revenue reached 36.7% higher at $42.2 billion at 39.4% margin and had a backlog of $496 billion in signed, but undelivered contracts. The reason that matters is because that backlog is not a guess, it’s contracted revenue that is still to come. But while it’s not always the most talked-about business on Amazon, ads is among the most profitable with revenue rising 26% to $19.8 billion.
Table 1: AWS Growth Has Been Accelerating, Not Slowing
| Quarter | AWS Revenue Growth (YoY) |
| Q2 2025 | 17.0% |
| Q3 2025 | 20.0% |
| Q4 2025 | 24.0% |
| Q1 2026 | 28.0% |
| Q2 2026 | 36.7% |
Five straight quarters of speeding up, not slowing down — unusual since growth typically fades as a business grows.
The $53 Billion That Isn’t From Operations
This is a topic that few others are discussing. The company’s headline net income was $62.6 billion. However, about $53.4 billion of it (pre-tax) came from something unrelated to shipping packages or running servers. Amazon has an investment in the AI firm, Anthropic, and when the value of the investment increased, the rules of accounting forced Amazon to recognize the gain as income despite never having disposed of the investment.
It’s as if your value is growing by the day like your house – you have more assets, but not more money until the gain is realized. Remove that paper gain and Amazon’s true earnings would be a far cry from the headline.
Walmart’s Q2 FY2027: Beat, Raise, and a 9% Drop
That’s not the only story of good news that went stale at Walmart, which reported its quarter August 20, though. Revenue rose 5.9% to $187.9 billion. The company posted adjusted earnings per share of $0.81, a 19.1% increase. E-commerce grew 23% and Walmart Connect rose 43% as management upgraded full-year guidance to $2.80–$2.87 per share. On paper, it’s the kind of quarter any retailer would be proud of.
On most counts, it’s a decent quarter. So why was the stock price dropping almost 9% just after?
Two reasons. GAAP earnings were $0.80, compared to $0.88 a year earlier. The tariff refunds accounted for approximately $2.9 billion of the profit increase but did not prove the company was more profitable as a business, and were a one-time occurrence. Include guarded next-quarter forecasts, and investors wouldn’t pay a premium for every dollar of earnings, just a de-rating, in which the business isn’t getting worse, but investors are not willing to pay more.
Valuation: The Comparison Most Articles Get Wrong
Let’s now come back to the previous question. For one, the P/E ratio of 21.20x is much more attractive than Walmart’s 39.08x, because the Anthropic paper has made its earnings look good, which artificially lowers the P/E. It is an illusion from accounting, not a discount.
Comparing the adjusted P/E is a better measure since it removes one-off items and considers forward earnings.
Table 3: Apples-to-Apples Valuation
| Metric | Amazon | Walmart |
| Trailing P/E (headline) | 21.20x | 39.08x |
| Adjusted forward P/E | 28.76x | 35.60x |
| Unlevered P/E (EV/NOPAT) | 40.4x | 36.7x |
| Unlevered P/B (EV/NOA) | 6.11x | 5.73x |
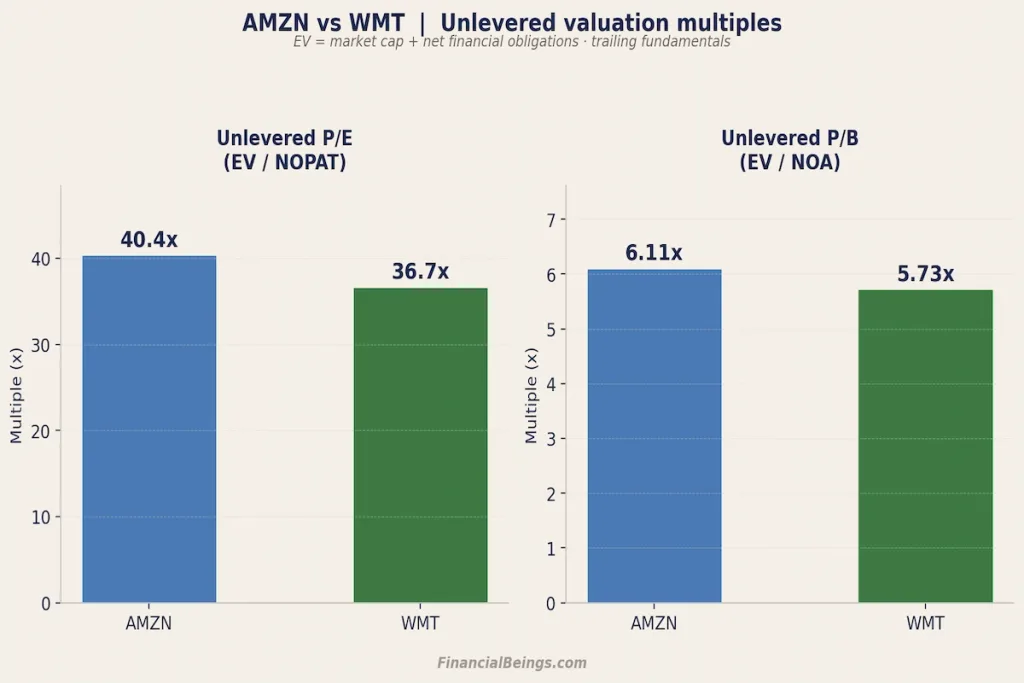
On an adjusted basis, Amazon is still cheaper, by 7 points rather than 17. Not so big a gap as headline numbers make it seem.
The actual twist, here. The final two rows are an “unlevered” valuation that excludes debt, a way of evaluating each company based solely on its operating metrics. Net operating profit after tax, profit from the business, ignoring financing, is known as NOPAT. The multiple is now Amazon at 40.4 times operating profit, compared to Walmart’s 36.7 times. Flip the lens, and Amazon looks like the more expensive stock.
What Each Stock Needs to Deliver
In addition, we used a residual income model – what growth rate must a company maintain in perpetuity to deserve the price based on that cost of capital? – at 10%. Use this as a sensitivity analysis, not a price target – it’s a way to see what the market is betting on!
Table 4: Modeled Value Per Share at Different Growth Rates
| Growth Rate (g) | Amazon Modeled Value | Walmart Modeled Value |
| 2% | $81 | $29 |
| 4% | $95 | $34 |
| 6% | $124 | $44 |
| 8% | $210 | $75 |
| 8.5% | $267 | $95 |
| Current price | $254.92 | $105.92 |
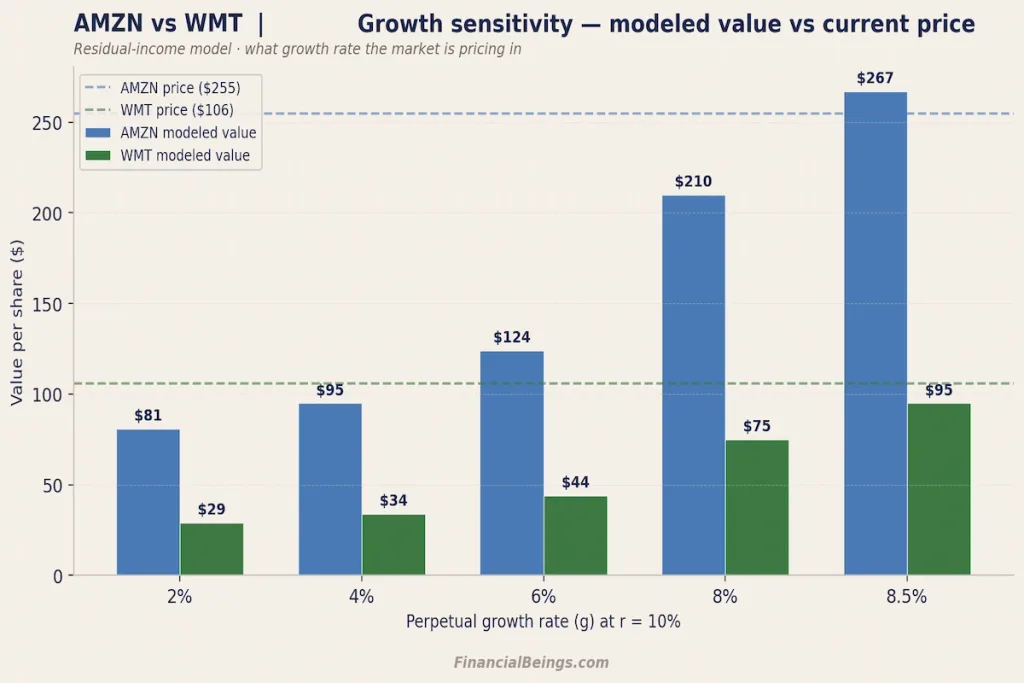
Amazon would have to grow by around 8.4% a year in perpetuity to defend today’s valuation, while Walmart would need to grow by 8.7% a year indefinitely. With a modest 5% assumption, the model supports about $107 per share for Amazon versus its current $255 share price, and about $38 per share for Walmart versus its current $106. Neither stock is worth that much if there were a slowdown. For a longer-horizon view of what Amazon’s valuation implies decades out, see our Amazon Stock Price Prediction 2050.
The key drivers of Amazon’s growth case are its AWS backlog, growing ad margins, and operating leverage, with profits outpacing revenue. The conservative case is that its AI spending is heavy and its profit is driven by one division. Walmart’s growth case rests on Walmart Connect and ecommerce, while the conservative case is a consumer slowdown. For a closer look at how Walmart stacks up against another major retail rival, see our Walmart vs Target stock comparison.”
Cash Flow, Capex and Capital Returns
Cash flow is a measure of company performance that shows a company’s remaining cash after paying its bills, not accounting profit. Free cash flow (FCF) = Cash from operations minus capex (cash spent on equipment and other long-term investments).
Table 5: Cash and Shareholder Returns
| Metric | Amazon | Walmart |
| TTM Free Cash Flow | −$7.6B | +$14.9B |
| Capex guidance | $220B | Not disclosed |
| Dividend | None | $0.99/share, 0.93% yield |
| Dividend streak | — | 53 consecutive annual raises |
Amazon has an intentional negative FCF, investing in AI infrastructure. A sign of future growth, not necessarily a red flag, but it’s a sign that you don’t have any spare cash at this time, and it could be interesting to see if that distance diminishes in the next couple of quarters. Walmart turns profits into real cash and has increased the dividend payout for 53 consecutive years, thus earning the nickname “Dividend King.” If you want to know more about steady dividend payers, check out our highest dividend paying stocks.”
A slight downer: Walmart’s 0.93% yield is lower than the average of the S&P 500 at 1.05%, at today’s price. Curious how Walmart’s cash generation and returns compare to another retail giant known for efficiency? Check our Walmart vs Costco stock analysis.
The Risk Nobody Puts on the Growth Case Slide
Each strength is accompanied by a shadow. AWS accounts for 21.0% of Amazon’s revenue but 60.5% of operating income – good for profits, bad for Amazon if cloud demand slows and/or competition beats them on pricing.
A stock with a beta of 0.61 should be a more subdued and defensive investment, as in the case of Walmart. No one was spared this year. Walmart still fell 21.6% from its May high to $105.92. Disappointing reports show that even when stocks aren’t volatile on paper, they can be volatile in reality, and investors who held Walmart for safety received a lesson.
Walmart vs Amazon Stock: The Verdict
So, Walmart vs Amazon stock: which one deserves your money? Here’s a real answer, not a shrug.
Amazon is for investors with at least five years in the future who don’t mind volatility and who are willing to take the risk that the company might be spending money to create something larger. Walmart is for a player that’s looking for a steadier platform, a true dividend history, and retail exposure without playing in the AI game. This same ‘safer growth vs high-risk growth’ trade-off shows up elsewhere in tech too — see our MSFT vs CRM comparison. Both answers are correct; it’s just that they cater to different types of investors who have different tolerances for waiting.
However, don’t sugarcoat the following points. Amazon’s valuation advantage is genuine, but about half of what it appears to be in the hype around the P/E figures. Walmart’s share-price decline in August was not because the company was losing sales; it was only that investors were willing to pay less for the same earnings.
Both stocks are valued for bold futures, and neither is as clear-cut as the headline numbers suggest.
FAQ
Is Amazon cheaper than Walmart?
On headline numbers, yes, but that’s misleading due to a one-time accounting gain. On forward P/E, Amazon trades at 28.76x compared to Walmart’s 35.60x, which is still a gap, but a smaller one.
Why did Walmart stock drop after its August earnings?
Walmart’s revenue topped expectations and revised up guidance, but GAAP earnings fell short, some of which was due to tariff refunds, and the outlook for the next quarter was downbeat.
Does Amazon pay a dividend?
No. Amazon is reinvesting cash in growth areas, including AWS infrastructure and AI capacity, instead of returning it to shareholders.
Which stock performed better in 2026?
Amazon. Walmart passed a $1 trillion market value on Feb. 3 and hit an all-time high of $135.16 on May 19, then fell 21.6% to $105.92 after its August earnings. Amazon approached a $2.8 trillion valuation in August and trades at $254.92.
Should I own both?
Many investors do. Amazon is on the path of greater volatility due to AI and cloud growth, while Walmart provides dividend income and steady retail exposure. The appropriate mix will depend on how long you plan to keep your investment and on your risk tolerance.
Sources
- Amazon Q2 2026 earnings release (July 30, 2026) — View source
- Walmart Q2 FY27 earnings release (August 20, 2026) — View source
- Walmart Q2 FY27 presentation PDF — View source
- SEC EDGAR filings (AMZN & WMT) — View source
- StockAnalysis – Amazon (AMZN) — View source
- StockAnalysis – Walmart (WMT) — View source
