
Imagine two investors. One buys Amazon shares on December 31, 2025, at $230.82 each. The other waits, then purchases the same shares on August 1, 2026 at $274.48. Seven months apart. Same company, same warehouses, same cloud-based business, same balance sheet. Amazon hasn’t even published a new annual report in that period.
But the second investor paid 18.9% more for the same thing.
That’s the whole of this article. What transpired in those seven months isn’t really about Amazon. It’s about what others believed in Amazon’s future, and belief is costly.
That is where the majority of the Amazon Stock Price prediction 2050 fall short. They choose a number that sounds impressive, feed it forward for the next twenty-four years and give you a number with two decimal places, much like the weather forecast. It isn’t.
It’s an assumption in spreadsheet garb. This piece attempts something more meaningful: it reveals exactly how much the current Amazon stock price is betting on the future, and what will happen to your money in a few reasonable scenarios.
Why Amazon Can’t Just Repeat Its Past
Amazon has been a phenomenal investment. Since August 2002, it has grown at roughly 27.9% a year. It is a real number, but it is a very particular one: immediately following the dot-com bubble burst, when Amazon’s stock price was low and a lot of people overlooked it. If you take a measure from the end of 1999, the growth rate is around 17.4% a year. Both numbers are true. They simply tell different stories depending on where you begin the clock.
There is a more difficult question to the first, however, which is size. Amazon today is worth $2.96 trillion. That’s about 9 percent of the United States GDP, and it’s located within one company. At the growth rate the market currently prices in, where Amazon’s operating business is expected to grow at 8.55% a year, forever, its revenue would be approximately $5.1 trillion in 2050. It would be the equivalent of 6.7% of the total US GDP produced by one company. No business has come near that.
None of this is to say that Amazon is a bad business. It basically means the easy days of doubling up and tripling up are past and now it’s just a fact that the numbers are so big that you cannot afford to double or triple anymore, it’s just a mathematical mountain.
What “The Market Is Paying For” Actually Means
Here’s a concept worth understanding, because it drives everything else in this article: market-implied growth.
Imagine you are trying to figure out what something is worth, but you don’t know the value. Once you have an idea of a company’s earnings, and an idea of how much people are willing to pay for the stock, you can proceed backward and ask yourself: what rate of growth would make this price justifiable? That’s the growth rate that people took for granted, not any prediction that was shouted from the rooftops, but the figure that was secretly incorporated into the price by those who buy and sell the stock.
If Amazon is valued by the 10% required return, which is the lowest return that investors would expect to earn annually when holding a stock with this level of risk, that growth rate is implied as being 8.55%. This is the assurance that’s embedded in the current Amazon Stock Price — the same method reveals what growth rate Google’s stock price is actually pricing in. Not some analyst’s estimate, a figure pulled right out of what real buyers are paying.
A Seven-Month Gap That Explains a Lot
Return to those two buyers. At the lower price of $230.82, the markets were suggesting that Amazon will continue growing at 8.21% for eternity. That number had risen to 8.55% by the time the later price of $274.48 was reached. A difference of just 0.34 percentage points.
That sounds small. It isn’t. The additional optimism over these 25 years is the difference between one buyer earning 10.0% a year to 2050, and the other buyer being about 0.8 percentage points a year behind for the life of the position held. The later buyer didn’t purchase a worse company.
When the market as a whole had decided to ask a little more from them, they purchased the same company at a time when there was nothing new to warrant that. It’s the danger with any stock that’s popular that the investor is not gambling on the business, he’s gambling on the level of optimism that is reflected in the stock.
Is the Market Actually Being Greedy?
Let’s add a twist to the interpretation that would be purely cautionary. Over the past 80 months (nearly 7 years) the market’s implied growth rate for Amazon’s stock has varied from 7.91% to 9.60%, with an average growth rate of 8.97%. The 8.55% today is in fact in the 24th percentile of all of these times. Simply put, people aren’t asking as much of Amazon as they typically do, they’re asking less.
Then, is Amazon costly or inexpensive? Both are correct responses, given a time frame. Today’s implied rate is higher than a year ago, but lower than it has been, on average, over the past seven years. The one thing that has changed under all of this is the size of the machine that promise has to come through. At the end of 2021, Amazon’s net operating assets which include the capital invested in its servers, equipment and warehouses were $174 billion, and they now exceed $526 billion. About three times the capital is now at stake.
The Engine Room: Is the Money-Making Actually Working?
The numbers aren’t necessarily reliable when they come from someone who’s predicting future prices; look beneath the hood.
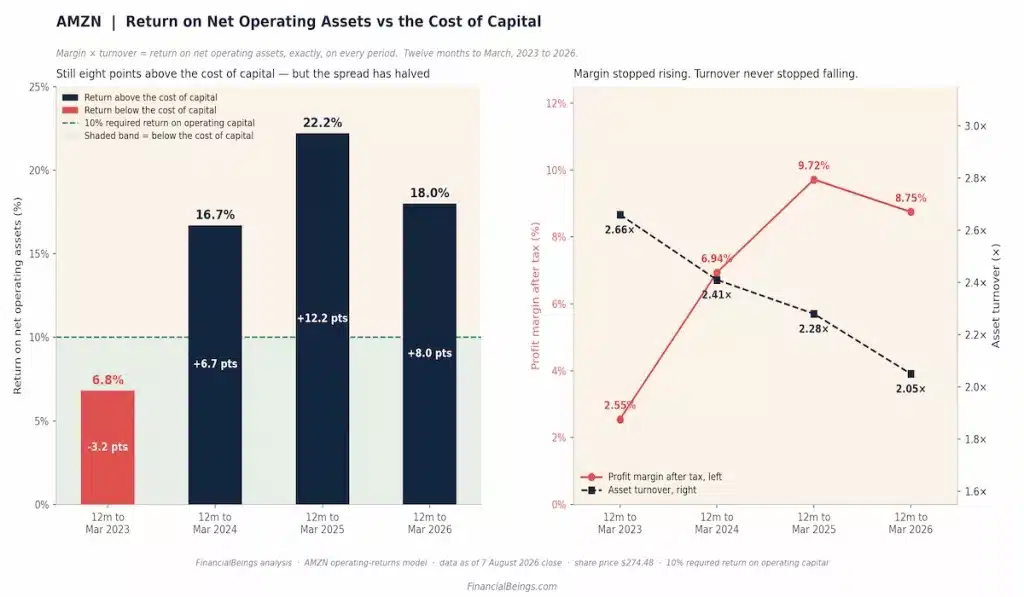
Amazon is currently generating roughly 18.0% return on operating capital, while it costs them 10.0% on the same capital, or 8.0 percentage points above its cost of capital, they are truly generating value, not just wasting capital. However, the trend is more important than the snapshot. It peaked at 22.2% in the twelve months to March 2025 and has dropped since then.
Amazon’s profit margins have also flattened and, more strikingly, its asset turnover has slipped in each of the periods since the twelve months to March 2023, from 2.66 times to 2.05 times — a trend worth comparing against other AI data centre stocks. That spread was even negative as recently as March 2023, before the business bounced back.
That doesn’t mean Amazon is a bad company. It means a business that still has its engine ticking over but is being expected to take on more weight than ever before, with indications that the transmission is beginning to shift slightly.
What $274 Today Could Become
In this context, this is the range of values to keep in mind with varying long-term growth rates:
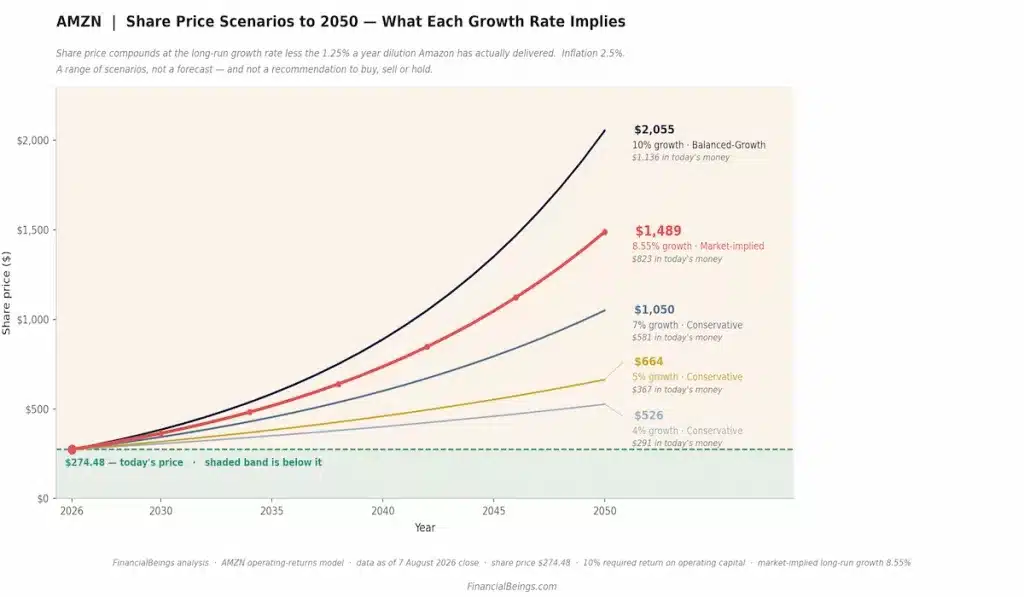
With a 4% conservative growth rate, shares will be valued at $526 by 2050. At 5%, about $664. At 7%, roughly $1,050. The market is at 8.55%, with an implied value of approximately $1,489. At an aggressive 10%, around $2,055.
If you factor in inflation, what that money would have bought in current dollars, the market-implied scenario comes closer to being $823. This translates to a real annual return of about 4.7%, which is solid, but far less than the historic rate of Amazon Stock Price appreciation and a reminder that the sky is not the limit for Amazon Stock Price gains.
This ladder isn’t evenly spaced, either. An increase in growth from 4% to 5% will increase the value of each share by approximately $11. Moving from 7% to 8% adds $57. Close to the top, changes in assumptions can make a significant difference that’s why any single, definite number for 2050 tends to overlook the important part of the analysis.
Why No Single Number Should Be Trusted to Two Decimal Places
Simply change one reasonable accounting decision (the year to use in the capital base) and today’s calculated value ranges from $274 to $195, a 29% difference that most readers would never even notice. If the starting date is shifted by 7 months (as in the comparison above), then the 2050 figure falls by about 16%. Do the right thing with the shares that Amazon gives to its employees each year, and another 27% is gone.
There are no errors in any of these. Each is a defensible choice. That’s right, a 2050 price is not a fact that’s just waiting to be discovered. It is one assumption, multiplied by itself twenty-four times.
Keep in mind that Amazon was a struggling online bookstore in 2002. Its now-cloud-based business arm, Amazon Web Services, didn’t exist and wasn’t launched for another four years, and today it earns the bulk of Amazon’s profit. At the time, there was no row for this projection. The most important unknown variable influencing Amazon’s next 24 years by far is something nobody has thought of yet.
What Would Actually Change This Picture
There are two developments to watch. First, does the spread between Amazon’s returns and its cost of capital stabilise at around ten points instead of continuing to converge toward eight, which would mean the company is finally beginning to make the big capital expenditures pay off? Second, what happens if the market’s implied growth rate falls back to the 8.0% it accepted as recently as March 2026, which on today’s fundamentals implies a materially lower share price?
Looking at the return on capital and seeing whether asset turnover continues to drop below 1.6 times, as well as watching that 18% line, will be a better indicator of Amazon’s price direction than any individual 2050 forecast can be. If you’d like to know more about how Amazon compares to a traditional retail giant, see our breakdown of Walmart vs Amazon stock.
Frequently Asked Questions
What will Amazon stock be worth in 2050?
There is no single defensible figure. Based on the growth rate currently priced into Amazon’s shares, the central case is roughly $1,400 to $1,550 a share by 2050, or about $775 to $860 in today’s purchasing power after accounting for inflation.
How is Amazon’s 2050 stock price estimated?
The estimate compounds today’s share price forward at a chosen long-term growth rate, minus roughly 1.25% a year for shareholder dilution, then adjusts for 2.5% assumed annual inflation. Different growth assumptions produce a wide range of outcomes.
What growth rate is Amazon’s stock price assuming right now?
At a 10% required return, today’s price implies Amazon will grow its operating earnings at about 8.55% a year, indefinitely. That figure is derived mathematically from the current price, not from any published company guidance.
Is Amazon’s return on capital rising or falling?
It is still well above its cost of capital, about 18.0% against a 10% benchmark, but the return has fallen from a peak of 22.2% roughly a year earlier, as asset efficiency has declined for several consecutive periods.
Why do 2050 price predictions vary so much between sources?
Small differences in starting assumptions, the growth rate, the starting date, dilution, or accounting treatment of capital, compound over twenty-four years into very large differences in outcome, which is why equally defensible inputs can still produce widely different final numbers.
