We analyze ExxonMobil, Chevron, and ConocoPhillips based on their value creation for shareholders, dividend quality, and FCF in order to find the best oil stock for 2026.
Introduction
By the year 2026, the oil markets will be in a range that is narrow yet uncertain due to softened demand expectations, energy transition pressure and stricter capital discipline among producers. To investors, this leaves a critical decision mark among three giant U.S. oil stocks: ExxonMobil (XOM), Chevron (CVX) and ConocoPhillips (COP). They all have a similar exposure to the commodity cycle, yet with extremely dissimilar business models, capital allocation approaches, and, most critically, valuation profiles.
This article ranks XOM, CVX and COP based on the economic value creation for shareholders model along with dividend quality ranking. Instead of looking at the returns or headline earnings in the past, the analysis looks at the extent of real economic value each firm brings about compared to its cost of capital, and whether existing market values make sense of those fundamentals.
The analysis of the valuation is easy and straightforward: Chevron (CVX) is a value-investment, whereas ExxonMobil (XOM) is overvalued, and ConocoPhillips (COP) is also overpriced on the basis of several key factors.
As the oil prices are projected to be cyclical and the uncertainty surrounding policies into 2026, the investors are no longer being rewarded with the benefit of owning any type of energy stock. The question is not which company is the strongest in terms of operations, but which stock will provide the best combination of valuation, sustainability of dividends, and long-term creation of economic value.
| Company | NOA ($B) | Operating Liabilities ($B) | RNOA (Peak → Latest) | EVC ($ Peak → Latest) | Growth Required for Fair Value | Overall Trend | Final Valuation Verdict |
| COP | ~42.0 | ~56.4 | ~30% → ~11.7% | 11.77 → 2.24 | ~6.5% – 7% | Declining profitability & value creation | Slightly Overvalued |
| CVX | ~209.1 | ~114.9 | ~50% → ~4.6% | 12.60 → 2.64 | ~2% | Strong fundamentals, stable value creation | Undervalued (Best Pick) |
| XOM | ~272.1 | ~166.2 | ~100% → ~8.3% | 10.35 → 4.15 | Not achieved (≤7.5%) | Volatile returns, inconsistent value | Significantly Overvalued |
Overview – Three Oil Giants, Three Different Investment Cases
The U.S. oil industry is characterized by the dominance of three large players, namely: ExxonMobil, Chevron, and ConocoPhillips, but even though these companies perform in the same business, their business models, capital structures, and value creation profiles differ significantly.
ExxonMobil (XOM)
ExxonMobil is the biggest U.S integrated oil major that operates upstream (exploration), Midstream (transport) and downstream (refining and chemicals). ExxonMobil has increased notably in its Net Operating Assets (NOA) to around $272B, and operating liabilities have also increased to around $166B, implying a capital-heavy structure.
This is indicated by its highly volatile RNOA, which reached an all-time high just above 100% but then fell sharply to an average of 8.3% in the latest period. For a deeper breakdown of ExxonMobil’s valuation, performance drivers, and fair value outlook, read our detailed analysis on Exxon Mobil stock forecast 2025 fair valuation.
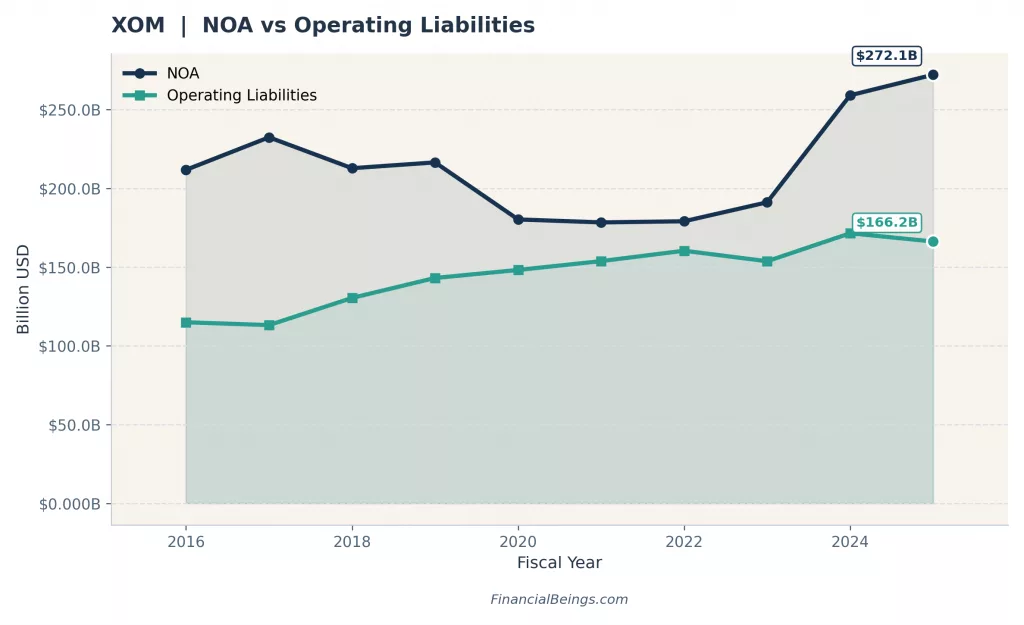
Figure 1: Net Operating Assets vs Operating Liabilities – ExxonMobil
Chevron (CVX)
The second largest in the U.S. integrated oil companies, Chevron, has a solid upstream base and a rigorous capital allocation policy. Recent events have seen the incorporation of the Hess acquisition project and LNG development projects like Tengiz, which means that the company can grow its production over the long-term.
Chevron has the most balanced financial profile compared to the other two companies. Its NOA rose to approximately $209B whilst its operating liabilities stand at a lower level of approximately $115B, which suggests that its operating structure is asset-based.
Even though RNOA has decreased since the highs (more than 50%), to approximately – 4.6% in recent times, it is a consistently positive indicator over the cycle.
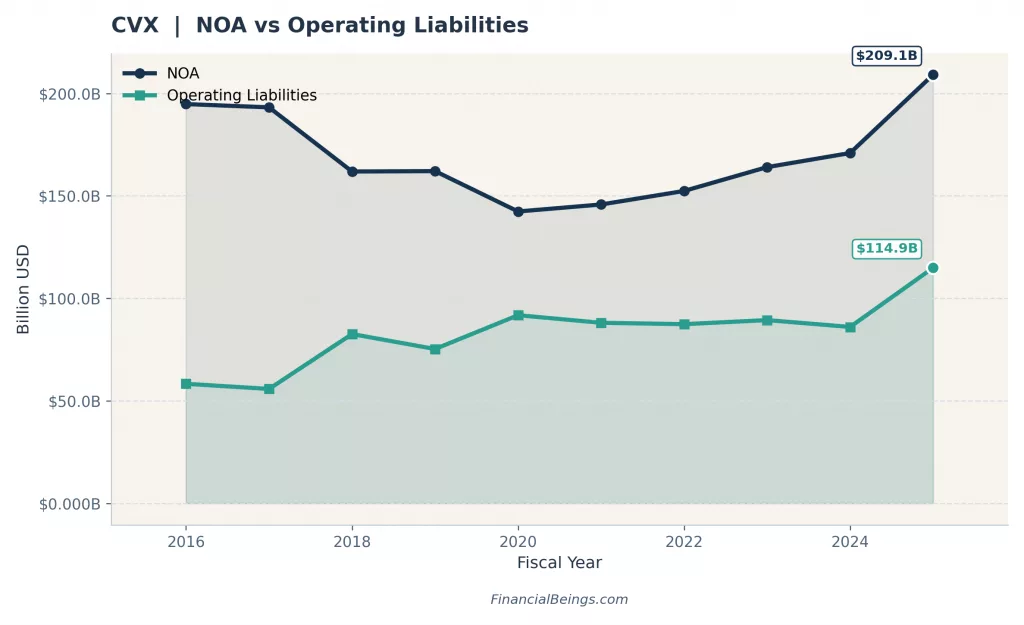
Figure 2: Net Operating Assets vs Operating Liabilities – Chevron
ConocoPhillips (COP)
ConocoPhillips is not structurally like ExxonMobil and Chevron. It is a pure-play exploration/production (E&P) company, implying that it has no downstream or refining unit to balance the earnings. It leads to increased sensitivity to changes in oil prices, but also gives an opportunity to have a lower cost structure and flexibility in operation.
COP operating liabilities have increased to about $56.4B, which is more than its NOA of about $42B and has a lower operating base than integrated majors. Furthermore, it has very high volatility in its RNOA, which remains in the negative territory (approximately -10 percent), then reaches high volatility to levels of about 30 per cent, and then stabilizes at an annual rate of about 11.7 per cent last year.
Most importantly, it has a significant drop in its economic value creation of $11.77 to $2.24, which indicates that though COP is able to provide good returns in favorable environments, its value creation is not a steady portfolio. For a deeper outlook on its future performance, see this detailed analysis: ConocoPhillips Stock Forecast 2025
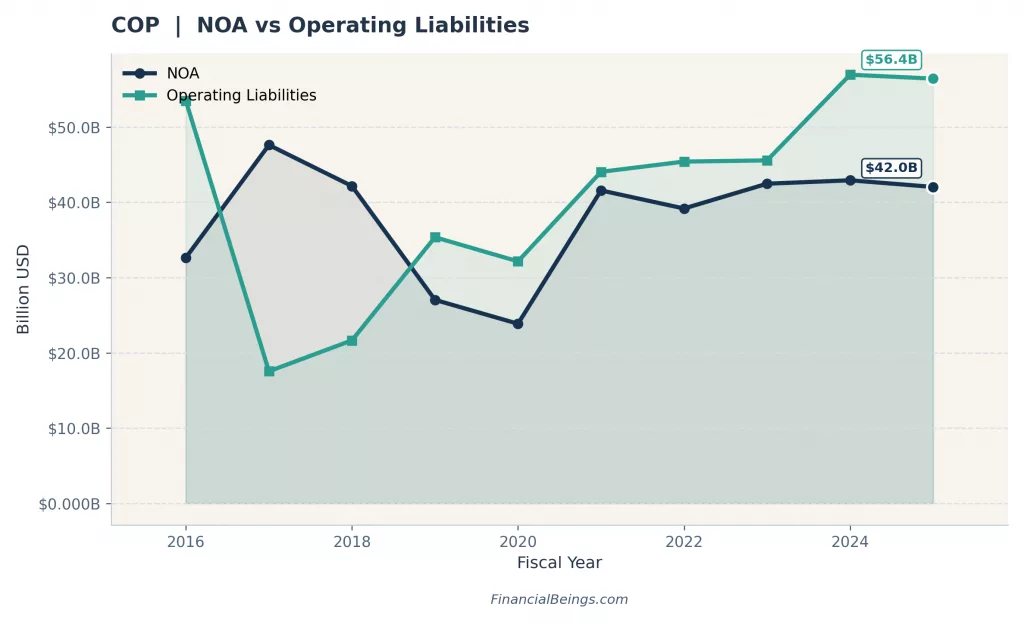
Figure 3: Net Operating Assets vs Operating Liabilities – ConocoPhillips
| Metric | XOM | CVX | COP |
| Market Cap (approx. 2025) | ~$712B | ~$422B | ~$164B |
| Primary Model | Integrated major | Integrated major | Pure-play E&P |
| NOA (Latest) | ~$272B | ~$209B | ~$42B |
| Operating Liabilities | ~$166B | ~$115B | ~$56B |
| RNOA | ~8.3% | ~4.6% | ~11.7% |
| Value Creation Trend | Volatile | Stable positive | Declining |
Stock Performance & Total Returns – 2024 to 2026
This section will review the total shareholder returns of ExxonMobil, Chevron and ConocoPhillips in the last 1 and 3 years. These values are dividend-adjusted, which is the total earnings the investor obtains, including both the increase in stock price and dividends paid. Although the performance trends prove helpful in forming an opinion about the way the market has been rewarding each company so far, they do not form part of the investment value in terms of the analysis. Rather, the overall suggested recommendation is based on the economic value creation (EVC) framework, which is oriented on sustainable returns that exceed the cost of capital.
Total Shareholder Returns
| Metric | XOM | CVX | COP |
| 1-year total return | 52.73% | 33.71% | 35.42% |
| 3-year total return | 82.92% | 53.62% | 55.12% |
Performance Interpretation (vs Energy Sector)
ExxonMobil (XOM) produced the best returns in both time spans, easily beating Chevron and ConocoPhillips. The recent acquisitions have also contributed to this performance through the growth in upstream, increased realized oil prices, and efficient use of capital. Nevertheless, these high returns are usually an indication of optimism in the market that is already reflected in the stock price, and this may result in high valuation rates.
Chevron (CVX) produced less dramatic returns and was more consistent and stable. Its performance is closely related to the sector averages, which represent disciplined capital allocation and a balanced, integrated business model. Even though it was not as profitable as the performance of ExxonMobil in short-run terms, its profile of returns indicates fewer fluctuations and a more sustainable performance over the cycle.
Compared with Chevron, ConocoPhillips (COP) generated almost the same returns with a little bit more variation in the short term. Being a pure exploration and production firm, it is more directly exposed to the oil price changes. This is the reason why its returns follow the commodity cycles closer, thus favoring a good pricing market, but it has no diversification like that of integrated majors.
It is imperative to note that the basis of the investment recommendation is not historical returns. Good history performance, such as that of ExxonMobil, can be indicative of good external environment conditions as opposed to sustainable value creation. The EVC model is a prospective intrinsic value measure, which assesses the nature of companies in generating returns that are in excess of their cost of capital.
Valuation Analysis (Interactive Chart)
The valuation herein is done based on the Economic Value Creation (EVC) model, which determines whether a company produces returns that are higher than its cost of capital. The model does not measure accounting profit, but the actual economic profit after capital is used. This is especially relevant in capital-intensive markets such as oil and gas, where huge asset bases can skew conventional measures. The model estimates intrinsic value and margin of safety by taking profitability (RNOA), capital employed (NOA) and growth expectations.
| Growth (%) | COP | CVX | XOM | ||||||
|---|---|---|---|---|---|---|---|---|---|
| Intr. Value ($B) | Price / Share | V/P % | Intr. Value ($B) | Price / Share | V/P % | Intr. Value ($B) | Price / Share | V/P % | |
V/P > 100% = The stock screens undervalued under that growth assumption. V/P < 100% = The stock screens overvalued; the market price is ahead of the model value. V/P = 100% = Intrinsic value equals the stock’s current market cap at that scenario.
CVX starts above current market cap at the low end of the range, posting 105.7% V/P at 2%. COP crosses above current market cap between 6% and 7%, reaching 157.3% V/P at 7%, while XOM never reaches current market cap and tops out at 70.3% V/P at 7.5%.
Note: All scenarios use an 8% hurdle rate.
| Valuation Metric | XOM | CVX | COP |
| Valuation Basis | RNOA + NOA (2025) | 5Y Avg RNOA + NOA (cyclical) | RNOA + NOA (2025) |
| Market-Implied Growth Rate (8% hurdle) | 7.83% | 2.75% (5Y avg basis) | 6.52% |
Key Methodology Note – Chevron (CVX)
The valuation of Chevron is based on the 5-year average of the RNOA (16.21%) and the 5-year average of the NOA (approximately $168.4B) as opposed to the downcast figures in 2025. This change is needed because the oil industry is cyclical in nature. The 2025 RNOA of CVX is approximately 4.6%, which is not the real earning power. Intrinsic value would be grossly understated by using a weak year. Thus, the 5-year average will give a better idea of performance in the through-cycle, and the valuation would be more credible to long-term investors.
Interpretation of Valuation Results
The valuation of the three companies will definitely show a significant difference.
ExxonMobil (XOM) is significantly overpriced to its intrinsic value, and the market is factoring a 7.83-per cent growth rate in the long-term. This is an abnormally large growth as an established oil major and is out of the bounds of realistic expectations in the sector. This model shows a premium of about 59%, which suggests that the investors are paying a lot more than the fundamental value. This indicates low upside and high downside risk, especially when the growth expectations are not realized as seen in the case of a long-term value investor.
Chevron (CVX) has the best valuation argument. The stock is conservatively priced, which is below its normalized earnings capacity with a market-implied growth rate of 2.75%. The model shows that the margin of safety is 65.8%, which means that CVX is mispriced to a great extent. The biggest risk to this opinion is, however, the timing of oil price cycles. In the case of weak oil prices, the extrinsic material might take time to achieve intrinsic value, although the underlying fundamentals are high.
ConocoPhillips (COP) is the one that relates to fair value, but has a premium of 10.9%, which means that its growth rate should be 6.52% in order to consider its actual price. This is higher than the normal levels of sustainable growth of oil companies of about 5 per cent. Consequently, COP is a bit overvalued, and there is no room to go wrong. This implies that entry-level is important to investors because returns will be susceptible to weaker oil prices.
Dividend Quality Analysis
The quality of dividends is more important in oil than the headline yield alone, as payments fluctuate with the state of the commodities. When the crude becomes soft, the significant test is whether the dividends can be maintained or only when the cash flow is high.
| Dividend metric | XOM | CVX | COP |
| Payout ratio (%) | 61.49% | 107.39% | 52.83% |
| FCF dividend coverage ratio | 1.37x | 1.30x | 1.81x |
| Consecutive years of dividend growth | 40+ years | 36+ years | N/A — base + variable model |
| Dividend Aristocrat status | YES | YES | NO – base + variable |
Durability is the beginning of the dividend strength of ExxonMobil. The short-term forecasts have 40+ consecutive years of dividend growth, and the 2025 performance of ExxonMobil indicates that the annual per share yield of dividends has increased by 43 years. Such a streak is significant since it represents management discipline through several cycles of the oil market rather than one successful cycle. Investors will inherently appreciate such consistency. Investors will inherently appreciate such consistency. For more dividend-focused investment opportunities, explore our analysis of the best dividend stocks to buy.
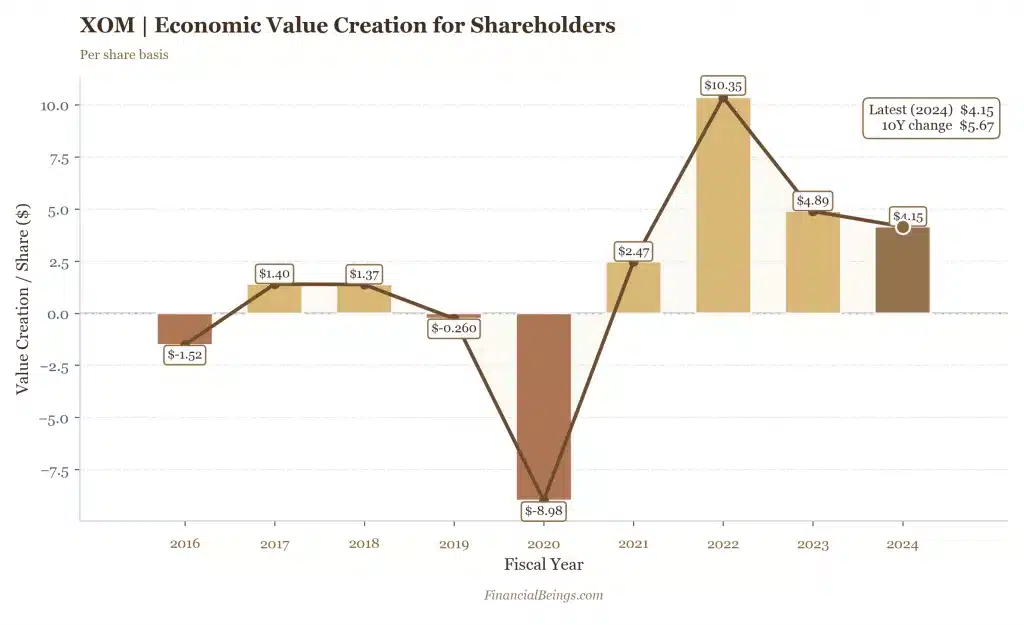
Figure 4: XOM – Economic Value Creation (EVC)
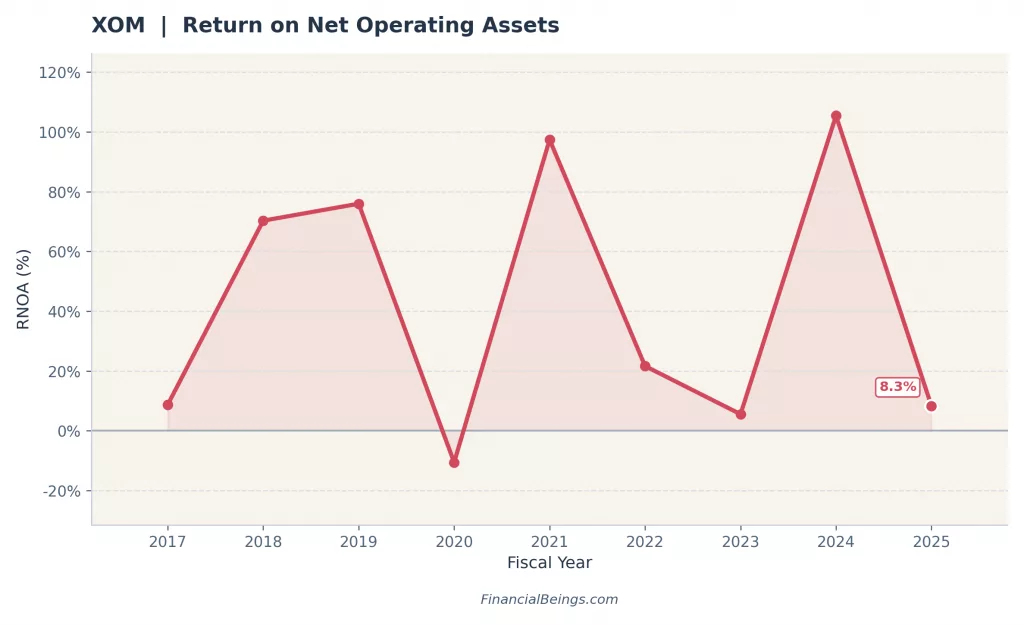
Figure 5. XOM – RNOA Trend
Chevron’s case is different. Its current ratio of payout is greater over the short term, but the larger dividend argument is based on the strength of the balance sheet and normalized cash-generating capability. The dividend sustainability, which is supported by Chevron in 2025, will have 38 years of higher annual dividends.
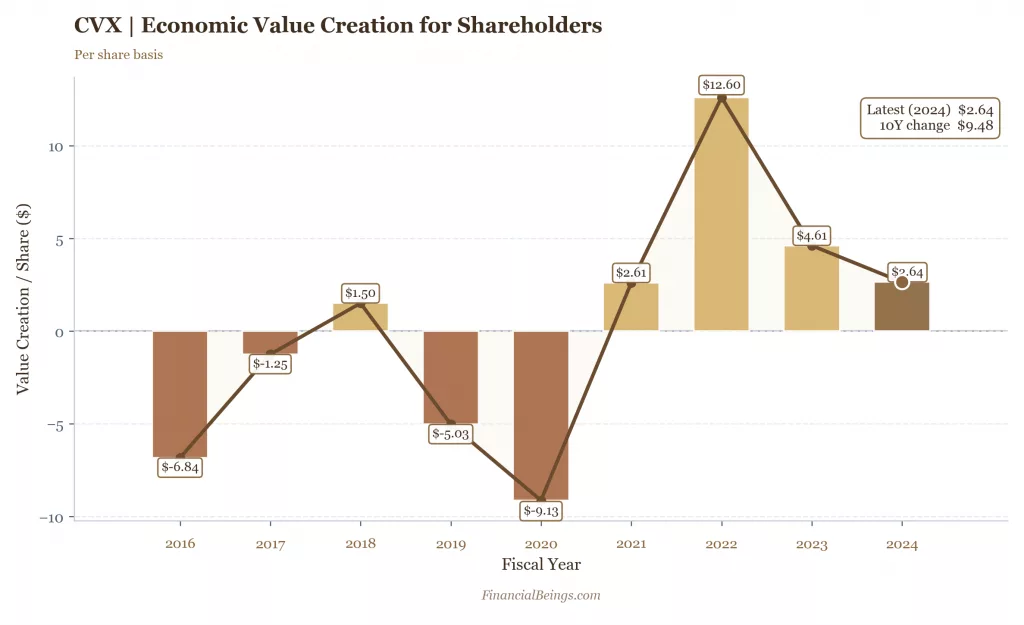
Figure 6. CVX – Economic Value Creation (EVC)
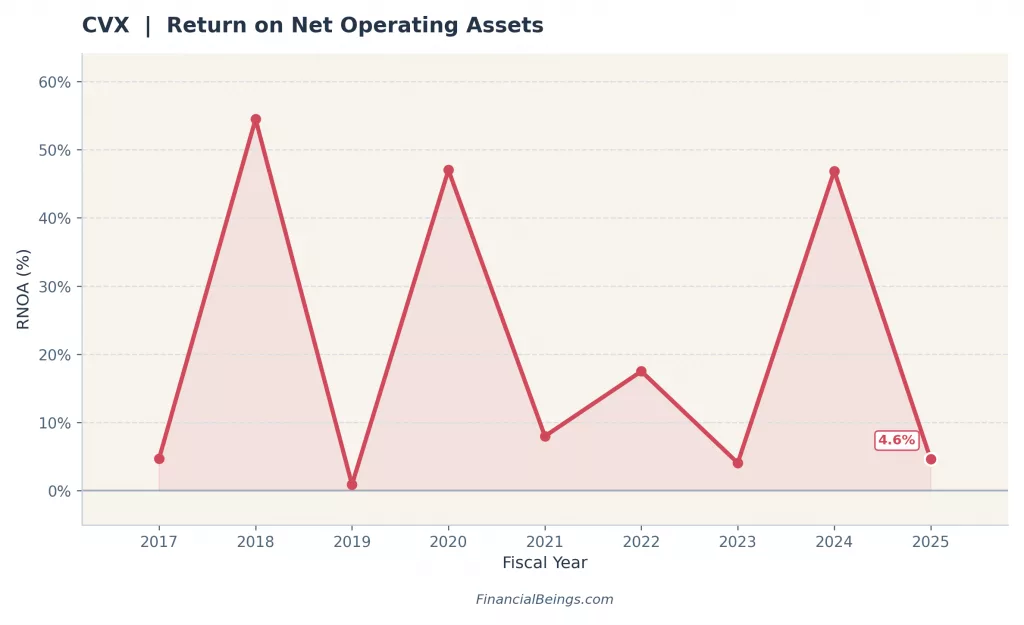
Figure 7: CVX – RNOA Trend
ConocoPhillips requires the least explanation as its model is not the ordinary pattern of a combined major dividend narrative. COP has a base dividend and variable capital-return structure. That can be appealing when oil is strong since the management will be able to spread additional cash, but it is not as predictable as the traditional Aristocrat model. It shows the best FCF dividend coverage ratio of 1.81x, which is positive, but the lack of a long-term dividend-growth streak makes the income case not so defensive as the XOM or CVX. In early 2026, ConocoPhillips also announced that it would repurchase 45% of its shares, and this better suits a more flexible return-of-capital method.
The integrated-major model would remain the most sustainable dividend profile in a lower oil-price environment, and in that, Chevron would be more value-based and Exxon more streak-based.
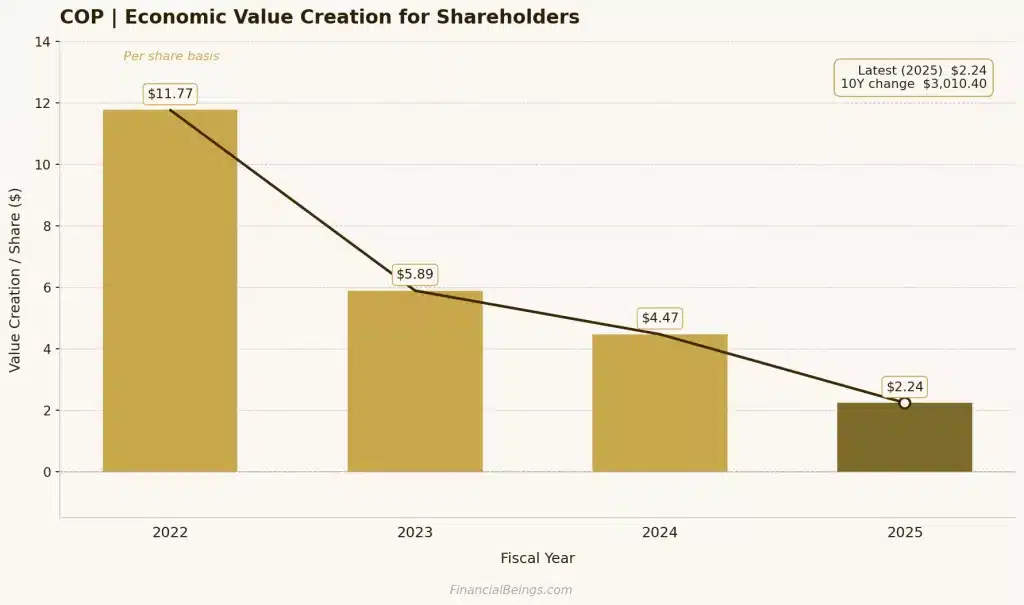
*4Y change is $-9.53
Figure 8: COP – Economic Value Creation (EVC)
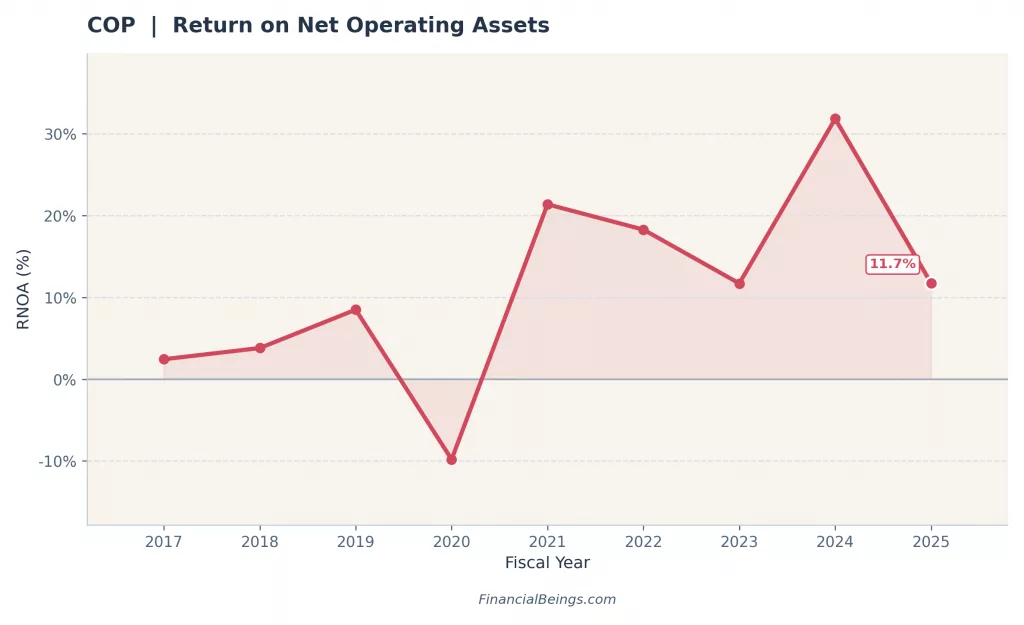
Figure 9: COP – Economic Value Creation (EVC)
Balance Sheet & Free Cash Flow
If oil is going back, which firm does not have to struggle with the balance sheet to finance dividends, buybacks and CAPEX? That is the real test for 2026.
| Metric | XOM | CVX | COP |
| Net debt / EBITDA | 0.48x | 0.83x | 0.66x |
| Free cash flow yield (%) | 3.31% | 3.93% | 4.43% |
| Capital return yield (buybacks + dividends, %) | 5.26% | 5.88% | 5.57% |
| Capex / revenue (%) | 8.76% | 9.41% | 21.30% |
XOM has the best position at 0.48x net debt to EBITDA at the point of raw leverage. That provides Exxon with greater financial flexibility than the market may sometimes realize. However, balance-sheet strength is not the only thing in this section. It has something to do with what the investors are paying for that strength, and XOM still looks overly expensive in comparison with intrinsic value.
The balance between financial quality and valuation is the most optimal in Chevron. It is still prepared with a leverage of 0.83x, an FCF yield of 3.93% and the capital return yield is the highest at 5.88%. That does not put Chevron immune in a $70 oil scenario, but it does make the stock a less difficult own, since the investors are not paying a high premium on the business. For a deeper analysis of its outlook, see the Chevron stock forecast 2025, which provides additional context on its valuation and long-term performance.
ConocoPhillips has the highest FCF yield of 4.43% that is attractive at face value. The catch is CAPEX intensity. At 21.30% of revenue, COP is much more CAPEX-intensive than the integrated majors. That increases the cash-allocation tradeoff in a softer oil environment. COP is not dead yet, but it is structurally less flexible than Chevron and has less downstream cushioning than Exxon.
2026 Catalysts & Key Risks
In the case of ExxonMobil, the key driver is further Pioneer integration and deeper Permian output optimization. The biggest risk is that the valuation is already showing excessively sustained improvement. Exxon does have a real operating narrative, although the stock is valued as though the narrative needs to continue performing at a high rate.
In the case of Chevron, the catalyst is more evident; Hess integration and Tengiz growth provide the company with an apparent road to greater normalized operating performance. The key risk is timing. As long as oil remains weak, the market might remain preoccupied with low spot earnings as opposed to normal earnings capacity.
The catalysts in ConocoPhillips are Marathon integration and synergy capture. In early 2026, the company stated that Marathon integration had already doubled the capture of synergy to over $1 billion on a run-rate basis in 2025. The same attribute is the risk, which generates the upside: COP is the most directly subject to the upstream commodity volatility.
Another aspect that is of concern to the sentiment in the near future is the Jones Act debate. According to official U.S. maritime directions, the Jones Act applies to domestic shipping, where there are U.S.-built, U.S.-owned and U.S.-crewed vessel requirements; thus, any re-waived or re-suspended debate can impact the coastline transportation costs, shipping expectations, and the short-term sentiment of energy markets, even though it does not overhaul the long-run intrinsic value.
The Verdict – Which Oil Stock Is the Best Buy in 2026?
The verdict is Chevron.
CVX has a normalized earnings margin of safety of 65.8%. XOM is overvalued by 59% over the intrinsic value. COP trades on a small 10.9% premium and has a 6.52% implied growth assumption, which is above the 5% threshold, considered aggressive by oil companies.
| Investor profile | Recommended pick | Why |
| Long-term income investor | CVX or XOM, depending on dividend priority | CVX: strong normalised FCF backing dividend; XOM: 40+ yr Aristocrat streak |
| Value/contrarian investor | CVX | 65.8% margin of safety on normalised earnings basis – the widest discount of the three |
| Growth-oriented investor | COP | Pure-play E&P with production growth trajectory and Marathon integration upside — note: COP trades above fair value on the EVC implied g basis (6.52%) |
| Conservative / lower-risk investor | CVX | Strongest balance sheet, highest FCF coverage on a normalized basis, Aristocrat dividend |
Chevron is a winner as it has a combination of the most supportive valuation and a credible operating track. ExxonMobil remains a good company, but the stock price has already incorporated excessive optimism. ConocoPhillips is still an interesting operation, but not at the current price level.
The only circumstance under which the CVX call would vary is having sustained oil prices less than $65 in 12+ months and above, and that would strain the normalized earnings case. At present, however, CVX is the best buy in 2026.
All calculations and valuation estimates are FinancialBeings’ own, based on data sourced from SEC filings of XOM (10K and 10Q), CVX (10K and 10Q) and COP (10K and 10Q). Use or reproduction before prior approval is prohibited.
Frequently Asked Questions (FAQs)
Is XOM or CVX a better long-term buy in 2026?
The best long-term investment is Chevron (CVX). While ExxonMobil (XOM) trades at a ~59% premium to intrinsic value, indicating that its present price already reflects optimistic growth expectations, CVX offers a 65.8% margin of safety. While XOM needs consistent outstanding performance to support its premium, CVX offers a valuation cushion for long-term investors.
What is ConocoPhillips’ competitive advantage vs integrated oil majors?
ConocoPhillips’ primary advantage over integrated majors is its pure-play exploration and production (E&P) approach, which enables a more straightforward and economical operational structure. As a result, COP is more directly exposed to increases in output and oil prices. Although it lacks the downstream security that ExxonMobil and Chevron have, its base variable dividend structure offers flexibility in distributing extra cash to stockholders.
Which oil stock pays the highest dividend in 2026?
Due to their Dividend Aristocrat designation and multi-decade history of steady dividend growth, ExxonMobil (XOM) and Chevron (CVX) continue to have the best dividend reliability. Because of its variable dividend component, COP may provide greater overall cash returns in robust oil markets, but its payouts are less predictable. Therefore, XOM and CVX are more appealing than COP to investors looking for steady and reliable income.
How does the residual earnings model value oil stocks?
By calculating the amount of economic profit made after deducting the cost of capital, the residual earnings (EVC) model determines the value of oil stocks. In cyclical industries like oil, where accounting earnings might vary greatly, this is very helpful. Because Chevron’s (CVX) 2025 earnings indicate a trough and relying on a single bad year would misrepresent its genuine long-term earning power, the company uses a 5-year average profitability strategy.
What happens to XOM, CVX, and COP if oil prices fall to $60?
All three businesses would be under pressure if oil prices dropped below $60, but they would react differently. While Chevron (CVX) would profit from its strong valuation cushion and balanced cash flow profile, ExxonMobil (XOM) would maintain its financial stability due to its low leverage (0.48x) and diverse businesses. Given its direct exposure to upstream activities and higher CAPEX intensity (21.30%), ConocoPhillips (COP) would probably be the most volatile and could need to modify its capital return strategy.
