
Adobe trades around $239.79 per share, but the Financial Beings residual income model estimates its intrinsic value at $244.90 to $331.54 per share under a conservative 3% to 5% long-term growth range. That implies Adobe is not deeply mispriced at the bear-case level, but it becomes meaningfully undervalued once growth expectations normalize even modestly.
Prefer to see Adobe head-to-head with the other software giant? Read our full Microsoft vs Adobe stock comparison for 2026.
The market is currently pricing Adobe as if its long-term growth rate is only 2.83%. That is the core valuation disconnect. Adobe is being valued like a structurally impaired software company, even though the business still shows high margins, strong free cash flow, and an 86.4% RNOA basis in the model.
This is why Adobe is interesting in 2026: the stock does not need an aggressive AI bull case to work. At 3% growth, the model value is already slightly above the current market price. At 4% growth, intrinsic value rises to $281.00 per share. At 5% growth, it reaches $331.54 per share. The investment question is therefore simple: is Adobe really a sub-3% long-term growth company, or is the market over-discounting AI disruption risk?
Our answer: Adobe looks underpriced on a risk-adjusted basis,the range is $245–$332 per share, with expected returns between 7.94% and 9.82% under 3% to 5% growth assumptions.
The table below shows Adobe’s intrinsic value under different long-term growth assumptions using the Financial Beings residual income model. At a 10% hurdle rate, Adobe becomes undervalued above ~2.8% growth, which is close to the current market-implied expectation.
| Growth (%) | Intrinsic Value ($B) | Price per Share ($) | Value/ Price (%) |
| 2.0% | 89.42 | 217.83 | 90.84% |
| 3.0% | 100.53 | 244.90 | 102.13% |
| 4.0% | 115.35 | 281.00 | 117.19% |
| 5.0% | 136.10 | 331.54 | 138.26% |
| 6.0% | 167.22 | 407.35 | 169.88% |
| 7.0% | 219.08 | 533.69 | 222.57% |
What Is Adobe Inc.’s Intrinsic Value in 2026?
Adobe’s intrinsic value in 2026 is estimated at $244.90 to $331.54 per share, based on a 3% to 5% long-term growth range under the Financial Beings residual income model.
With the stock trading around $239.79, this implies a potential upside of approximately 2% to 38%, depending on how growth expectations evolve.
The long-run growth assumption is the single most important driver of Adobe’s intrinsic value. The key insight is that the stock does not require aggressive growth to look attractive.
At a 2% growth rate, the model estimates an intrinsic value of $89.42 billion, or approximately $217.83 per share, which is slightly below the current market price. This effectively represents a pessimistic scenario already priced in by the market.
However, even modest improvements in growth assumptions have a meaningful impact on valuation:
- At 3% growth, intrinsic value increases to $100.53 billion, or $244.90 per share, making the stock slightly undervalued
- At 4% growth, intrinsic value rises further to $115.35 billion, or $281.00 per share
- At 5% growth, intrinsic value expands to $136.10 billion, or $331.54 per share
More than the absolute valuation, the rate of change is what matters.
This analysis shows that valuation support builds quickly, even with small increases in growth expectations. Adobe is roughly fairly valued at 2% growth, becomes undervalued at 3%, and increasingly attractive as growth moves toward 4%–5%.
In practical terms, this means:
Adobe does not need extraordinary execution to justify upside — it only needs modest, sustainable growth.
The Value-to-Price (V/P) relationship confirms the same pattern:
- At 2% growth, V/P is approximately 90.84%, indicating slight overvaluation
- At 3% growth, V/P rises above 100% (102.13%), indicating undervaluation
- At 4% growth, V/P increases to 117.19%
- At 5% growth, V/P reaches 138.26%, showing strong valuation support
This steady expansion highlights how quickly Adobe transitions from fairly valued to undervalued as expectations normalize.
The current market-implied growth rate of ~2.8% sits close to the breakeven level in the model.
This is the core disconnect.
The market is effectively pricing Adobe as a low-growth, structurally challenged business, which is inconsistent with:
- Its historical growth profile
- Its high-margin, recurring revenue model
- Its strong capital efficiency (RNOA ~86%)
As a result, the stock appears to be priced with excess caution, rather than reflecting the underlying strength of the business.
Our Valuation Methodology: Why Residual Income, Not DCF
The Financial Beings model uses the residual income (ReOI) framework, which is better suited than traditional discounted cash flow (DCF) models for valuing companies like Adobe Inc..
DCF models rely heavily on:
- Long-term cash flow projections
- Terminal value assumptions
These inputs introduce significant uncertainty, and small changes in assumptions can materially distort valuation outcomes.
Residual income takes a different approach:
- It starts with book value from the balance sheet
- Measures economic value creation above the cost of capital
- Focuses on return efficiency rather than distant forecasts
This makes the model:
- Better aligned with real business performance
- More stable
- Less assumption-heavy
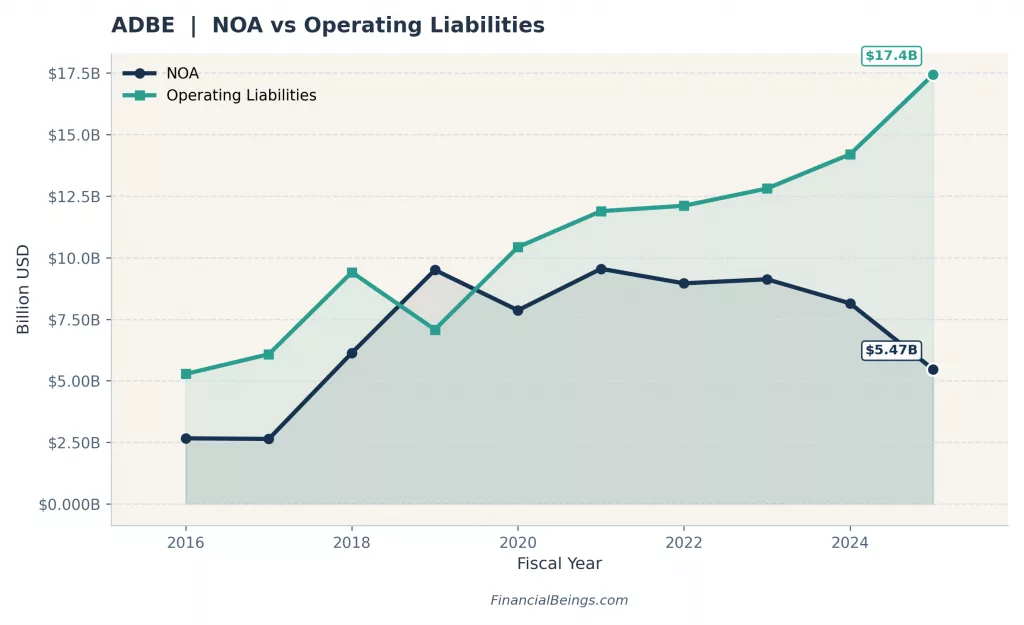
Figure 3: Net Operating Assets vs Operating Liabilities (2016–2025)

Figure 4: Operating Liability Leverage Trend (2016–2025)
Altogether, the residual income model is rather congruent with the economic reality of Adobe. It puts emphasis on value creation in the form of profitability and capital efficiency which is more reliable in this situation compared to DCF as a means of determining intrinsic value.
Why residual income outperforms DCF for software companies
Residual income model is better than the traditional (DCF) approaches to software companies due to its lower and more valid assumptions. The model bases valuation on book value, which has been recorded on the balance sheet, instead of projecting free cash flows further into the future, and this gives it a logical and starting point. This goes a long way to increase the insensitivity to the assumptions made about terminal value, the easiest part of DCF models that is uncertain.
Moreover, the model also uses Return on Net Operating Assets (RNOA) as its fundamental profitability measure. RNOA is a better measure of economic performance in capital-light software companies such as Adobe where efficiency and growth of value are determined by expanding returns on a lighter asset base. The operating leverage of Adobe brings out the high returns per relatively tiny operating base, which proves the power of a high operating leverage, so residual income is the valuation lens that is analytically suitable.
Key inputs our model uses – and what they signal about Adobe
The model relies on three fundamental inputs and these are; book value, net operating assets (NOA) and cost of capital. The book value and the NOA also have their foundation on the balance sheet of Adobe, meaning that the valuation is not of speculative forecasts, but of what is actually observed in the financial records. This enhances the reliability and minimizes model risk.
A company that is persistently generating returns exceeding its cost of capital cannot be valued at a very high discount rate. The continuation of economic value creation since 2021 in the case of Adobe justifies an anchoring of the cost of capital towards the low end of what otherwise would have been determined to be attributed to high-multiple software companies.
We set the hurdle rate to 10 percent (a fairly high rate) due to pessimism of investors over AI integration in its current products and profits future profits from the products. Since Adobe has been making profits consistently over its hurdle rate cannot be valued as shown by the current market price as though its operating engine is structurally impaired.
Financial Beings Valuation Lens (Interactive Chart)
Adobe intrinsic value analysis: per share, price target, and Peer Comparison
The intrinsic value of Adobe Inc., when evaluated using a residual income model, demonstrates a clear misalignment between market pricing and underlying business performance. The valuation framework assumes a 3% to 5% long-term growth rate, which remains modest relative to Adobe’s historical trajectory and current operating strength. Based on these assumptions, intrinsic value per share is estimated at $244.90 to $331.54, compared to a current market price of approximately $239.79, implying a potential upside of around 2% to 38%.
| Growth (%) | Model Value ($B) | Model Price/Share | Model Value % |
|---|
Model Value % > 100% = The model value exceeds the current market cap under the stated assumptions. Model Value % < 100% = The current market cap is above the model value under the stated assumptions. Model Value % = 100% = The model value matches the current market cap at the assumed growth rate.
At 2% growth, ADBE’s model value reaches a Model Value % of 90.8% relative to current market cap. At 5% growth, the model reaches a Model Value % of 138.3%, and it first exceeds current market cap around the 3% growth scenario.
The breakeven growth rate is approximately 2.8%. That is the long-term growth assumption where the model value lines up with a company already valued at nearly $98.4B, showing what the market appears to require from Adobe’s creative software, document cloud, and digital experience franchise.
Note: Under the 10% hurdle rate scenario set, ADBE reaches 222.6% Model Value at 7% growth. The sensitivity uses an ~86.4% RNOA basis, while the current market cap is crossed within the lower end of the tested range.
Figure 1. Adobe intrinsic value sensitivity versus long-term growth assumptions (2026–2030 forecast window).
Investor letter
If you have read this far, you already think differently about investing.
Get valuation research like this delivered weekly. Hard numbers, clear language, no hype, and no sponsored stock picks.
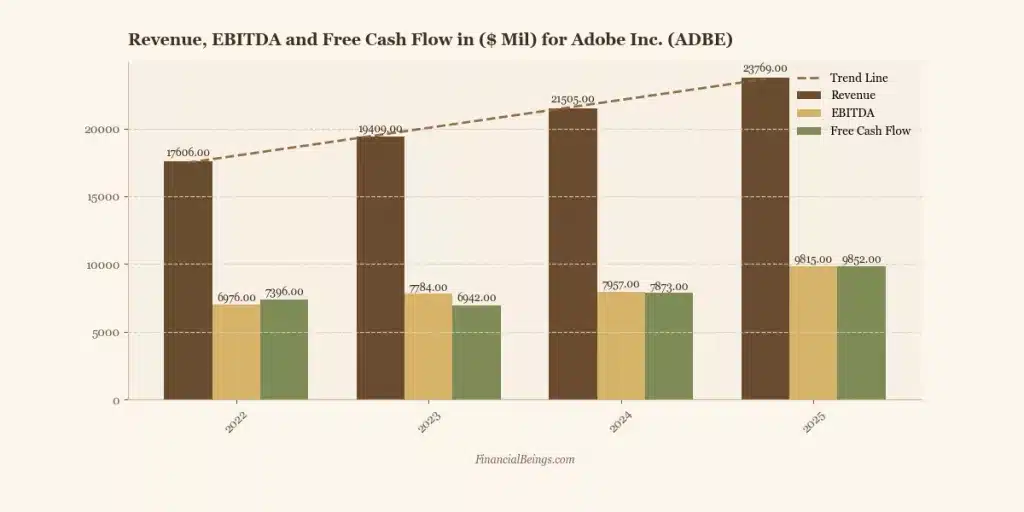
Figure 2: Revenue, EBITDA, and Free Cash Flow Growth (2022–2025)
Adobe has been able to perform well financially behind this valuation. The company has managed to maintain a very high margin and gross margins have been rising exceptionally, as the gross margins have risen in 2022 and then in 2025 to 87.70% and 89.27% respectively, whereas the operating margins have been improving, which stood at 34.64% and 36.63% in 2022 and 2025 respectively. Strong cost control and pricing power could be seen in the net margins of 30.00% in 2025. Simultaneously, revenue grew to $23,769 million as compared to the previous year of $17,606 million and free cash flow rose by $9,852 million meaning that the company produced a lot of cash.
All these trends ensure that the business model of Adobe remains efficient and sustains the intrinsic value growth (3%-5%) without the need to make aggressive assumptions.
According to this range of valuation, a sensible price target is between $244.90 and $331.54 per share which is the average of the base-case scenario. This target is a normalization of market expectations and not fundamentals. Notably, Adobe does not require a remarkable growth to achieve this level; it just requires to maintain its present profile of operations. The capacity of the company to create economic value is also evident in the fact that value creation per share increased by 2025 to $13.39, indicating the high trend of shareholder returns.
The valuation argument is further strengthened when viewed through a comparative lens. Instead of relying on traditional valuation multiples, a more meaningful comparison comes from market-implied growth rates, which reflect what investors are actually paying for.
At current levels, Adobe Inc. is priced for a long-term growth rate of approximately ~2.8%, which sits near the breakeven level in the Financial Beings model. In contrast, comparable large-cap software companies such as Microsoft, ServiceNow, and Salesforce (CRM) are typically priced with higher implied growth rates. This gap is significant.
It suggests that Adobe is being valued as a low-growth, structurally constrained business, despite demonstrating comparable — and in some cases superior — levels of profitability, capital efficiency, and recurring revenue strength.
The implication is not that Adobe must match peer growth expectations, but that the current pricing embeds excess conservatism. Even a modest normalization in growth assumptions toward historical levels would materially improve valuation, reinforcing the view that Adobe is underpriced on a growth-adjusted basis.
Adobe’s Return on Net Operating Assets (RNOA) has been at about 86.4%, meaning that the company has been very capital efficient. This is a very high payoff, which can result in sustained value creation even when there is a moderate growth assumption. Consequently, Adobe seems to be underestimated in terms of growth-adjusted value basis, which supports the perspective that the existing valuation is due to the prevailing market conservatism, as opposed to any underlying vulnerability.
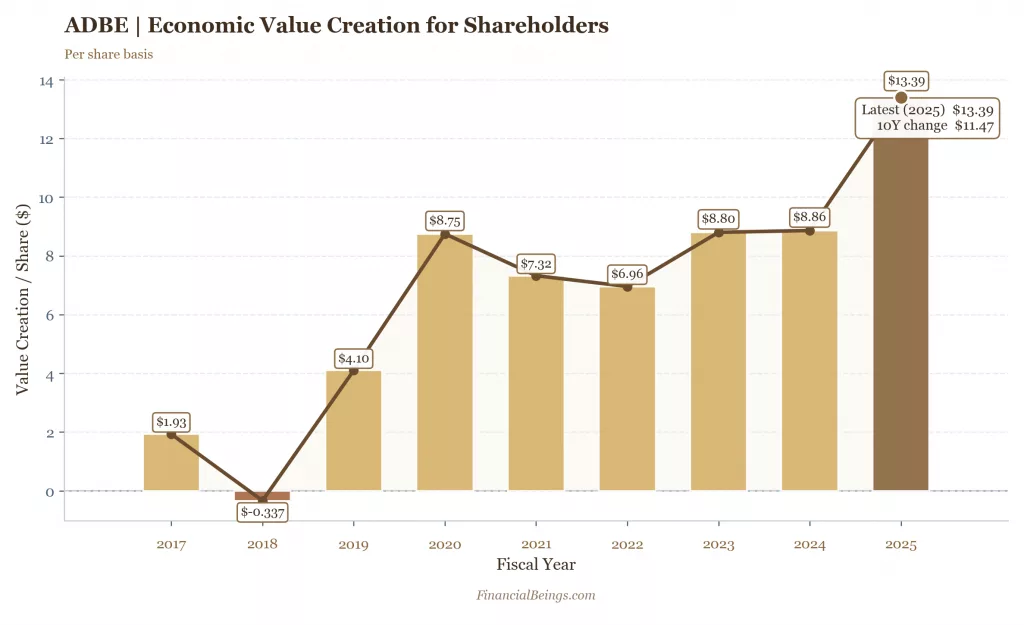
Figure 5: Economic Value Creation per Share (2017–2025)
Adobe intrinsic value per share: base case
The price base-case estimation falls within the 3%–5% long-term growth range, which remains conservative given the operating trends and market positioning of Adobe Inc.. Intrinsic value per share is estimated between $244.90 and $331.54, implying an upside range of approximately 2% to 38% from the current market price of around $239.79.
Adobe is a well-run business that justifies this valuation. Gross margins have continued to improve, rising from 87.70% in 2022 to 89.27% in 2025, while operating margins expanded from 34.64% to 36.63% over the same period. Net margins reached 30.00% in 2025, reflecting strong and consistent profitability. At the same time, revenue increased from $17,606 million in 2022 to $23,769 million in 2025, and free cash flow reached $9,852 million, highlighting the company’s strong cash generation capabilities.
These metrics indicate that Adobe’s intrinsic value is not based on aggressive assumptions. Instead, it is anchored in sustained profitability, high operating efficiency, and moderate long-term growth expectations that are consistent with the company’s historical performance.
Price target based on Adobe’s intrinsic value
The price target will be calculated based on the intrinsic range of the value of $245-$331.54 per share, and the base-case target will be in the range of $244.90 and $331.54. This valuation is market expectations being normalized as opposed to a change in fundamentals, i.e. it does not mean that Adobe would need extraordinary growth in order to attain this valuation.
The reasoning behind this target is that Adobe is improving its economic value creation and operation efficiency. The growth of economic value creation per share has been positive between 2022 and 2025 with the figure of $6.96 and $13.39 respectively, which is a good trend in terms of shareholder value creation. Also, Adobe has a high operating leverage as is indicated in the capital structure where operating liabilities of the company in 2025 amounted to about 17.4 billion as compared to net operating assets of about $5.47 billion. This explains that Adobe does not require high asset base and they use their liabilities efficiently.
Adobe vs big tech intrinsic value: how does ADBE compare?
Another superior means of measuring Adobe valuation is by applying market-implied growth rates, as opposed to traditional valuation multiples. The respective current market price shows that the market is expecting that Adobe will grow in the long-term by about 2.4 per cent on average, much lower than its competitors, including Microsoft and ServiceNow, whose market implied growth rates are over 6.5%.
This gap implies that Adobe is being under-priced compared to other similar software firms, even though they are showing the same or better operating efficiency. As an example, the Return on Net Operating Assets (RNOA) of Adobe has already reached about 86.4% in 2025, which means high levels of capital efficiency. This degree of profitability is conducive to generation of values in the short term even in moderate growth assumptions.
This connotation is obvious, as Adobe seems to be cheap on growth-adjusted terms, supporting the idea that the market is discounting risk, as opposed to core. This reinforces the argument of convergence of market price to intrinsic valuation once the expectation levels are normalized.
| Operating support indicator | 2022 | 2023 | 2024 | 2025 |
| Gross margin (%) | 87.70 | 87.87 | 89.04 | 89.27 |
| Operating margin (%) | 34.64 | 34.26 | 36.00 | 36.63 |
| Net margin (%) | 27.01 | 27.97 | 25.85 | 30.00 |
| Revenue ($ mil) | 17,606 | 19,409 | 21,505 | 23,769 |
| EBITDA ($ mil) | 6,976 | 7,784 | 7,957 | 9,815 |
| Free cash flow ($ mil) | 7,396 | 6,942 | 7,873 | 9,852 |
Adobe intrinsic value sensitivity table: bear, base, and bull scenarios
One important observation during the sensitivity analysis is that even with very small growth assumptions, valuation support becomes apparent. In comparison to high-multiple AI names, which need a high long-term growth to warrant their price, Adobe achieves a fair upside value in a range of 3%-5%, which incorporates a substantial decrease in the execution risk. It implies that this stock will not rely on the optimistic forecasts, but rather, it will be backed by conservative assumptions, which will make the valuation framework stronger and more dependable.
| Scenario | Growth assumption | Intrinsic value ($B) | Price/ share | Value/ Price |
| Bear | 2.0% | $89.42 | $217.83 | 90.84% |
| Base | 3.0%–5.0% | $100.53 – $136.10 | $244.90 – $331.54 | 102.13% – 138.26% |
| Bull | 6.0%–7.0% | $167.22 – $219.08 | $407.35 – $533.69 | 169.88% – 222.57% |
Bear case – intrinsic value and key assumptions
The bear case assumes a long-term growth rate of about 2%, reflecting a scenario where Adobe Inc. experiences slower growth due to competitive pressures, pricing constraints, or margin compression. Under this assumption, intrinsic value per share is approximately $217.83, which is slightly below the current market price of around $239.79.
This scenario suggests that the market is already pricing in a near worst-case outcome. The downside is not expected to be significant even if growth slows, as Adobe’s high margins and recurring revenue base provide a valuation floor. Intrinsic value at 2% growth being below the current price indicates that investors are already discounting very conservative assumptions, close to long-term nominal GDP levels.
The most important conclusion from the bear case is that material downside would require structural deterioration in fundamentals, which is not currently reflected in Adobe’s financial performance.
Base case – intrinsic value and key assumptions
The base case assumes long-term growth in the range of 3% to 5%, which is consistent with Adobe’s historical performance and underlying demand. Under this scenario, intrinsic value per share is estimated between $244.90 and $331.54, which is moderately above the current market price.
Adobe continues to generate returns above its cost of capital, supporting this valuation. The company maintains strong operating performance, with revenue at $23,769 million, free cash flow at $9,852 million, and consistently high margins. These factors indicate that the operating engine remains intact.
The base case highlights that even conservative assumptions generate upside. The stock does not require extraordinary growth to deliver returns; it only needs to maintain stable and efficient operations, which reduces execution risk and supports valuation expansion.
Bull case – intrinsic value and key assumptions
The bull case assumes a long-term growth rate of 6% to 7%, driven by stronger demand, particularly from AI integration and expansion of digital experience platforms. Under this scenario, intrinsic value per share ranges approximately between $407 and $534.
This upside is supported by Adobe’s ability to sustain high returns on capital while scaling the business. With RNOA around 86.4%, the company remains highly efficient in generating profits from its operating base. When this level of efficiency is combined with higher growth, the compounding effect on valuation becomes significant.
Additionally, Adobe’s economic value creation per share has increased to approximately $13.39, reinforcing its ability to generate long-term shareholder value. The bull case is therefore not just about higher growth, but also about the sustainability of profitability and operating leverage.
At what price does Adobe become a clear buy?
Adobe would be an easy buy when the price is close to the lower end of the intrinsic value band, where the margin of safety is strongest. Based on the sensitivity analysis, this level sits around $240–$250 per share, where valuation begins to show consistent support under conservative assumptions. Investors looking to take a position in Adobe Inc. can consider current levels, as the stock is trading near the valuation floor due to market over-pessimism. At around $217–$220, which corresponds to the bear-case valuation, downside risk becomes very limited relative to intrinsic value.
At such levels, the valuation gap is minimal under conservative assumptions, meaning investors are effectively paying a price that already reflects low long-term growth expectations (~2%–3%). This creates a favorable risk-reward profile, where downside is constrained while upside remains intact if growth normalizes.
The principle of margin of safety is critical here. A lower entry price reduces reliance on optimistic growth assumptions and increases the probability of positive returns. Given Adobe’s strong fundamentals, high margins, and efficient operating model, the current pricing provides a clear framework for identifying attractive entry points under conservative scenarios.
Adobe’s expected return: what investors get at current price
The current stock price is likely to provide Adobe’s shareholders with an expected return of approximately 7.9%–9.8%, assuming a 3%–5% long-term growth rate and a 10% cost of capital. This payoff is derived directly from the residual income model and represents the expected return from investing at the current market price. The risk profile remains relatively low, while returns are competitive, resulting in a balanced and favorable risk-reward setup.
The importance of this return profile lies in its stability. Adobe Inc. is capable of delivering competitive returns even under moderate growth assumptions, unlike high-growth technology stocks that require aggressive expansion to justify their valuations. Expected returns remain positive even at lower growth levels, supported by strong margins, recurring revenue streams, and efficient capital utilization. With gross margins near 90% and operating margins above 36%, Adobe continues to generate steady profitability, which directly supports forward return expectations.
However, market expectations are currently compressing this return profile. The market is implying a long-term growth rate of approximately ~2.8%, which is below Adobe’s historical growth and underlying capability. This compression is not driven by a deterioration in fundamentals, but rather by elevated concerns around AI disruption and competitive positioning, which appear to be over-discounted in the current valuation.
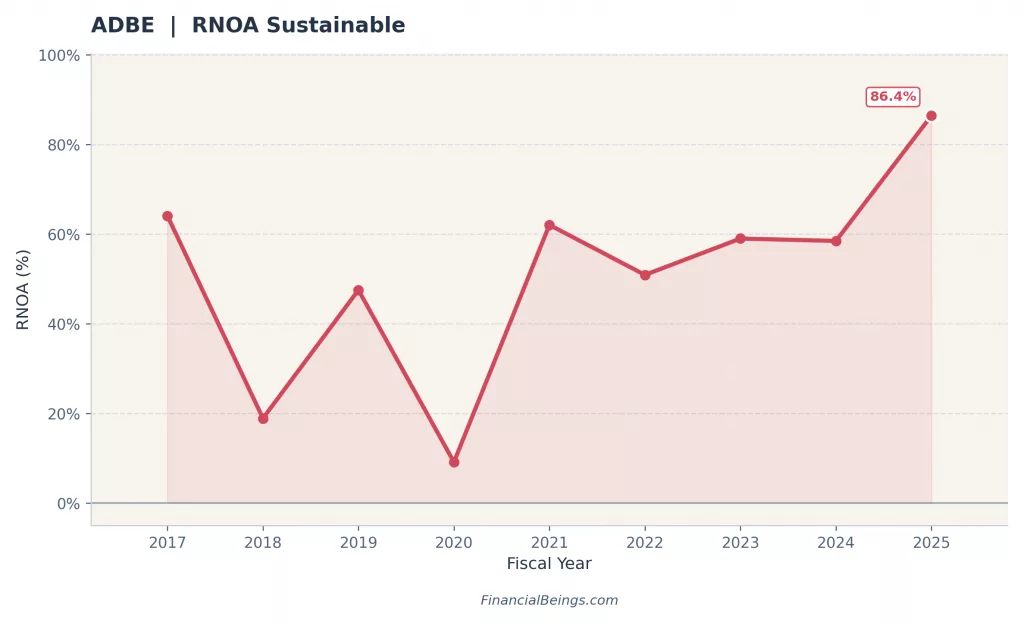
Figure 6: Sustainable RNOA Trend (2017–2025)
This creates a key asymmetry. In case Adobe does not change the level of current operating performance, anticipated returns will be appealing. In case the growth expectations are normalized to even small levels, the returns would be better. The valuation hence does not involve positive surprise, but only the lack of a negative surprise.
Investors in real world situations are being rewarded to accept perceived risk which is not entirely backed by financial performance. It is this lack of congruence between expectation and reality that makes the opportunity.
The verdict: should investors buy it?
Adobe can be considered a BUY at current levels as shown by the valuation model not because the company is being framed as a high-growth AI stock, but because it is an established compounder that is being underpriced by the market.
This mispricing is mainly caused by the expectations of the market growth. As implied growth, ~2.8% Adobe is trading as though structural slackness in its long-term growth. This supposition is contrary to its financial results, which demonstrate the further growth of revenues, high level of free cash flows, and stable profitability. The margins are also at their highest level in software industry and economic value creation will continue to rise, which means that core business will not be weakened.
Besides, intrinsic value offers coverage when there are conservative assumptions. A valuation is not only above the present price but a margin of safety is also provided even at low growth rates. This minimizes negative risk and maintains the possibility of upside.
AI disruption and competitive force is the main threat. Nevertheless, this risk can be already considered in the existing valuation. Consequently, the payoff profile is skewed: there will be a small downside in the event that pessimism is sustained, but a positive payoff in the event that the expectations are normalized.
To sum up, Adobe can be viewed as a quality business that is underestimated by the market sentiment in the short term, which is why it is an appealing investment in its current condition.
Portfolio recommendations: should you own Adobe in 2026?
Growth portfolio
In the case of growth-oriented portfolios, the Adobe Company can be a very promising company given that it has an asymmetric upside potential in the case of a higher growth scenario. When the long-term growth rate rises up to the 6% to 7% range, intrinsic value is increased by large margins, resulting in a huge upside for growth investors. This translates into a low risk- high reward scenario.
But to bring this scenario to reality, Adobe will need to continue increasing revenues by creating new products, especially in AI-based creative solutions and online experience platforms. Although the company already shows good revenue growth (up to $23,769 million), the case of growth portfolio presupposes further growth based on the monetization of new capabilities.
The most important aspect of Adobe is that it does not need extreme assumptions in order to provide upside to growth investors. Even a moderate increase in the expectations of growth can produce significant returns. Consequently, Adobe presents a strong quality, scalability, and valuation growth opportunity profile, and thus, it is fitting to portfolios that require long-term returns on capital and are patient.
Conservative portfolio
In the case of conservative investors focused on capital preservation, Adobe Inc. remains appealing — not because of growth optionality, but due to its margin of safety. The bear-case valuation indicates an intrinsic value of approximately $217.83 per share, which is below the current market price of around $239.79, suggesting that downside risk is limited even under pessimistic assumptions.
Adobe’s operating profile supports this defensive positioning. Gross margins of nearly 90%, operating margins above 36%, and consistent free cash flow generation of approximately $9,852 million provide a stable earnings base. These factors reduce the likelihood of material valuation deterioration unless there is a structural breakdown in the business model, which is not evident in current performance.
From a conservative standpoint, a more attractive entry point lies closer to the lower end of the valuation range. Prices in the $220–$240 range offer improved margin of safety, while levels approaching $217 align closely with bear-case assumptions. At these levels, the stock reflects already compressed growth expectations, limiting downside risk.
Thus, Adobe can function as a defensive technology holding, where stability, profitability, and capital efficiency provide downside protection, while still offering moderate upside if growth expectations normalize.
Balanced portfolio
In the case of balanced portfolios, Adobe Inc. represents a strong mix of stability and upside, making it suitable as a core allocation. The base-case scenario, which assumes 3%–5% long-term growth, is expected to generate returns in the range of approximately 7.9%–9.8%, offering a balanced trade-off between risk and return.
Adobe’s positioning is particularly robust because it is not dependent on a single outcome. Even under conservative assumptions, valuation remains supported, while modest improvements in growth expectations lead to meaningful upside. This creates a diversified return profile that aligns well with balanced investment strategies.
Furthermore, Adobe’s strong economic value creation of approximately $13.39 per share, along with high capital efficiency reflected in an RNOA of around 86.4%, reinforces its ability to generate sustainable long-term returns.
From an entry perspective, a pullback in the stock improves the risk-reward profile. Prices moving closer to the $220–$240 range enhance the margin of safety and increase expected returns. At these levels, Adobe offers a more attractive balance between downside protection and upside potential.
Adobe Stock Is Being Priced Like It’s Dying — The Math Says Otherwise
General positioning: Right now, the Adobe stock price seems driven more by fear than actual performance. Even though the company is a strong long-term compounder, it is not being priced like one. AI risks exist, but they look overestimated, which could offer a good opportunity for long-term investors.
All calculations and valuation estimates are FinancialBeings’ own, based on data sourced from SEC filings of ADBE (10K and 10Q), and ADBE investor relations use or reproduction before prior approval is prohibited.
Frequently Asked Questions (FAQs)
What is Adobe’s intrinsic value per share in 2026?
The intrinsic value of Adobe in 2026 is estimated to be between $244.90 and $331.54 per share, assuming a 3%–5% long-term growth rate under the Financial Beings residual income model.
With the stock currently trading around $239.79, this implies a potential upside of approximately 2% to 38%, suggesting that Adobe is modestly undervalued under realistic and conservative growth assumptions.
Is Adobe stock overvalued or undervalued right now?
Adobe seems underpriced at present market values since the intrinsic value is greater than the market price based on a medium growth projection. It is being underpriced as the growth prospects over the long term are perceived to be weak, yet the margins, free cash flow, and steady economic value creation are growing, which indicate that the market is overreacting to risks instead of the economic deterioration.
How does Adobe’s intrinsic value compare to big tech?
The market-implied growth rates of Adobe seem to be more appealing with regard to valuation. The market suggests the growth of Adobe is about 2.4% whereas other comparable companies such as Microsoft and ServiceNow have a growth of more than 6.5% even though they have the same profitability. This causes Adobe to be relatively lower on a growth adjusted basis which substantiates the concept of valuation mispricing.
What growth rate is priced into Adobe stock?
The current market price of Adobe Inc. implies a long-term growth rate of approximately ~2.8% per annum, which is low relative to its historical performance and underlying operating strength. This reflects compressed expectations, suggesting that the market is heavily discounting future growth prospects.
As a result, the stock is priced for a scenario where growth remains structurally weak. This creates a gap between the current price and intrinsic value under more realistic assumptions, where even modest normalization in growth expectations can lead to meaningful valuation upside.
At what price should I buy Adobe stock?
At current levels around $239–$240, Adobe Inc. is trading close to its model-implied fair value under conservative assumptions. Rather than representing a clear entry point, the current price reflects a scenario where low long-term growth (~2%–3%) is already embedded.
From a valuation perspective, attractiveness improves as the price moves closer to the lower end of the intrinsic value range, where the margin of safety becomes more meaningful. At present levels, the risk appears contained rather than compelling, with upside increasingly dependent on a normalization in growth expectations rather than deep mispricing.
