

Micron looks less demanding on the Financial Beings valuation model, provided its record profits last. Nvidia has a more consistent recent profit history, but its price requires more growth. At October 16 closing prices of $878.84 for MU and $214.13 for NVDA, the decision turns on earnings durability.
Micron’s apparent advantage narrows sharply if memory profits fade. Nvidia’s valuation improves when its newer earnings replace an older model baseline. Neither offers a clear margin for error if profitability retreats and growth slows.
In this Micron vs Nvidia stock comparison, you will learn how much growth each share price needs and why earnings durability matters more than recent profits.
Micron vs Nvidia stock at a glance
Latest reported quarters and valuation snapshot
| Metric | Micron MU | Nvidia NVDA |
| Business role | Memory and storage | Accelerators, networking and software |
| Latest quarter | FQ4 FY2026 | Q2 FY2027 |
| Quarter ended | September 3, 2026 | July 26, 2026 |
| Quarterly GAAP revenue | $54.229 billion | $96.221 billion |
| Quarterly GAAP gross margin | 86.8% | 75.0% |
| Quarterly GAAP diluted EPS | $32.87 | $2.46 |
| Quarterly adjusted diluted EPS | $33.42 | $2.22 |
| Equity market value at October 16 | $994.3 billion | $5,170.6 billion |
| Enterprise value at October 16 | $961.6 billion | $5,153.9 billion |
| Trailing valuation earnings basis | FY2026 through September 3 | Twelve months through July 26 |
| Main valuation risk | Record memory profits fade | Growth and margins disappoint |
Financial results: Micron fiscal Q4 2026 and Nvidia fiscal Q2 2027. Valuation figures: Financial Beings model dated October 18. Prices: October 16, 2026, 4 p.m. EDT, checked against MU price history and NVDA price history.
Share prices alone tell you little about relative value. Market capitalization measures the whole company’s equity value. Enterprise value also adjusts for cash and debt.
How Micron and Nvidia make money from AI
Micron supplies memory and storage
Micron makes DRAM, the working memory computers use while processing information, and NAND, which stores data. High bandwidth memory, or HBM, stacks DRAM close to AI processors so they can access large amounts of data quickly.
AI creates demand for more memory and higher performance products. Micron’s earnings also depend on prices, production costs and how much competing supply reaches customers. More AI activity does not guarantee permanently high memory margins.
The Nvidia connection is direct. Micron announced volume shipments of HBM4 designed for Nvidia’s Vera Rubin platform. That establishes a product relationship. It does not disclose Nvidia’s total spending with Micron or make Micron its exclusive memory supplier.
Nvidia supplies a computing platform
Nvidia combines accelerators with networking, systems and software for AI workloads. This broader platform can make switching harder because customers must consider software compatibility and system performance as well as chip prices.
Micron owns memory factories. Nvidia relies on manufacturing partners, although securing supply still requires capital and commitments. For another accelerator comparison, see Nvidia versus AMD stock.
What the latest earnings reveal
Micron’s latest quarter ended September 3, 2026. Nvidia’s ended July 26. These are different reporting periods, so their margins do not measure exactly the same market conditions.
Micron’s 86.8% GAAP gross margin shows exceptional pricing and product economics. However, the consolidated figure combines several businesses. It cannot establish HBM profitability on its own. Nvidia’s 75.0% GAAP gross margin also reflects strong economics, supported by demand for its AI systems. Micron results; Nvidia results.
Next-quarter revenue guidance is $61.5 billion, plus or minus $1.5 billion, for Micron and $108 billion, plus or minus 2%, for Nvidia. Those are management forecasts, separate from the reported results above.
The Financial Beings model puts Micron’s FY2026 after-tax operating margin at 63.9%, against 53.6% for Nvidia’s twelve months through July 26. These are analyst reformulated measures, distinct from GAAP gross margin and company adjusted earnings.
On average net operating assets, the model calculates returns of 102.4% for Micron FY2026 and 122.0% for Nvidia’s latest twelve months. This return, called RNOA, divides after-tax operating profit by average capital tied up in operations. High returns matter only if they persist as the business reinvests.
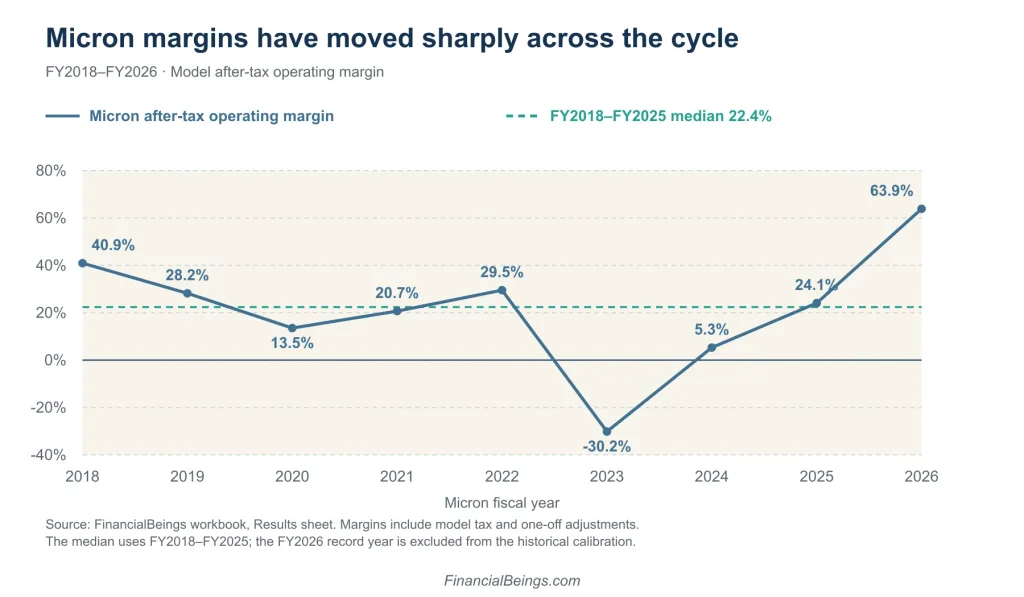
Micron’s FY2026 margin is far above the median of its preceding eight fiscal years.
Underlying data for the Micron margin cycle
| Micron fiscal year | Model after-tax operating margin |
| 2018 | 40.9% |
| 2019 | 28.2% |
| 2020 | 13.5% |
| 2021 | 20.7% |
| 2022 | 29.5% |
| 2023 | -30.2% |
| 2024 | 5.3% |
| 2025 | 24.1% |
| 2026 | 63.9% |
Source: Financial Beings workbook, Results sheet, FY2018–FY2026. After-tax operating margin includes the model’s tax and one-off adjustments. Fiscal years differ between companies.
Micron’s history shows why one exceptional year needs scrutiny. Nvidia’s recent margin history is steadier, but its own FY2023 decline shows that it also faces business cycles.
Does a lower earnings multiple make Micron better value
Compare the same earnings horizon
The model’s trailing enterprise value divided by adjusted after-tax operating profit is 11.3 times for Micron FY2026 and 31.7 times for Nvidia’s latest twelve months. This cash-and-debt-adjusted measure is sometimes called unlevered P/E. It differs from the familiar share-price-to-EPS ratio.
The forward figures, 4.8 times and 25.9 times, deserve more caution. Both use FY2027 forecasts, but Micron’s fiscal year has just begun while Nvidia’s is already half reported. They are not a matched next-twelve-month consensus comparison.
The workbook also flags possible one-off income in Nvidia’s forecast inputs, adding another reason for caution.
Reported profits forecasts and a historical-margin stress
| Profit measure in US$ billions | Micron MU | Nvidia NVDA |
| Trailing GAAP net income | 85.0 | 192.9 |
| Trailing after-tax operating profit with model adjustments | 85.1 | 162.4 |
| FY2027 forecast after-tax operating profit | 199.3 | 198.5 |
| Historical-margin stress after-tax operating profit | 29.8 | 84.3 |
US$ billions. Source: Financial Beings workbook; historical-margin stress calculated for this article. Trailing periods are MU FY2026 and NVDA twelve months to July 26, 2026. FY2027 forecasts cover different fiscal calendars and are separate from company guidance.
Micron’s forward operating profit assumes roughly 134% growth from FY2026. Nvidia’s assumes about 22% growth from its latest twelve months. A small multiple can conceal a demanding earnings assumption.
Normalize the memory cycle
For a transparent stress test, apply each company’s median FY2018–FY2025 after-tax operating margin to its latest annual revenue. That gives margins of 22.4% for Micron and 27.8% for Nvidia, and the stressed profits shown above.
On that basis, the operating earnings multiples rise to about 32.3 times and 61.1 times. Micron remains less expensive per dollar of stressed profit, but the apparent bargain becomes much less obvious.
This is a historical-margin sensitivity, not a forecast. It preserves today’s revenue scale and cannot predict how HBM or Nvidia’s platform changes future profitability. Removing one-off items alone does not normalize a full business cycle.
Test the price against sustainable earnings
The valuation below uses a 10% required return for both companies. It asks how much annual excess operating income can grow: profit remaining after charging for the capital used in operations. This growth rate is neither revenue growth nor an expected stock return.
Where each investment thesis can fail
Micron’s main risk is that supply catches up with demand. Softer memory prices, weaker product mix or higher production costs could reduce profit rapidly. Factory expansion also needs substantial investment before new capacity earns revenue.
HBM adds execution risk. Micron must produce complex stacks reliably, meet customer qualification requirements and compete with SK hynix and Samsung. Qualified HBM capacity is not interchangeable with every additional unit of ordinary DRAM capacity. Related economics are discussed in Micron compared with Broadcom.
Nvidia faces platform transitions, customer concentration, competing accelerators and customer-designed chips. Export restrictions can limit access to markets. Its Q3 outlook assumes no data center compute revenue from China, according to its results release.
Supply commitments increase the importance of forecasting demand correctly. Nvidia reported $279 billion of supply and capacity commitments at July 26, up from $119 billion the previous quarter. These span multiple fiscal years and primarily concern memory and manufacturing facilities. Certain arrangements can change before firm orders, potentially with additional costs. They are not guaranteed Micron revenue. Nvidia Q2 FY2027 Form 10-Q, Note 10.
Both companies depend on continued AI infrastructure spending. Higher memory costs could pressure Nvidia’s margins, but the effect depends on system pricing, product mix and efficiency. The relationship need not be zero sum.
Which stock offers the better risk reward
Micron has the stronger valuation case on the annual model’s assumptions. The critical condition is that its extraordinary FY2026 profit base remains durable.
The model uses Micron FY2026 through September 3 and Nvidia FY2026 through January 25. Its starting excess operating income is approximately $79.0 billion and $105.0 billion, respectively. The Nvidia baseline is older, so the annual comparison needs a freshness check.
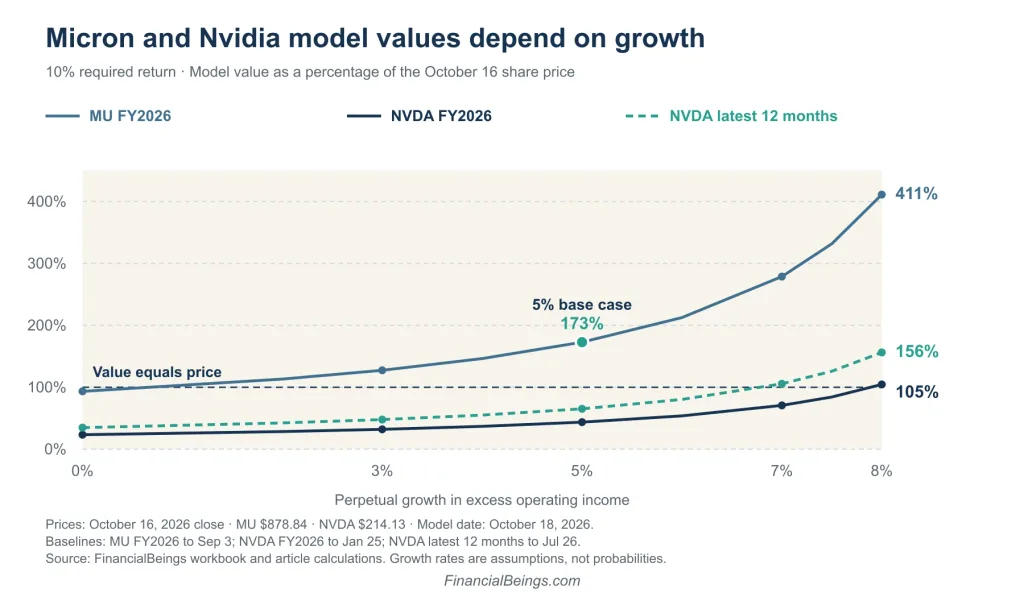
A newer Nvidia profit base improves its valuation, while Micron’s result still depends on sustaining record earnings.
Model value per share and percentage of the October 16 share price
| Perpetual excess-income growth | MU FY2026 base | NVDA FY2026 base | NVDA latest twelve months |
| 0% No growth | $820.63 (93%) | $50.00 (23%) | $74.51 (35%) |
| 3% Conservative case | $1,119.94 (127%) | $68.63 (32%) | $102.37 (48%) |
| 5% Base case | $1,518.99 (173%) | $93.48 (44%) | $139.53 (65%) |
| 7% Growth case | $2,450.11 (279%) | $151.45 (71%) | $226.23 (106%) |
| 8% Higher-growth sensitivity | $3,614.01 (411%) | $223.92 (105%) | $334.60 (156%) |
Cells show US$ per share (percentage of price). October 16 reference prices are MU $878.84 and NVDA $214.13. Source: Financial Beings Growth Sensitivity sheets at a 10% required return. Nvidia latest-twelve-month figures are article calculations using Reformulation_Q_NVDA. Values are scenarios, not price targets or probabilities. The 100% line means model value equals the October 16 price.
The 3%, 5% and 7% cases preserve the starting profit base and change its subsequent growth. They do not model a memory downturn, which needs a separate reduction in profitability.
In the 5% base case, annual-model values are $1,518.99 per MU share and $93.48 per NVDA share. Using the current share counts, zero-growth values are approximately $821 and $50. Those results carry the starting earnings assumptions forward indefinitely.
Updating Nvidia matters. Repeating the same formula with its latest twelve-month excess profit and July balance sheet raises its 5% value to about $139.53, or 65% of price. Its break-even perpetual growth falls from 7.91% to about 6.82%. Micron’s annual baseline implies 0.77%.
With the newer Nvidia baseline, the 7% case reaches 106% of price. The annual baseline reaches only 71%, showing how the profit period can change the valuation conclusion.
These are conditional growth requirements, not measurements of what the market collectively forecasts. For the formula and capital treatment, see how the valuation works and the related Nvidia valuation discussion.
Profit durability can change the preference more than the headline multiple. In the workbook’s separate stress grid, Micron’s model value falls to about 56% of price at zero growth when the valuation return assumption drops to 50%. At that profitability, roughly 5.1% perpetual growth is needed to match the price.
The 50% figure is a valuation scenario using ending capital, distinct from the historical return on average capital discussed earlier.
Micron stock thesis requires durable memory earnings
Micron suits a thesis that elevated memory earnings can persist.
Nvidia stock thesis requires sustained platform growth
Nvidia suits a thesis that its platform can sustain growth and strong economics as capital needs expand.
When neither stock offers enough value
If Micron’s profits normalize while Nvidia’s growth disappoints, neither valuation offers much support under this framework. More durable business economics and a more attractive stock price remain separate judgments. See also Nvidia versus Broadcom.
Upcoming events that could change the comparison
Nvidia scheduled its next results call for November 17, 2026, according to its Q2 FY2027 earnings call transcript. Watch whether revenue meets guidance, how gross margin changes during the Rubin transition, and whether operating capital grows faster than profit.
For Micron, the next report should test memory pricing, HBM execution and capital spending against the FY2027 outlook. Watch whether higher revenue still produces cash after factory investment. Check the Micron investor calendar for the next officially announced event and subsequent updates.
Questions investors still ask
Does Nvidia use Micron memory?
Yes. Micron announced HBM4 designed for Nvidia’s Vera Rubin platform and volume shipments in calendar Q1 2026. This does not establish exclusive supply or Nvidia’s total spending with Micron.
Why can Micron have a lower P/E?
Memory profits can rise sharply when supply is tight. Investors may assign those earnings a lower multiple if they expect prices and margins to normalize. The denominator’s durability matters as much as its size.
Which stock has more cyclical earnings?
Micron shows larger margin swings in the model’s history, including a negative after-tax operating margin in FY2023. Nvidia’s profitability is also sensitive to demand, competition and product transitions.
Does owning both diversify AI risk?
It provides exposure to different parts of the supply chain. Both remain sensitive to cloud providers’ AI budgets, so owning both does not remove a shared spending risk.
How the valuation works
Model equity value equals net operating assets plus anchored excess operating income divided by the difference between the 10% required return and perpetual growth, less net debt. The model treats anchored excess income as the first projected year and grows it thereafter. Growth stays below 10%.
The capital charge uses beginning operating assets. Growth must be supported by reinvestment and maintained profitability; it is not free. The model uses current shares for valuation, rather than the weighted-average diluted shares behind reported EPS. Historical-margin stress, updated Nvidia values and perpetual growth cases are analyst assumptions and calculations.
References and URLs
- Micron fiscal Q4 and full year FY2026 financial results — View Source
- Nvidia Q2 FY2027 financial results — View Source
- Nvidia Q2 FY2027 Form 10-Q including Note 10 — View Source
- Micron HBM4 production announcement for Nvidia Vera Rubin — View Source
- Nvidia software platform — View Source
- Nvidia Q2 FY2027 earnings call transcript — View Source
- Micron investor events and presentations calendar — View Source
- Stock Analysis Micron historical share prices — View Source
- Financial Times Nvidia historical share prices — View Source
- FinancialBeings Nvidia versus AMD stock — View Source
- FinancialBeings Micron versus Broadcom — View Source
- FinancialBeings Nvidia intrinsic value in 2026 — View Source
- FinancialBeings Nvidia versus Broadcom in 2026 — View Source
- FinancialBeings valuation workbook and article calculations: MU_NVDA Valuation Results_2026-10-18.xlsx. Model sources: Results, Growth_Sensitivity_MU, Growth_Sensitivity_NVDA, Reformulation_Q_NVDA and RNOA_Grid. Additional Nvidia LTM and historical-margin sensitivities are the article’s calculations. Internal research file; no public URL.