Best Large Healthcare Companies in the USA (2026) – Market Cap & Revenue Rankings : Identify the leading U.S. healthcare companies, by market capitalization, revenue and residual earnings strength, in 2026. Discover the best insurers, distributors, and healthcare operators in the USA.
Introduction
Healthcare companies are business sectors that offer medical care services, health insurance, medicines, and healthcare services to individuals. These are the hospitals, insurance companies, pharmaceutical distributors and healthcare services companies. These companies are crucial in the United States in improving the health of the population and health care management.
The article is going to explain the top healthcare companies in the USA in 2026. This analysis compares Residual Earnings Per Share (REPS) data with revenue, EBITDA, and free cash flow to gain insight into the efficiency of company value creation rather than focusing on the size or revenue of the company.
This indicates that there is a noticeable difference among companies. There are companies that can create high value because of effective operations, and there are those that do not create high value despite huge revenues and market share. This article can assist in understanding which companies have performed better in recent years.
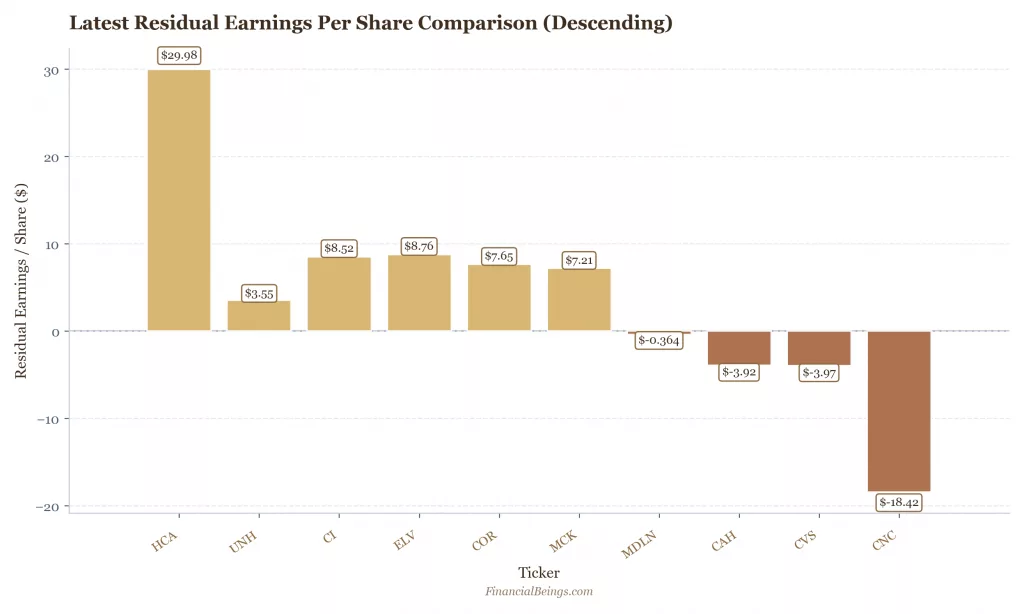
Figure 1. Residual Earnings Per Share Comparison Across global healthcare company rankings 2026
Table 1. Residual Earnings Per Share Ranking
| Rank | Ticker | Company | REPS ($) | REPS Reading |
| 1 | HCA | HCA Healthcare | 29.98 | Exceptional value creation |
| 2 | ELV | Elevance Health | 8.76 | Strong value creation |
| 3 | CI | The Cigna Group | 8.52 | Strong value creation |
| 4 | COR | Cencora | 7.65 | Solid value creation |
| 5 | MCK | McKesson | 7.21 | Solid value creation |
| 6 | UNH | UnitedHealth Group | 3.55 | Moderate value creation |
| 7 | MDLN | Madrigal Pharmaceuticals | -0.36 | Near break-even |
| 8 | CAH | Cardinal Health | -3.92 | Value destruction |
| 9 | CVS | CVS Health | -3.97 | Value destruction |
| 10 | CNC | Centene | -18.42 | Severe value destruction |
Top Healthcare Companies by Market Cap in the USA (2026)
Here, we look at the biggest healthcare companies in the USA in terms of market value. This assists us in knowing the size of the companies that are the largest.
1. UnitedHealth Group: Market Leader in Scale
UnitedHealth Group is the US’s largest healthcare company, USA 2026 by market capitalization at $251.66 billion. UnitedHealth is the top healthcare stock 2026, the biggest in equity value and has a diversified model of operating in healthcare benefits and care delivery.
B. McKesson and Cencora: Distribution Giant with Strong Position
McKesson, with $109.14 billion, and Cencora, with $63.18 billion, are still significant healthcare supply-chain solutions.
C. CVS Health: Large Integrated Healthcare Platform
CVS Health with $93.49 billion integrates pharmacy, health services, and insurance.
D. HCA Healthcare: High Efficiency with Significant Market Value
HCA Healthcare with $105.51 billion is a hospital operator that has a narrower delivery model.
E. The Cigna Group & Elevance Health: Mid-Tier Leaders in Managed Care
The mid-tier leasers are Cigna Group with $72.13 billion and Elevance Health with $66.37 billion
F. Centene and Molina: The Smallest player in the list
The smaller players in this list are Centene, with a value of $17.27billion, and Molina Healthcare, with a value of $7.26billion. These values demonstrate the concentration of public market confidence, though the analysis of the REPS and the creation of economic values are not identical. Centene and Molina are closer to the managed care and health-plan economics.
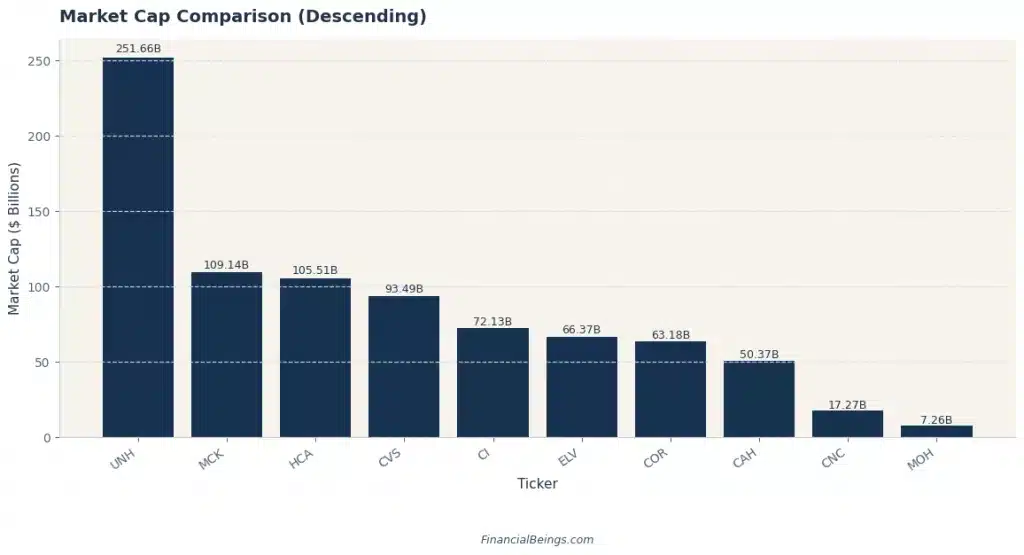
Figure 2. Market Capitalization Comparison of Major U.S. Healthcare Companies
Market Cap Ranking among Large Healthcare Companies in the USA 2026
Table 2. Market Cap Ranking
| Rank | Ticker | Market Cap ($B) |
| 1 | UNH | 251.66 |
| 2 | MCK | 109.14 |
| 3 | HCA | 105.51 |
| 4 | CVS | 93.49 |
| 5 | CI | 72.13 |
| 6 | ELV | 66.37 |
| 7 | COR | 63.18 |
| 8 | CAH | 50.37 |
| 9 | CNC | 17.27 |
| 10 | MOH | 7.26 |
Top US Healthcare Companies by Revenue in the USA (2026)
The top US healthcare companies 2026 have always been characterized by revenue scale; size is not the determinant of economic performance. Although healthcare companies list USA are exhibiting strong top-line growth, their performance in converting that growth into profitability and cash flow varies widely, which directly affects their REPS results.
UnitedHealth Group and CVS Health: Scale with Efficiency Pressure
UnitedHealth Group is the industry leader, and its revenue will grow by 2025, starting at around $324,162 million and reaching $447,567 million. Nevertheless, EBITDA decreases significantly, with a decrease ranging between approximately $81,835 million and $23,060 million, and free cash flow also goes down, from $23,404 million to $16,075 million. This means weakening productivity even as it grows.
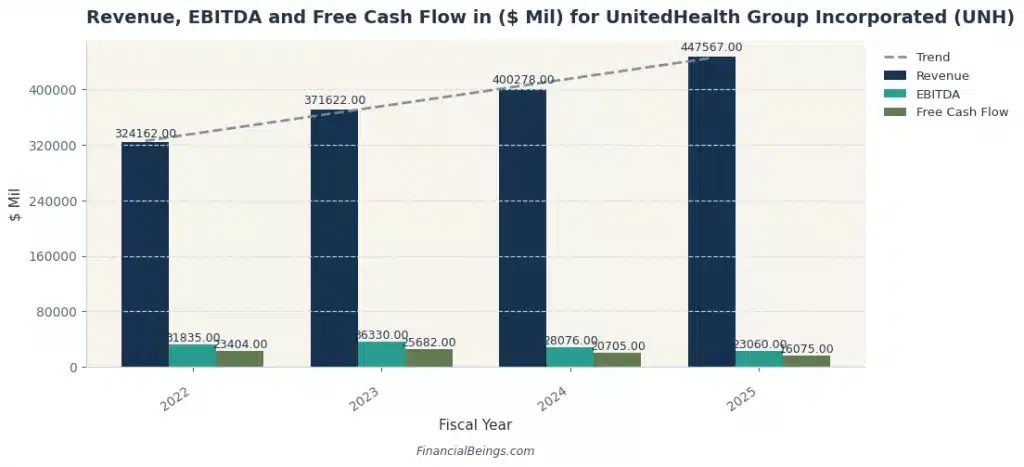
Figure 3: Revenue, EBITDA and Free Cash Flow for UnitedHealth Group (2022–2025)
CVS Health follows with the increase in revenue between $322,467 million and $402,067 million. Despite the improvement in the free cash flow to $7,807 million, EBITDA is volatile.
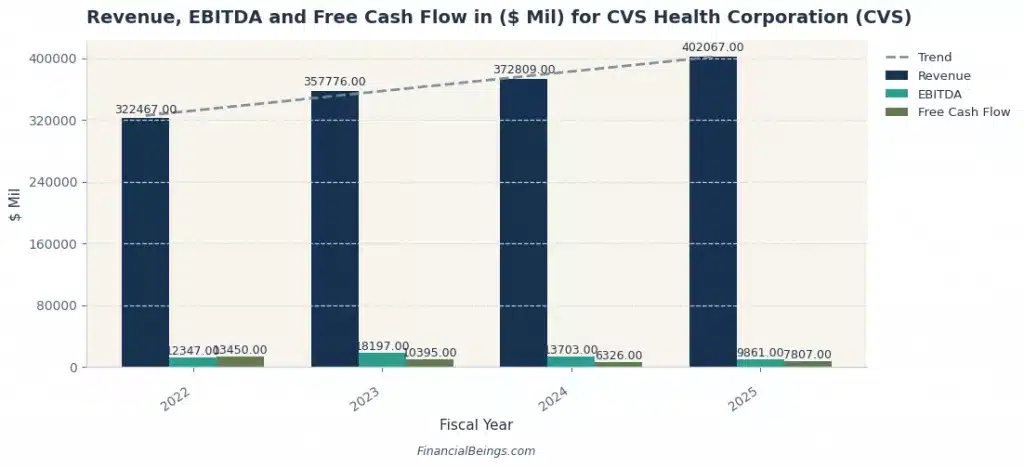
Figure 4: Revenue, EBITDA and Free Cash Flow for CVS Health (2022–2025)
McKesson & Cencora: High Revenue with Stable Conversion
A more balanced model is exhibited by McKesson and Cencora. The growth of McKesson’s revenue is based on increasing its revenue from $263,966 million to $359,051 million, which is backed by the constant increase in EBITDA and the growth in free cash flow to $5226 million.
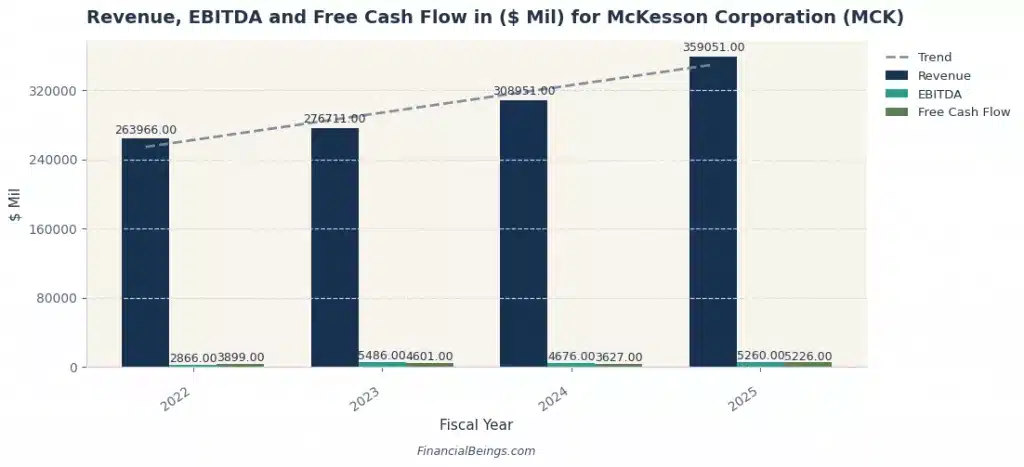
Figure 5: Revenue, EBITDA and Free Cash Flow for McKesson Corporation (2022–2025)
Cencora is no exception, as revenue increased to $238,587 million to $321,332 million, and the free cash flow remained nearly steady at 3,207 million. Both companies also have stable earnings despite their low-margin distribution, meaning that they have good operational discipline and use their capital effectively.
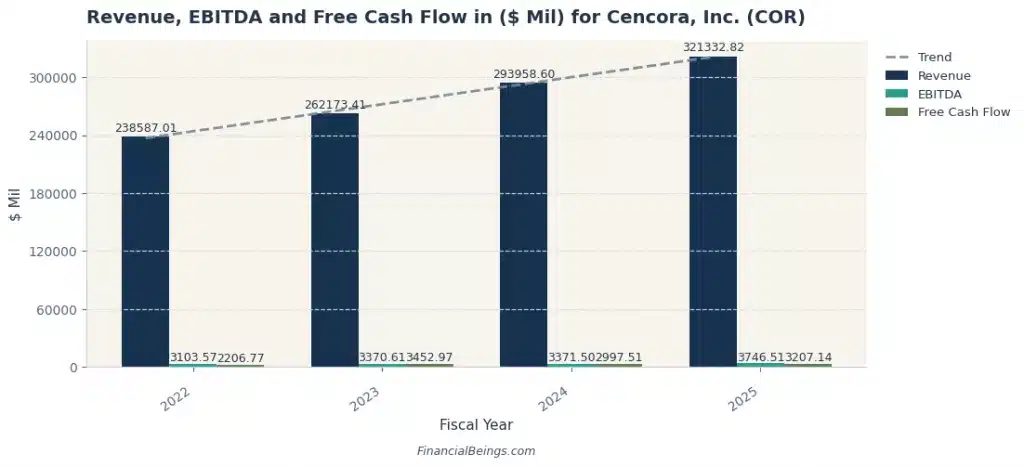
Figure 6: Revenue, EBITDA and Free Cash Flow for Cencora, Inc. (2022–2025)
Cigna & Elevance Health: Managed Growth with Value Retention
Cigna and Elevance Health work at a marginally lower level of revenues but with a good economic performance. Cigna has a growth in revenue by $180,031 million to $274,876 million with its steady free cash flow of $8,389 million.
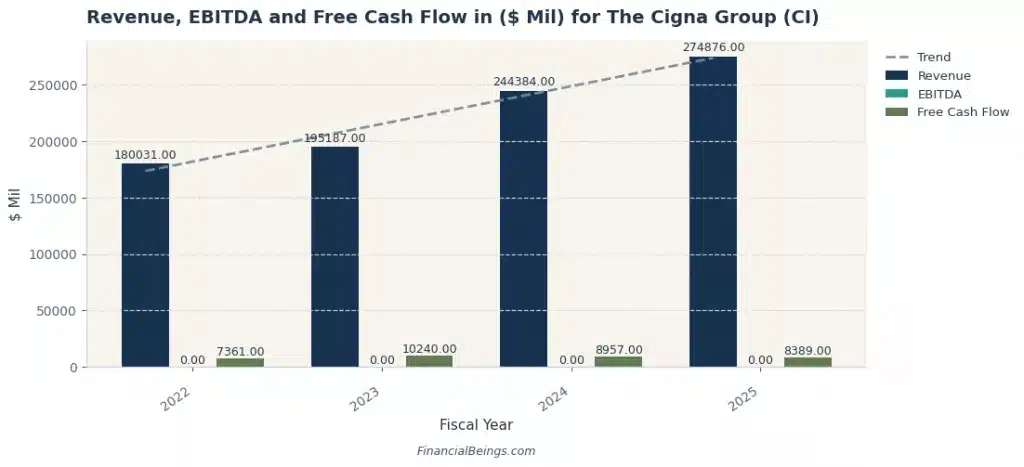
Figure 7: Revenue, EBITDA and Free Cash Flow for Cigna Group (2022–2025)
Elevance earnings increase to $199,125 million as compared to $156,595 million, but free cash flow reduces to $3,174 million. Nonetheless, it can be argued that the performance of both companies is stable, which indicates that disciplined operations and controlled growth contribute to value creation.
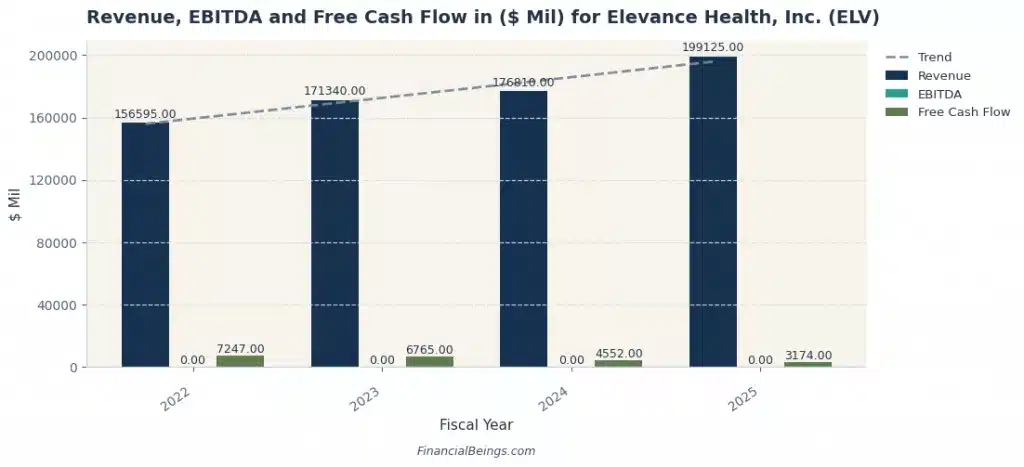
Figure 8: Revenue, EBITDA and Free Cash Flow for Elevance Health, Inc. (2022–2025)
Centene & Molina Healthcare: Growth Without Stability
Centene and Molina Healthcare demonstrate that the growth in revenue is not enough. Centene increases its revenue to $194,777 million, with the EBITDA becoming negative at -$4,775 million, which means that the company is under intense pressure in its operations.
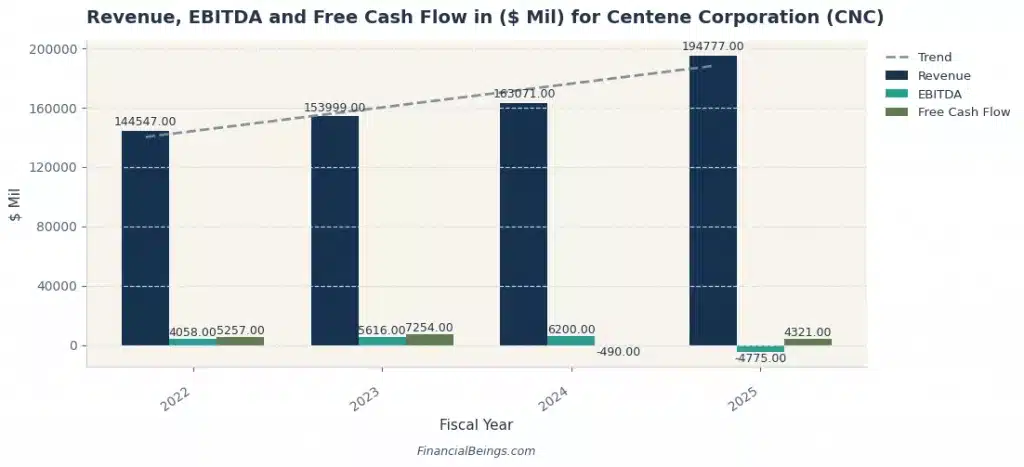
Figure 9: Revenue, EBITDA and Free Cash Flow for Centene Corporation (2022–2025)
Molina Healthcare expands to $31,974 million to $45,426 million, but the EBITDA decreases to $976 million, and free cash flows become negative (-$636 million). These trends underscore that margin less growth and cash flow instability undermine financial performance.
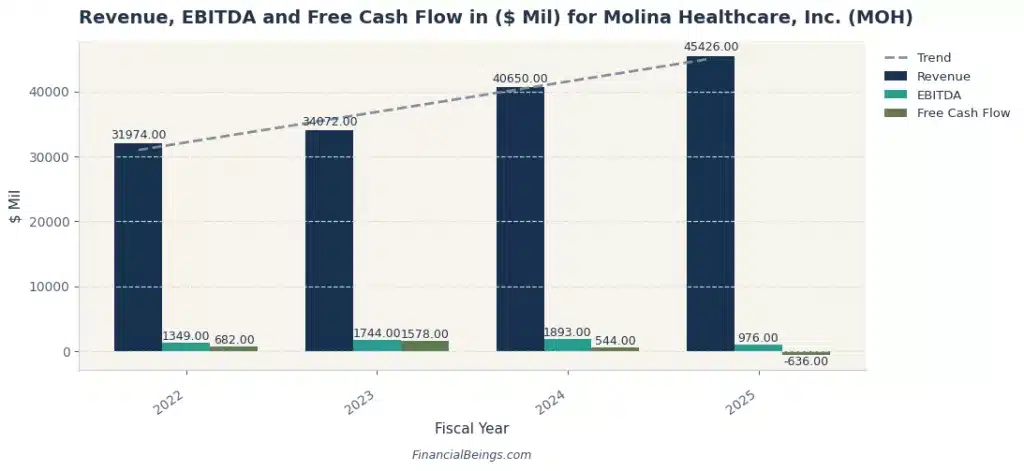
Figure 10: Revenue, EBITDA and Free Cash Flow for Molina Healthcare, Inc. (2022–2025)
Table 3: Revenue Comparison Table (2025)
| Company | Revenue ($M) | EBITDA ($M) | Free Cash Flow ($M) |
| UnitedHealth Group | 447,567 | 23,060 | 16,075 |
| CVS Health | 402,067 | 9,861 | 7,807 |
| McKesson | 359,051 | 5,260 | 5,226 |
| Cencora | 321,332 | 3,746 | 3,207 |
| Cigna | 274,876 | 0 | 8,389 |
| Cardinal Health | 222,578 | 3,106 | 1,850 |
| Elevance Health | 199,125 | 0 | 3,174 |
| Centene | 194,777 | -4,775 | 4,321 |
| HCA Healthcare | 75,600 | 15,603 | 7,692 |
| Molina Healthcare | 45,426 | 976 | -636 |
Leading U.S. Pharmaceutical & Biotech Companies
The US pharmaceutical companies 2026 and biotech segment is a core part of the U.S. healthcare system, but its influence can be most effectively described in terms of revenue streams, cost models and profitability in insurers, distributors and care providers. These companies are not listed directly in the REPS ranking, but their impact is concealed in the performance of McKesson, Cencora, Cigna and UnitedHealth. Research and development are a major force in the wider industry, with U.S. biopharmaceutical companies making substantial investments in innovation and pipeline development.
Operational Efficiency in Pharmaceutical Distribution
The impact of pharmaceutical pipelines is the most apparent in the distribution-oriented companies. Both Cencora and McKesson have excellent growth in revenue, where Cencora grew from about $238,587 million to $321,332 million, and McKesson grew from $263,966 million to $359,051 million. These growths are linked to the growth of drug pipelines and the rise in demand for speciality medications, especially in fields like oncology and treatment of chronic diseases.
The major distinguishing factor, however, is the efficiency with which this revenue can be converted to profit. The companies have stable EBITDA and free cash flow, which leads to high REPS performance. Conversely, although the exposure of Cardinal Health to the pharmaceutical distribution and the increase in revenue are similar, i.e. $181,326 million to $222,578 million, the free cash flow and efficiency are weaker. It means that the demand that is fueled by the pipeline should be balanced by operational discipline to create value.
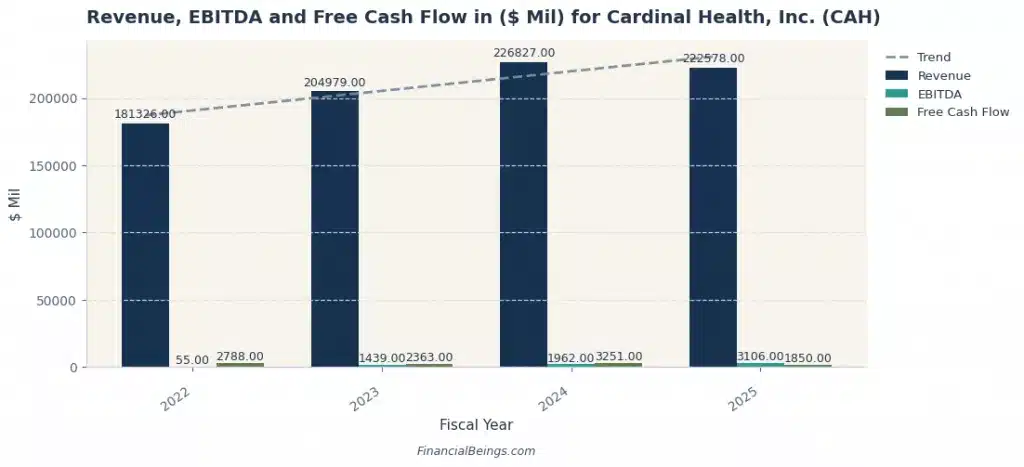
Figure 11: Revenue, EBITDA and Free Cash Flow for Cardinal Health, Inc. (2022–2025)
Role of Major Drugs in Insurance and Care Models
Pharmaceutical innovation directly affects insurers like Cigna and Elevance Health. The growth in revenue is by a significant percentage to $274,876 million, with a good free cash flow of $8,389 million. This incorporates efficient cost control and pricing systems concerning the use of the drugs. Elevance Health also has a stable increase in revenues to $199,125 million, but declining free cash flow demonstrates narrower margins.
The impact of large drugs is also reflected in the general pattern of healthcare spending, in which a small number of high-value treatments contribute a significant part of the revenue increase. Such a concentration puts more pressure on insurers to find a balance between cost and access, and efficiency becomes a crucial factor in sustaining value creation.
Industry Impact on Profitability and Value Creation
The pharmaceutical and biotech industry is a contributor to healthcare growth, and its economic contribution throughout the value chain is different. Firms that act as Intermediaries between producers, distributors and insurers have a direct advantage in being able to see an increase in drug demand, but their capacity to create value is constrained by cost management and capital productivity.
On the whole, the largest pharma companies USA 2026 and the biotech industry are one of the most important powerhouses of healthcare growth, yet their actual effectiveness depends on the ability of companies to control the circulation of innovation, prices, and distribution in the larger system.
Top U.S. Medical Device Companies
The influence of US medical device companies 2026 can be best explained by the efficiency of the usage of advanced equipment by healthcare providers in their business. HCA Healthcare gives the best pointers for successfully integrating the devices. Its sales grow by an average of about $60,233 million to $75,600 million, and EBITDA by $13,290 million to $15,603 million, and free cash flow by $4,127 million to $7,692 million. Such a steady increase indicates that the adoption of modern medical technologies helps to ensure a high level of operational efficiency, effective cost management, and cash generation.
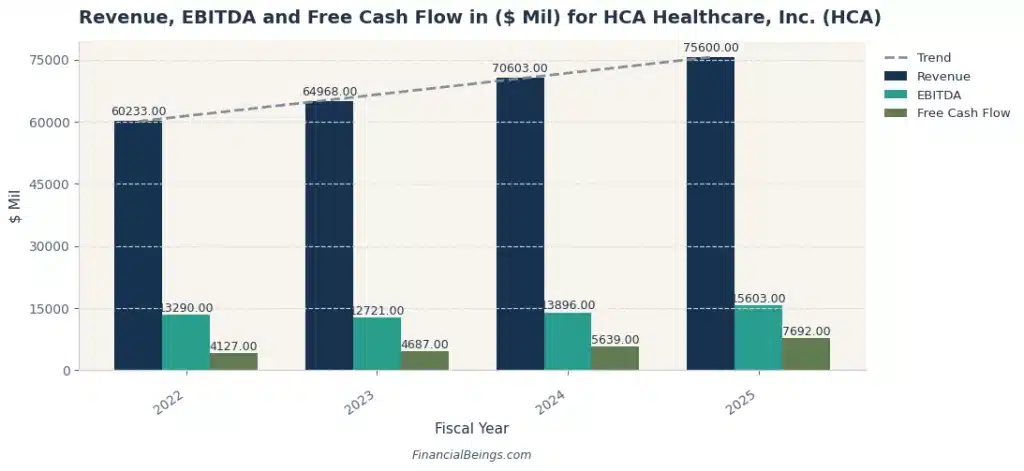
Figure 12: Revenue, EBITDA and Free Cash Flow for HCA Healthcare, Inc. (2022–2025)
Device Utilization and Operational Efficiency
Medical equipment directly affects the hospital staff’s productivity and the treatment capacity. The good financial performance of HCA shows that efficient use of surgical equipment, diagnostic equipment, and treatment technology improves throughput and profitability. However, the same level of efficiency is not evident in companies that are more complex and diversified, including UnitedHealth and CVS Health. The revenue of UnitedHealth grows considerably to reach $447,567 million, but EBITDA and free cash flow decrease with time, which proves that the efficiency benefits of using medical devices are not entirely reflected in scale.
Efficiency Gap Across Healthcare Models
This comparison highlights that there is a marked efficiency gap. The HCA’s targeted care delivery model transforms the activity in the operational process into fixed income and high cash flow, where bigger integrated organizations have falling margins despite increased revenues. This implies that the efficiency of medical devices is optimized in lean operating situations as opposed to multi-segment functionalities.
Fastest-Growing U.S. Healthcare Companies (2026)
The fastest-growing healthcare companies USA 2026 are characterized by strong annual growth of revenue, yet growth does not ensure economic power. Various companies show a steady growth in revenue between 2022 and 2025, but their profitability and cash flow patterns differ significantly, and the distinction between growing and sustainable performance.
High Growth with Strong Value Conversion
The Cigna Group is one of the strongest growth profiles. The revenue grows to about $180,031 million to $274,876 million, which is backed by the stable free cash flow of about $8,389 million. This means that it increases with stable earnings quality. Likewise, McKesson grows revenue to $263,966 million to $359,051 million, keeps the EBITDA constant and increases free cash flow to $5.226 million. These businesses show that expansion, coupled with consistent cash flow, results in better financial performance.
Growth with Declining Efficiency
UnitedHealth Group and CVS Health demonstrate considerable growth, with less efficiency. UnitedHealth’s revenue goes up to $447,567 billion, but EBITDA decreases, and free cash flow decrease over time. CVS increases up to $402067 million, yet the volatility of the EBITDA and irregular cash flow restrain performance. This implies that high growth rates in complicated operating models may decrease profitability even though revenue improvements are great.
Growth Without Profit Stability
Centene and Molina Healthcare bring out the risks of uncontrolled growth. Centene increases revenue to $194,777 million, whereas the EBITDA becomes negative -$4,775 million, which is a sign of extreme pressure on the margin. Molina Healthcare also expands to $45,426 million, but the EBITDA decreases, and the free cash flow is negative (-$636 million). These tendencies indicate that unstable growth in terms of margins results in poor financial performance.
U.S. Healthcare Industry Trends in 2026
The 2026 healthcare environment demonstrates a significant change towards efficiency-oriented models, in which the use of technology and cost control have a direct impact on financial performance. The companies that have a constant income and cash flow are in a better position to take advantage of such structural trends.
AI & ML in Drug Discovery and Operations
Machine learning and artificial intelligence are enhancing decision-making and cost management, as well as efficiency within operations. It can be seen in companies like McKesson and Cencora, where the revenue is steadily rising at $359,051 million and $321,332 million, respectively, and the EBITDA and free cash flow remain constant. This implies that better operating systems facilitate consistency in performance.
Telemedicine and Digital Expansion
E-healthcare models are driving up the revenues of insurers. Both UnitedHealth and CVS demonstrate good revenue growth to $447,567 million and $402,067 million. Nevertheless, falling EBITDA and fluctuating cash flow suggest that adoption of technology should be accompanied by efficiency to generate value.
Value-Based Care and Insurance Innovation
US health insurance companies 2026 such as Cigna and Elevance, show how value-based models are supported by controlled growth. With a strong free cash flow of $8,389 million and a revenue of $274,876 million, Cigna is a company that manages its costs well, which correlates with improved financial results.
Aging Population and Cost Pressure
The increasing demand can be observed in all the companies, especially in Centene and Molina Healthcare. Although revenue grows to $194,777 million and $45,426 million, decreasing profitability and negative cash flow indicate that demand also puts pressure on costs.
Conclusion
In conclusion, efficiency determines the value creation within the U.S. healthcare. Although companies such as UnitedHealth and CVS have the largest revenue, they do not yield the highest economic returns. Conversely, HCA Healthcare has definitely better REPS, which is backed by stable growth in EBITDA and free cash flows.
There are those companies which convert growth into value, and some huge companies are unable to perform. In general, the key point is that sustainable performance is dependent on consistent earnings, strong cash flow, and strict capital utilization rather than revenue growth.
All calculations and valuation estimates are FinancialBeings’ own, based on data sourced from SEC filings and Yahoo Finance. Use or reproduction before prior approval is prohibited.
Frequently Asked Questions (FAQs)
What is the largest healthcare company in the U.S. in 2026?
UnitedHealth Group is the largest healthcare company in USA 2026, and revenue is projected to be about $447,567 million in 2025. Nevertheless, even with its size, its REPS is moderate, which demonstrates that scale does not always result in the highest level of value creation.
Which U.S. healthcare sector is growing fastest?
Insurance and healthcare services are the fastest-developing areas, with such companies as UnitedHealth, CVS Health, and Cigna demonstrating good revenue growth by 2025. Quality of growth varies; only a few firms transform this growth into steady revenues and cash flow.
How do Pharma and healthcare services companies differ in the U.S.?
Pharma-related firms affect revenue by impacting drug demand, as shown by the growth of pharmaceutical distributors such as McKesson and Cencora. Conversely, healthcare services companies like insurers and providers directly handle costs and operations, and their productivity and cash flow become more important in value creation.
Why is REPS a better measure than revenue for comparing healthcare companies?
REPS is better than raw revenue in comparing the US healthcare companies since it is more concerned with the profitability and efficiency of the operation, instead of size. Whereas revenue reflects top-line growth only, REPS also emphasizes the effectiveness with which companies control their costs and make a profit on particular segments of patients or services.
Why do some large healthcare companies fail to create value?
The USA healthcare giants fail to generate value because of insurmountable adoption barriers by reluctant providers, inability to negotiate through cumbersome regulatory and reimbursement controls, and costly and inefficient mergers. Moreover, they can experience incumbent blockades (established players that do not want change) and have not been able to implement new technologies into the current clinical processes.
What is the most important factor for healthcare company performance in 2026?
According to the future considerations of the industry in 2026, the strategic implementation of generative and agentic AI to facilitate operational and financial sustainability is the most critical consideration in the performance of the healthcare company in the USA.
Usama Ali
Usama Ali is the founder of Financial Beings and a self-taught investor who blends classic valuation study with insights from psychology. Inspired by works from Benjamin Graham, Aswath Damodaran, Stephen Penman, Daniel Kahneman, and Morgan Housel, he shares independent, data-driven research to help readers connect money, mind, and happiness.
Disclaimer
The content provided herein is for informational purposes only and should not be construed as financial, investment, or other professional advice. It does not constitute a recommendation or an offer to buy or sell any financial instruments. The company accepts no responsibility for any loss or damage incurred as a result of reliance on the information provided. We strongly encourage consulting with a qualified financial advisor before making any investment decisions.
