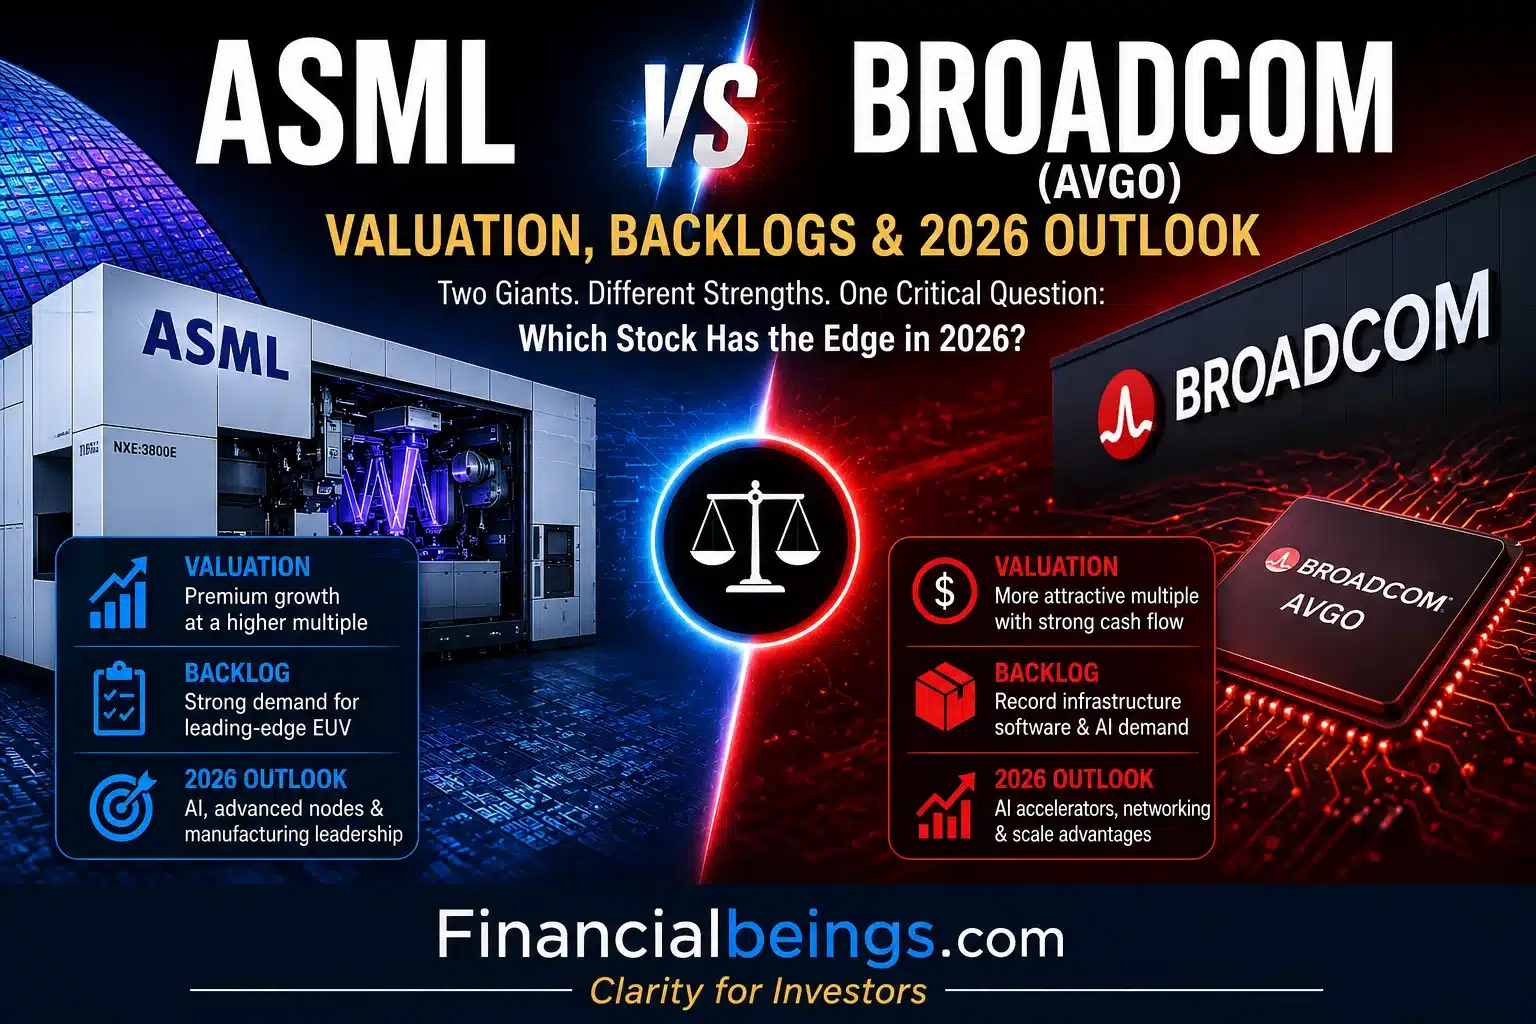
The verdict. If you want it in one line: both are expensive, but ASML is the cheaper expensive one. On forward P/E, Broadcom looks like the bargain (~20.9× versus ~35.3×) — flip to residual-income economics and it reverses, with 37.1% of ASML’s price backed by today’s earning power against just 23.9% for Broadcom. Treat them as two different jobs in a portfolio: Broadcom is the high-growth sleeve, a $73B AI backlog priced for near-flawless execution; ASML is the monopoly-moat sleeve, the only maker of EUV, with multi-year visibility and a clean balance sheet. Neither is mispriced — you’re picking which premium you trust.
The surge in AI is transforming the entire chip supply chain, and this is reflected in the rivalry between two of the most powerful players in the semiconductor industry. One end is the Dutch company ASML Holding (NASDAQ: ASML), a world leader and a monopoly in the market for printing leading-edge nodes, the Extreme Ultraviolet (EUV) lithography machines. The other is Broadcom Inc. (NASDAQ: AVGO), a designer of custom-made silicon and chips used by the world’s biggest data centers to power high-speed networking and provide AI capabilities.
The ASML vs Broadcom debate isn’t about which company is stronger; it’s about two completely different paths to winning in AI. ASML is effectively a monopoly in EUV lithography, meaning every chip maker building at 3nm and below becomes a captive customer. Broadcom (AVGO), meanwhile, has emerged as the hyperscaler custom-silicon arms dealer, carrying a $73 billion-plus AI backlog and guiding to more than $100 billion in AI revenue by FY2027, with AI-chip revenue up 143% in Q2 FY2026.
The ASML vs Broadcom valuation and growth dynamics make for a distinct investment discussion, with ASML offering monopoly safety and Broadcom near-term AI upside. ASML shares have rallied around 64% year-to-date to $1,757.47 as of June 4, 2026, while Broadcom (AVGO) closed at $418.91 on June 4 — down roughly 12.6% that session despite a record quarter. It is an AI-era stock comparison that exposes the disconnect between business performance and share-price performance.
June 2026 Snapshot: ASML vs Broadcom at a Glance
| Metric | ASML | Broadcom (AVGO) |
| Price (Jun 4, 2026 close) | $1,757.47 | $418.91 |
| Market Cap | $677.4B | $1,983.4B |
| FY2025 Revenue | €32.7B (~$32.67B) | $63.89B |
| FY2025 Residual Operating Income | $8.28B | $14.05B |
| Speculative Growth Share of Price | 84.9% | 88.8% |
| ROE (TTM) | 49.9% | 31.3% |
| RNOA (Sustainable) | 89.4% | 33.0% |
| Forward P/E | ~35.3× | ~20.9× |
| Dividend Yield | ~0.4% | ~0.6% |
| Value/Price @ 10% Hurdle | 37.1% | 23.9% |
| Market-Implied Perpetual Growth | 8.74% | 9.26% |
| 2026 Backlog | €38.8B (record 45-unit EUV backlog) | $73B+ AI backlog; FY27 AI >$100B guided |
| Balance Sheet Safety (7 checks) | PASS 7/7 (all 3 years) | FAIL NBC check (all 3 years) |
ASML Overview & ASML Stock Analysis
ASML is the only global company that produces Extreme Ultraviolet (EUV) lithography machines, which are used to print the most advanced chips in the world. No EUV, no cutting-edge AI silicon. Net sales for FY25 were €32.7 billion, and the net income was €9.6 billion. Q1 2026 delivered €8.8 billion in sales (+13% y/y) at a 53% gross margin, with FY2026 guidance raised to €36–40 billion.
ASML’s sales backlog for 2026 was €38.8 billion at the beginning of the year. Record bookings of €13.2 billion (€7.4 billion EUV) were achieved in Q4 2025 and a record 45-unit EUV system backlog, with TSMC, Samsung and Intel waiting in line for 2nm or below production. That backlog is a real multi-year visibility, and that’s reflected in the price today.
What makes ASML so special is its capital-light business model, where customers pay for machines upfront, and ASML’s stock intrinsic value after Q2 2025 earnings. It operates with net operating capital of €11 billion and delivers a sustainable RNOA of 89.4% (28.5% margin × 3.1 turnover). Around 40% of its revenue comes from services, creating a strong recurring income stream in addition to equipment sales. However, the real risk is not the business itself but the valuation.
The residual income model suggests that only 37.1% of the current share price is justified at a 10% required return. In fact, the market is pricing in a perpetual growth rate of 8.74%—nearly three times the long-term global GDP growth rate. For such a dominant monopoly, the price already reflects extreme expectations.
It’s not the business that is the risk; it’s the price. Yet the residual-income model justifies only 37.1% of the current share price at a 10% required return. The market’s implied perpetual growth rate is 8.74% — roughly three times the long-run real GDP growth rate. For this monopoly, the price already knows.
ASML Pros & Cons
| Pros | Cons |
| Sole global supplier of EUV lithography machines — literal monopoly | Price embeds 8.74% perpetual growth – minimal margin of safety |
| RNOA of 89.4% – pre-payments fund the asset base | ~85% of share price rests on undelivered future earnings |
| €38.8B backlog – multi-year revenue visibility | China revenue at risk from MATCH Act / export controls |
| Clean balance sheet: PASS 7/7 safety checks, 3 years running | High stock price concentration in a single product category (EUV) |
| Services ~40% of revenue – recurring annuity stream | Cycle risk: chip capex can pause even with long backlogs |
Broadcom AVGO Overview & Analysis
Broadcom develops custom-made AI accelerators (XPUs) and high-speed networking devices for the largest hyperscalers in the world. The Q2 FY2026 results left no room for doubt: revenue of $22.2 billion, up 48% year-over-year; an adjusted EBITDA margin of 69%; AI semiconductor revenue of $10.8 billion, which represented a 143% increase year-over-year; and an EPS of $2.44 versus consensus of about $2.40. The revenue guidance for Q3 is about $29.4 billion, which is up 84% y/y, while AI revenue is projected to be ~$16 billion, representing a 200% increase y/y.
For a deeper breakdown of Broadcom’s earnings performance, long-term outlook, and valuation expectations, you can also explore this detailed analysis of Broadcom earnings.
The full-year AI revenue is expected to be around $56 billion for FY2026, with management specifically highlighting an AI revenue exceeding $100 billion for FY2027. The Broadcom AI backlog is $73 billion+, with unprecedented visibility into committed revenue and one of the most aggressive forward-looking paths in the industry.
One structural change is that the VMware buyout added total assets of about $72.9 billion to about $165.6 billion, the result of which was the balance sheet being loaded with goodwill and intangibles. The Sustainable RNOA dropped from 134% (pre-acquisition era) to 33.0% in FY2025. It was still elite, but it was not a state of the game that persisted from year to year; it was a period, and that period has passed.
There are two quality flags that are important. First, the FY2025 effective tax rate was 1.75% which normalised to 21% for sustainable earning power; headline EPS is materially flattered. Second, Broadcom’s financing-cost (NBC) safety check is failing in all three years tested, as a result of the VMware debt burden. This is the only negative check mark on a stellar balance sheet, as 6 of 7 are passing.
Broadcom AVGO Pros & Cons
| Pros | Cons |
| $73B+ AI backlog with >$100B FY2027 AI revenue guided | Price implies 9.26% perpetual growth – most demanding in this pair |
| AI chip revenue +143% y/y in Q2 FY2026 — explosive growth | NBC safety-check FAIL three consecutive years (VMware debt legacy) |
| Infrastructure software (VMware) adds recurring revenue base | FY2025 tax rate 1.75% flatters headline EPS vs. normalized 21% |
| Forward P/E ~20.9× – looks cheaper on this metric vs. ASML | Hyperscaler customer concentration – few clients, binary quarters |
| 69% adjusted EBITDA margin on Q2 FY2026 revenue | ~88.8% of price depends on future earnings not yet delivered |
FinancialBeings Valuation Lens
ASML vs Broadcom Valuation: The Surprising Truth
The conventional valuation read on the ASML vs Broadcom stock says that the latter is cheaper as its forward P/E is ~20.9× compared to ASML’s ~35.3×. This reading is misleading. At all required returns, Broadcom AVGO is the more expensive stock in residual income economics.
At the 10% hurdle rate, ASML’s model value covers 37.1% of its price — 37 cents of intrinsic value per dollar of market cap — versus 23.9 cents for AVGO. The right frame: Broadcom is growing faster, but ASML’s price demands less. AVGO’s forward-P/E advantage is real but misleading, because its earnings denominator is flattered by a 1.75% tax rate and acquisition-accounting noise that would disappear under a normalized look at earnings.
AVGO Valuation
| Growth (%) | Model Value ($B) | Model Price/Share | Model Value % |
|---|
Model Value % > 100% = The model value exceeds the current market cap under the stated assumptions. Model Value % < 100% = The current market cap is above the model value under the stated assumptions. Model Value % = 100% = The model value matches the current market cap at the assumed growth rate.
At 2% growth, AVGO’s model value reaches a Model Value % of 13.0% relative to current market cap. At 5% growth, the model reaches a Model Value % of 18.3%, and at 8% growth the model reaches 39.5% of current market cap.
The market-implied breakeven growth rate is approximately 9.3%. That is the long-term growth assumption where the model value lines up with a company already valued at roughly $1,983B, showing what the market appears to require from Broadcom’s semiconductor and infrastructure-software franchises, including AI networking and custom-silicon (XPU) lines plus the VMware software stack.
Note: Under the 10% hurdle rate scenario set, AVGO does not reach 100% Model Value anywhere in the tested 2%–9% range — its market-implied breakeven sits just beyond, at ~9.3% growth. Within the range the market cap stays above model value, with AVGO worth about 39.5% of market cap at 8% growth, rising to 74.9% at 9%..
ASML Valuation
| Growth (%) | Model Value ($B) | Model Price/Share | Model Value % |
|---|
Model Value % > 100% = The model value exceeds the current market cap under the stated assumptions. Model Value % < 100% = The current market cap is above the model value under the stated assumptions. Model Value % = 100% = The model value matches the current market cap at the assumed growth rate.
At 2% growth, ASML's model value reaches a Model Value % of 18.2% relative to current market cap. At 5% growth, the model reaches a Model Value % of 27.4%, and at 8% growth the model reaches 64.0% of current market cap.
The market-implied breakeven growth rate is approximately 8.7%. That is the long-term growth assumption where the model value lines up with a company already valued at roughly $677B, showing what the market appears to require from ASML's EUV and DUV lithography franchise, the toolset that underpins advanced semiconductor manufacturing worldwide.
Note: Under the 10% hurdle rate scenario set, ASML crosses 100% Model Value at ~8.7% growth — between the 8% (64.0%) and 9% (125.2%) rows of the sensitivity table. Below that breakeven the market cap stays above model value; beyond it model value climbs steeply, passing 100% by 9% growth..
Growth Sensitivity at 10% Hurdle (r = 10%)
| Growth (g) | ASML Value/Price | ASML Value/Share | AVGO Value/Price | AVGO Value/Share |
| 2% | 18.2% | $319.47 | 13.0% | $54.26 |
| 3% | 20.4% | $357.83 | 14.2% | $59.56 |
| 4% | 23.3% | $408.99 | 15.9% | $66.62 |
| 5% | 27.4% | $480.61 | 18.3% | $76.51 |
| 6% | 33.5% | $588.05 | 21.8% | $91.35 |
| 7% | 43.7% | $767.10 | 27.7% | $116.07 |
| 8% | 64.0% | $1,125.21 | 39.5% | $165.52 |
| 9% | 125.2% | $2,199.53 | 74.9% | $313.88 |
Even at 9% perpetual growth, top-of-tree optimism, AVGO's price is only 74.9% covered; ASML breaks through 100% at the same growth rate.
Key Multiples: Head-to-Head
| Metric | ASML | AVGO | Note |
| Forward P/E | ~35.3× | ~20.9× | AVGO screens cheaper but misleading |
| Trailing P/E (TTM) | ~56.6× | ~67.1× | AVGO distorted by acquisition accounting |
| Dividend Yield | ~0.4% | ~0.6% | Immaterial to either thesis |
| ROE (TTM) | 49.9% | 31.3% | Trailing 12 months |
| RNOA (Sustainable) | 89.4% | 33.0% | Financial Beings proprietary lens |
| Value/Price @ 10% Hurdle | 37.1% | 23.9% | Core comparison - ASML scores higher |
Expected-Return Ladder: What You Earn at Today's Prices
| Long-Term Growth (g) | ASML Expected Return | AVGO Expected Return |
| 2% | 3.45% | 3.10% |
| 3% | 4.43% | 4.06% |
| 4% | 5.42% | 5.03% |
| 5% | 6.40% | 5.99% |
| 6% | 7.38% | 6.95% |
| 7% | 8.37% | 7.92% |
| 8% | 9.35% | 8.88% |
| 9% | 10.33% | 9.85% |
At mid-range growth (5-6%), both stocks offer about 6-7% a year — bond-plus-equity-risk compensation. The top-end outcomes depend on top-end growth being sustained over a decade or longer.
ASML Backlog 2026 & Broadcom AI Backlog: Visibility with Strings Attached
The two most frequently misjudged bull cases are both related to backlogs. The revenue in the ASML 2026 backlog of €38.8 billion and the Broadcom AI backlog of $73 billion+ are real, committed revenue. They too are already in the price and are concentrated asymmetrically.
For ASML, the risk is geopolitical because there is a proposal to prohibit DUV immersion exports and, more importantly, servicing of already installed ASML tools in China. China was 36% of system sales in Q4 2025, falling to 19% in Q1 2026 as ASML managed toward its ~20% FY2026 assumption. If China access is limited or the service business is banned, the recurring annuity at the core of the bull thesis would be impaired, since services make up about 40% of ASML's revenue.
Concentration is the risk for Broadcom. A handful of hyperscaler customers account for nearly all of the $73 billion AI backlog. A program slip, a capex-digestion quarter, or a shift in architectural preference can turn any quarter binary — exactly the set-up that produced a −12.6% session on a +143% AI-chip print. 88.8% of AVGO's value rests on future earnings the company has yet to deliver, and the implied long-term growth rate is 9.26%, so even a single underwhelming year would carry a price.
Both Rate sensitivity and the decline in ASML's Value/Price from 64% to 23% and AVGO's Value/Price from 42% to 15% are significant when the discount rate is increased from 8% to 12%. With most of each price in long-dated growth, these are duration stocks masquerading as growth stocks.
Investment Framework & 2026 Outlook
| Scenario | What Happens | Model Anchor | ASML Read | AVGO Read |
| Bear | Export controls pass; AI spend decelerates hard | g → 2–4%; ER 3.1–5.4%/yr | China annuity impaired; cycle reasserts | Backlog conversion slows; concentration cuts both ways |
| Base | Backlogs convert; growth normalizes | g → 5–6%; ER ~6–7.4%/yr | €36–40B guide delivered; clean balance sheet compounds | FY26 AI ~$56B lands; FY27 >$100B credible |
| Bull | AI capex broadens; both beat and raise | g → 7–9%; ER 8.4–10.3%/yr | Bookings re-accelerate ex-China | FY27 >$100B AI revenue with margins held |
Even in the bull case, expected returns top out near ~10% a year from here; positive surprises tend to defend the current price rather than create a bargain. The key items to watch in 2026 are backlog-conversion rates and guidance integrity at each quarterly print.
While Financial Beings is not giving you personalized investment advice, the following is an example of how the allocation between AVGO and ASML can provide different exposure to the AI supply chain, with AVGO a high-growth sleeve and ASML a monopoly moat sleeve in the semiconductor allocation. The quantitative benchmark for the above expected-return ladder is what each position offers at the current prices.
Conclusion: Neither Is Wrong - Both Are Priced
Comparing the ASML and Broadcom AI stocks for 2026 isn't a comparison of who's better. They're both strategically irreplaceable in the semiconductor supply chain. The issue of the debate is what premium do you believe in, and what would be sufficient evidence to change your opinion?
ASML stock has a monopoly premium (37.1% of the stock price is backed by current earning power), a clean balance sheet, and an EUV moat, which justify the structural premium. Broadcom AVGO has a growth premium: only 23.9 cents of model value per dollar and an implied perpetual growth rate of 9.26% that requires flawless execution across all hyperscaler relationships and product cycles for decades.
Keep an eye on ASML's conversion of its 2026 backlog into the €36-40B guidance range, Broadcom's progress against its ~$56B FY2026 AI-revenue guidance, and any legislative progress on export controls that could affect the two companies' China exposure. In the ASML vs Broadcom debate, the winner is decided not by who performs better, but by who disappoints less relative to the price.
Why did Broadcom stock fall after its record Q2 2026 earnings?
Expectations. Revenue rose 48% and AI-chip revenue jumped 143%, but the stock had run up sharply into the print, so expectations were already extreme. Q3 guidance was strong yet failed to beat the most aggressive numbers baked into the price — and management declined to raise its full-year $100B AI target — so the shares still closed down about 12.6% on June 4. That expectation risk is the single biggest lesson in this AI-stock comparison.
Is ASML stock overvalued in 2026?
At a 10% required return, the model backs only ~37% of ASML's price, implying the market is pricing in about 8.74% perpetual growth. The counterweights are the EUV monopoly, the €38.8B 2026 backlog and a clean balance sheet. Richly valued, yes — but not unreasonably so for a monopoly with no alternatives.
Which is safer - ASML stock or Broadcom AVGO?
On the balance sheet, ASML passes all seven safety checks in each of the last three years, while Broadcom fails one — the financing-cost (NBC) check — in each of those years. On price, both look stretched: 84.9% of ASML's value and 88.8% of Broadcom's depends on earnings not yet delivered.
What growth rates do current prices assume?
At a 10% hurdle: ASML is ~8.74% perpetual residual income growth, AVGO is ~9.26% perpetual residual income growth, both well above long-run nominal GDP growth — meaning the market expects near-peak returns on capital to persist indefinitely.
What is the ASML backlog in 2026?
€38.8 billion entering 2026, with Q4 2025 bookings of €13.2B (€7.4B EUV) and a record 45-unit EUV system backlog in Q1 2026. FY2026 revenue guidance: €36–40B.
How big is Broadcom's AI backlog?
In committed AI revenue, $73 billion+ in revenue. FY2026 AI revenue guided at ~$56B; management points to >$100B in FY2027.
