Alphabet, the parent company of Google, is spending tens of billions of dollars a quarter on data centers and AI chips. Demand appears strong, but capital spending precedes the revenue that new capacity may generate.
Here’s the short answer to anyone looking for an Alphabet Stock Forecast 2030 (or a Google stock forecast 2030). At a 10% hurdle rate, our model gives illustrative end-2030 values of $178.89 to $564.90, compared with the $278.99 reference price on 2 November 2026. That implies annualized price returns of -10.13% to +18.47%. The range is based on the assumption that Alphabet’s “excess” profit increases by 2%-8% for eternity. The values make no interim dividend deduction or separate future dilution adjustment. No probabilities are assigned.
Let’s take a moment to see how we got here and how Alphabet needs to get to the high end.
GOOGL Stock Forecast 2030: How Published Targets Compare
There are a lot of published targets, but they are done in various ways. Some are from computer models and some from writers. Most Wall Street analysts only peer 12 months out.
| Source | Type | Target | Time frame | What it implies from $278.99 |
| Motley Fool (Sept 2025) | Editorial | About $415 | 2030 | About 10% a year |
| WallStSmart (May 2026) | Website model | $685.04 | 2030 base case | About 24% a year |
| Morgan Stanley (29 Oct 2026) | Analyst | $375 (cut from $400) | 12 months | +34% |
| Bernstein (29 Oct 2026) | Analyst | $325 (cut from $385) | 12 months | +16% |
| DA Davidson (29 Oct 2026) | Analyst | $300 (cut from $350) | 12 months | +8% |
The Motley Fool’s estimate was based on the company’s sales growing by double digits, an operating margin in the low 30s, and a price-to-earnings ratio in the mid-20s, which would indicate a price of around $415 by 2030. Price-to-earnings (P/E) is share price divided by earnings per share (EPS). Using the same illustrative 2030 EPS of $16.50 for comparison, $415 implies 25.15x P/E and $685.04 implies 41.52x. This is a separate earnings test, not our valuation formula.
These forecasts were published on different dates and use different assumptions. All three analyst targets were cut following the last results. That leads to the bad week.
Why Alphabet Fell After Q3 2026
Alphabet’s Q3 2026 earnings, on the surface, seemed to be good. Google Cloud revenue more than doubled to $30.7 billion, while consolidated operating income grew 30 percent to $40.6 billion, revenue grew 25 percent to $127.6 billion, and Google Cloud had a backlog of $561 billion, all of which was reported by Alphabet.
Investors reacted negatively. The stock price dipped approximately 12.6% on 29 October, its worst day since it began trading more than 20 years ago, and continued to drop to our $278.99 reference price on 2 November, according to the saved valuation snapshot. The one-day decline was reported by Fortune.
Why? Reported GAAP earnings per share were $2.12, affected by an $8.7 billion loss on equity securities. Management identified an unrealized SpaceX loss as the main driver. That wasn’t related to the core business. The greater concern was cash. Operating cash flow also reflected inventory buildup and a $5.2 billion payment of a European Commission fine. Data centers, networking, servers, and AI equipment contributed to a $51.36 billion cap-ex spend in Q3, which exceeded the cash its operations brought in, leaving free cash flow at negative $9.1 billion. Capex, which is an acronym for Capital expenditure, refers to spending on long-term items such as buildings and equipment.
Which Earnings and Operating Returns Should We Use?
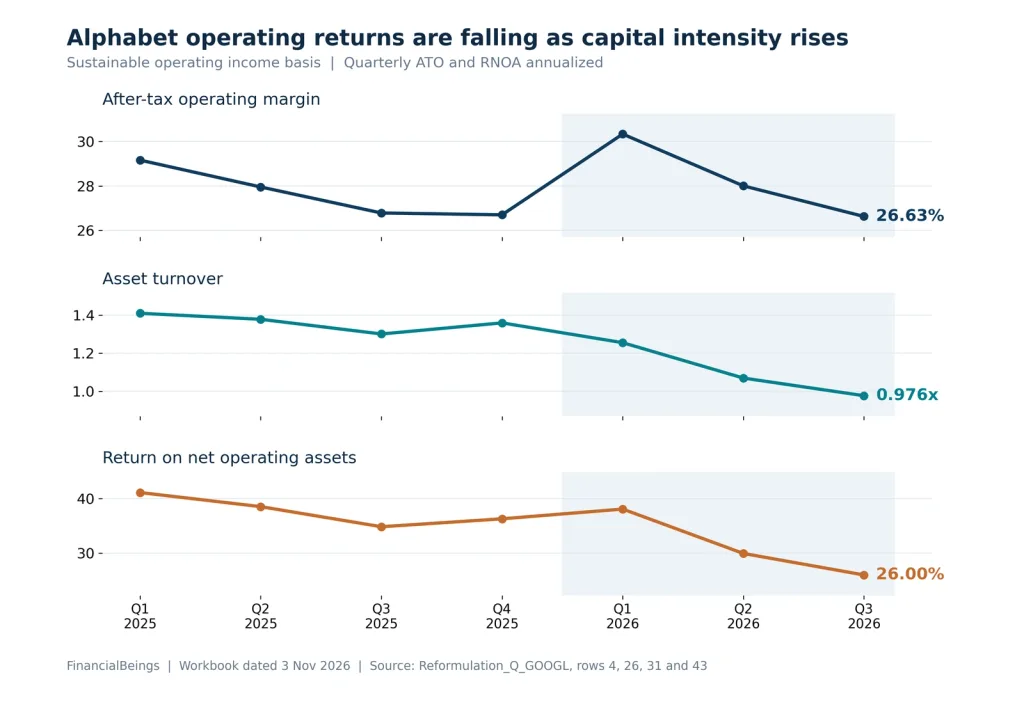
Headline profit is full of noise. We refer to normalized after-tax operating profit after excluding investment gains and losses and making the model’s other adjustments as “sustainable operating income”. Based on that, the margin is stable. The decline has been in revenue per dollar of assets.
Three basic concepts assist:
- Profit margin: how many cents of sustainable after-tax operating profit Alphabet keeps from each dollar of sales.
- Asset turnover: annualized quarterly sales divided by prior-quarter net operating assets (NOA).
- Return on net operating assets (RNOA) = margin x turnover. It is the return that the business gets on its net operating capital.
| Measure | Q3 2025 | Q3 2026 |
| Sustainable profit margin | 26.79% | 26.63% |
| Asset turnover (annualized) | 1.30x | 0.98x |
| Sustainable RNOA (annualized) | 34.84% | 26.00% |
| Period-end NOA | $332.6B | $562.8B |
The margin moved just a little. Turnover was down 25 per cent. A symmetric arithmetic bridge attributes nearly 98% of the RNOA decline to turnover. This separates the ratio effects; it does not establish their economic cause.
At the $278.99 reference price, unlevered P/E for the last twelve months (LTM) through Q3 2026 is 14.24x on the workbook’s reported/reformulated basis and 25.39x on sustainable income. Unlevered P/E divides enterprise value by matching operating income. Equity P/B is 5.20x; unlevered P/B, enterprise value divided by NOA, is 5.92x. P/B compares value with book capital; these are valuation multiples, not return forecasts.
In other words, the revenues increased by 24.65% in 1 year while period-end NOA increased by 69.22%. Alphabet is still very profitable on each sale. More operating capital is tied up per dollar of sales.
The table compares Q3 2025 with Q3 2026; the chart shows sustainable profit margin, asset turnover and RNOA from Q1 2025 to Q3 2026.
How Much Can Google Cloud Contribute by 2030?
Google Cloud must turn contracted demand into revenue. Cloud has an order book, but contracted revenue is recognized as services or products are delivered, rather than when contracts are signed.
The figures are staggering. Cloud’s operating margin increased from 23.7% to 36.2% over the period of one year. Cloud backlog, or contracted revenue not yet recognized, is now $561 billion. It includes amounts already billed in advance and amounts still to be billed. But the catch is that just over 55% of Alphabet’s total $567.7 billion backlog is expected to be recognized as revenue within 24 months, and that assumes that Alphabet can get enough capacity up and running in time.
But that’s all in the timing. Investment can precede revenue recognition. Turnover improves only if revenue grows faster than the model’s net operating asset base; backlog conversion alone does not guarantee that. Delays can postpone revenue and weaken the return on invested capital.
Can Search Keep Funding the Investment?
Search is a major cash source for the build-out. It is still growing, though at a slower pace, and AI monetization is part of the reason.
Search & other revenue grew 12% in Q3, to $63.35 billion. But Google reported that search query growth is at a five-year high. So what’s going on with the revenue slowdown? Alphabet reports both measures.
Consider foot traffic instead of sales. Google’s business chief noted that the lower monetization in its new AI answer format affected its growth, as it saw strong growth in the AI Mode queries. Monetization simply refers to the monetary value of each search. Foreign-exchange effects were the single largest reason for the slowdown from Q2. Alphabet explained this in its earnings call.
For the 2030 question, the answer is as simple as it is: Can AI search generate the same revenue as traditional search? Stronger AI monetization would help Search fund the build-out. If monetization disappoints, the cash shortfall could grow.
What Must Improve in Capital Spending and Asset Efficiency?
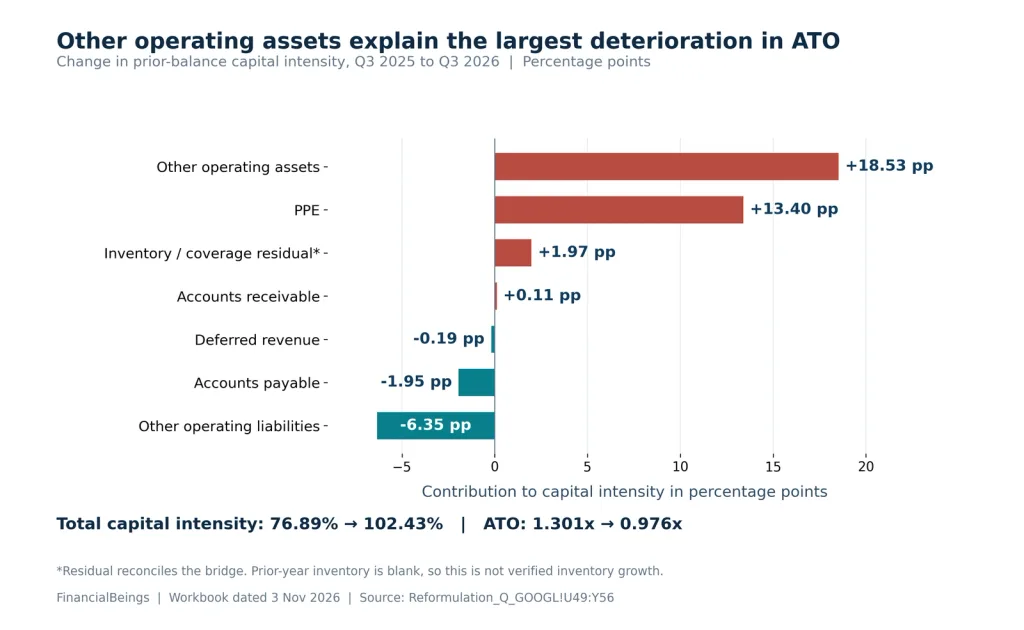
Alphabet is looking for more revenue for what it has already created. Using prior-quarter NOA divided by annualized quarterly sales, capital intensity rose from about $0.77 per dollar of sales a year ago to $1.02.
There are two factors that account for the majority of the increase. “Other operating assets”, which include investments, prepaid costs and so on, contributed 18.5 percentage points. The points for property and equipment (data centers and servers) increased by 13.4. PPE remains the largest positive capital requirement, at 63.42% of annualized sales, while other operating assets cause the largest deterioration. Operating liabilities partly offset the increase.
The NOA driver chart displays the rank of each Alphabet NOA driver based on their impact on capital intensity from Q3 2025 to Q3 2026.
Caution: Long-term investments in that little catch-all have swelled from approximately $64 billion to $135 billion, showing that the model’s asset base includes more than servers. And nothing here shows equipment idle. The priorities are earning more revenue from deployed capacity, pacing capex against demand and returns, and reviewing the classification of long-term investments in other operating assets.
However, if either PPE intensity or other operating asset intensity fell by 5 percentage points, with sales and profit margin unchanged, the turnover would increase to 1.03x while returns would come in at 27.33%. However, if both did, returns would be 28.81%. It is an arithmetic calculation and not a prediction.
There are two other things that are important. Near-term spending remains high: Alphabet maintained its 2026 capex estimate of $195 billion to $205 billion and expects capex to increase significantly in 2027. Additional shares can dilute owners; EPS depends on how earnings growth compares with share-count growth. In Q3, Alphabet issued 36 million new shares for about $12.4 billion, with no share repurchases.
Alphabet also disclosed roughly $1.08 trillion in contractual maximums across material purchases, leases not yet commenced and future equity funding. These span different periods and conditions; they are not all immediate cash spending.
What Could Antitrust and Waymo Change?
The legal ferocity seems less now than it did a year ago, but it hasn’t abated. In the ad-tech situation, Google will have to relax some of its rules regarding its ad services and to have a court-appointed monitor and technical committee for six years. The district court did not order the breakup the government sought. Both parties are appealing in the search case. Google’s multibillion-dollar payments to Apple support default search placement, and the government would like to limit those deals. Sources: PYMNTS; Reuters.
Self-driving taxi company Waymo, a part of Alphabet, receives no separate upside premium in these valuation cases. Its existing results remain inside Alphabet’s consolidated figures. Additional success would be a separate possibility, rather than a quantified forecast here. Investors weighing Alphabet against another mega-cap can see how the two compare in our Apple vs Google stock analysis.
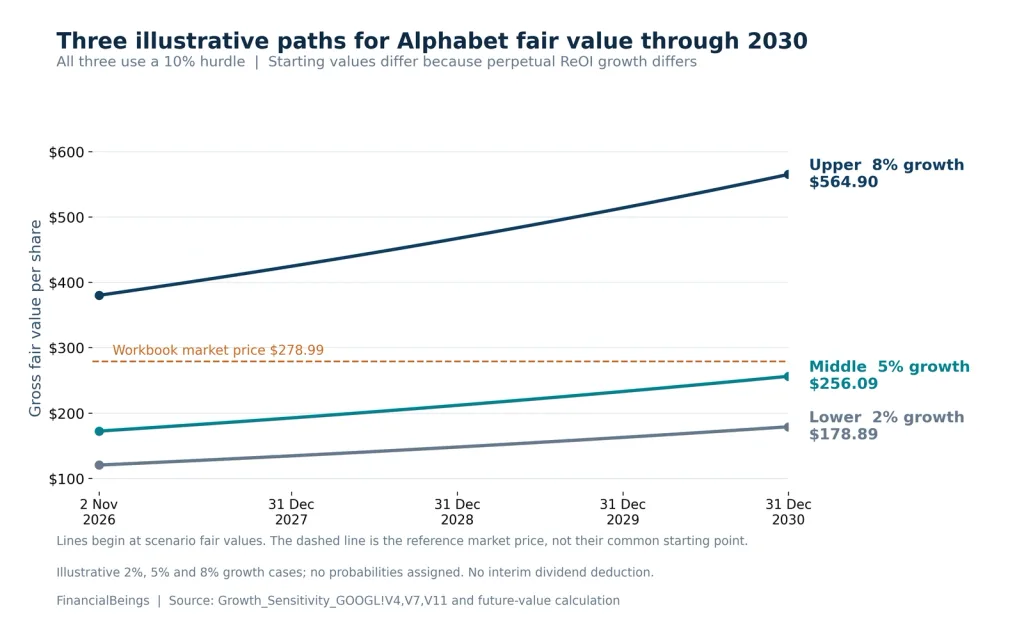
Alphabet Stock Forecast 2030: Three Valuation Scenarios
At a 10% required return, our three cases land at $178.89, $256.09 and $564.90 by the end of 2030. The high case is the only one that is significantly above the $278.99 reference price.
In our approach, we charge the business for the money tied up in it, producing what we call “residual operating income”. The business is valued at each growth rate and then the value is increased at the “hurdle rate” to 31 December 2030.
The hurdle rate is the model’s required operating return. We use present fair value × (1 + matching hurdle rate)^4.161533, covering 2 November 2026 to 31 December 2030. Perpetual ReOI growth is not EPS growth. The same method, applied to today’s price, is explained in our Alphabet intrinsic value guide.
| Case | Growth in residual profit | Hurdle | Present fair value | Value end-2030 | Yearly return from $278.99 |
| Lower | 2% | 10% | $120.32 | $178.89 | −10.13% |
| Middle | 5% | 10% | $172.24 | $256.09 | −2.04% |
| Upper | 8% | 10% | $379.94 | $564.90 | +18.47% |
Alphabet Stock Price Prediction 2030 Based on Three Growth Scenarios with 10% Hurdle Rate
One trap: a 10% hurdle doesn’t mean you earn 10% a year. We increase our estimate of value by the hurdle. Your annualized price return depends on the price paid relative to the modeled end value. At a 10% hurdle, the $278.99 reference price implies that residual profit would need to increase by approximately 7.18% per annum for perpetuity. That’s a tough call.
Sensitivity of the Alphabet stock forecast 2030: Hurdle rates 8% to 10% and ReOI growth 2% to 8%
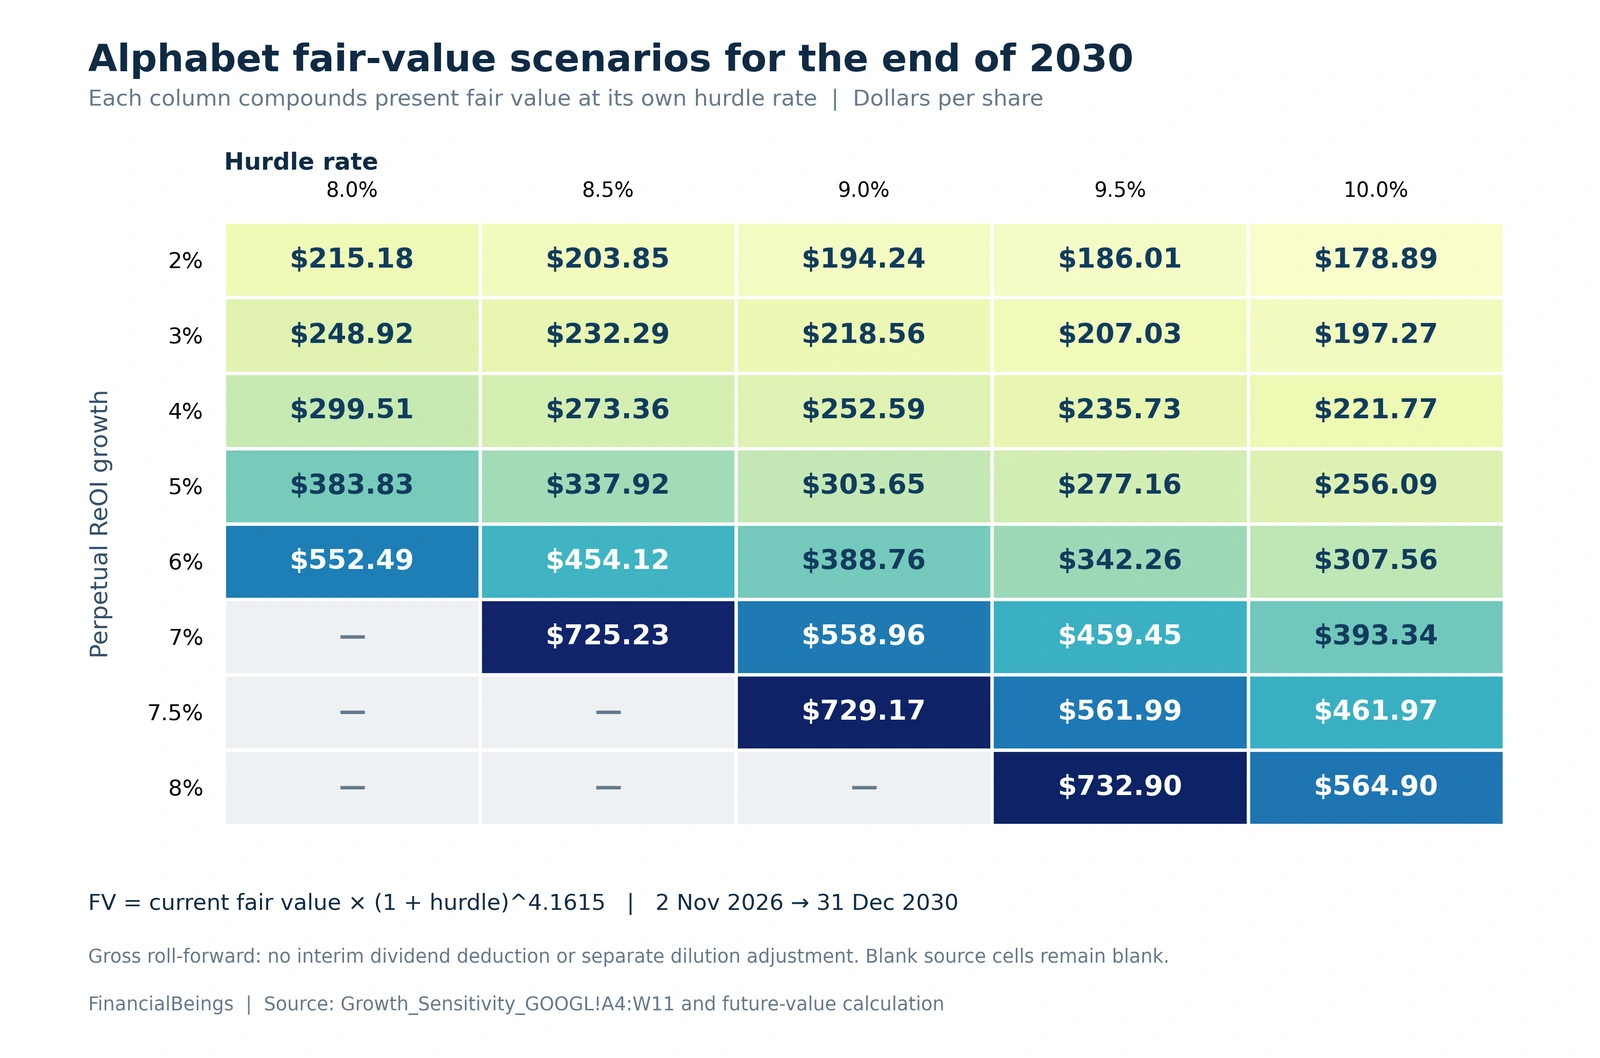
What Would Support $500, a Double or $700?
| Target | Yearly return needed | Illustrative grid combinations |
| $500 | 15.05% | Examples above $500: 7% growth / 9% hurdle = $558.96; 8% / 10% = $564.90 |
| $557.98 (a double) | 18.12% | Examples: 7% / 9% = $558.96; 7.5% / 9.5% = $561.99; 8% / 10% = $564.90 |
| $700 | 24.74% | Above $700: 7% / 8.5% = $725.23; 7.5% / 9% = $729.17; 8% / 9.5% = $732.90 |
None of these is a promise.
The Four Numbers That Could Change This Forecast
Investors can monitor four indicators:
- Capex: Is capex growth slowing relative to sales growth?
- Cloud backlog: is contracted demand converting into recognized revenue?
- Search revenue: do AI searches begin to generate revenue like traditional searches?
- Share count – is it decreasing or are new shares diluting owners?
As long as margins are strong, a turnover recovery would support the operating performance needed for the high case. The model assigns no probabilities.
Alphabet Stock Forecast 2030: FAQ
What is the Alphabet stock forecast for 2030?
At a 10% hurdle, our range is $178.89 to $564.90 per share by 31 December 2030, from a $278.99 start. It assumes 2% to 8% perpetual ReOI growth, with no interim dividend deduction or separate future dilution adjustment. These are scenarios with no assigned probabilities.
Can GOOGL reach $500?
It is possible within the grid, but requires demanding assumptions. For example, 8% perpetual ReOI growth at a 10% hurdle gives $564.90 in our GOOGL stock forecast 2030 grid. Reaching $500 from $278.99 requires about 15.05% annualized price growth to the end of 2030.
Could Alphabet double by 2030?
A double from $278.99 is $557.98. It is only present in high-growth cells, e.g., 8% growth with a 10% hurdle. Doubling by the end of 2030 requires about 18.12% annualized price growth and strong Cloud and Search performance.
Where could Alphabet be in five years?
Five years from November 2026 reaches late 2031, which is beyond the end date of our model. Our nearest answer is the 2030 range of $178.89 to $564.90.
Is the forecast different for GOOGL and GOOG?
No, the same business is owned by both classes. The GOOGL price may be slightly different from the GOOG price, as the former is a voting share while the latter is not.
The Bottom Line
Alphabet’s investment program will be tested by its operating results. The Alphabet Stock Forecast 2030 boils down to one thing: Will the company be able to convert its larger operating asset base into sales quickly enough? The margin is fine. The demand is real. The problem is that NOA has grown faster than revenue.Meta is making a similar AI spending bet, which we break down in our Meta intrinsic value 2026 article.