
The Nvidia vs AMD stock comparison in 2026 starts with two prices and a question about what investors are paying for.
Sara has a small bakery. She opened her investing app on 30 September 2026. AMD’s stock price was quoted at $602.79 per share. One Nvidia share was $230.95.
AMD was up about 181.5% since 31 December 2025. Nvidia was up approximately 23.8%, excluding dividends. Sara felt she might already be late to AMD’s rally.
Then she saw the profits. In its latest quarter, Nvidia earned $59.7 billion. AMD earned $2.3 billion. The company with the smaller price gain was making about 26 times the money.
In the Financial Beings model, about 78% of Nvidia’s share price and 96% of AMD’s sit above their fiscal-year no-growth values. The no-growth portions are approximately 22% and 4%, respectively. Both valuations depend heavily on future growth, with AMD carrying the larger growth premium.
Key Takeaways
- AMD had $11.5 billion in quarterly revenue, while Nvidia had $96.2 billion.
- From 31 December 2025 to 30 September 2026, Nvidia gained approximately 23.8% and AMD 181.5%, excluding dividends.
- The fiscal-year growth premiums were approximately 78% of Nvidia’s price and 96% of AMD’s price.
- Nvidia’s modeled market capitalization was approximately 5.7 times AMD’s at the 30 September 2026 price snapshot.
Nvidia vs AMD at a Glance
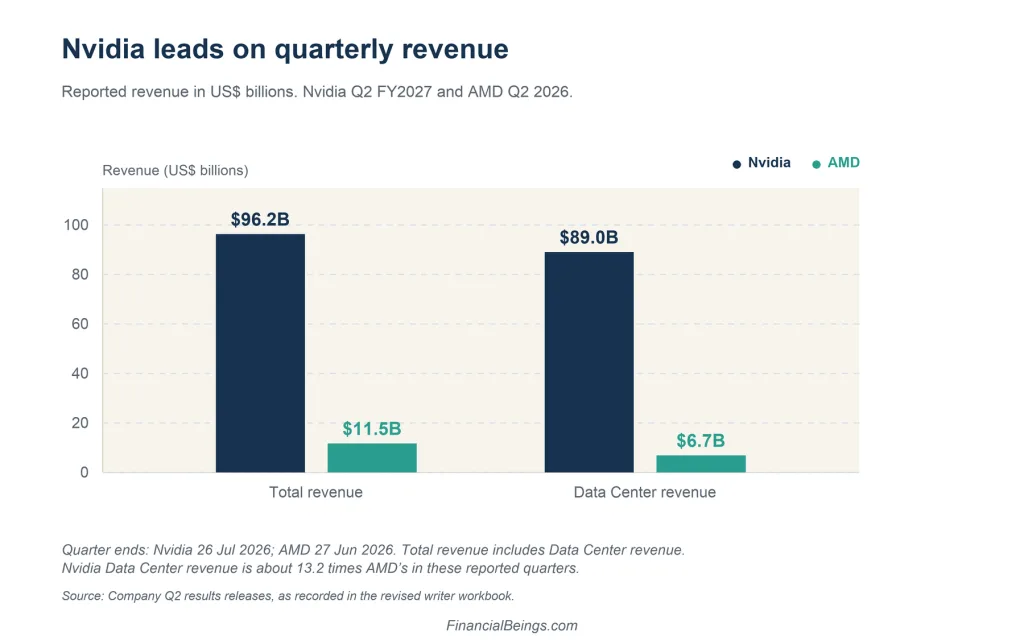
Nvidia is the bigger, more profitable of the two on the latest-quarter measures. During the quarter ended 26 July 2026, it generated revenue of $96.2 billion, approximately eight times AMD’s $11.5 billion for the quarter ended 27 June 2026. Nvidia’s net income was $59.7 billion, approximately 26 times AMD’s $2.3 billion. AMD is building from a lower base, and its valuation already anticipates substantial future growth.
In Sara’s parlance, Nvidia is the chain with stores in many towns. AMD is the smaller bakery with a growing queue outside.
Table 1: Nvidia vs AMD at a glance (latest quarter)
| Metric | Nvidia (Q2 FY2027) | AMD (Q2 2026) |
| Quarter ended | 26 July 2026 | 27 June 2026 |
| Revenue | $96.2B (+106% YoY) | $11.5B (+50% YoY) |
| Data Center revenue | $89.0B (+117%) | $6.7B (+107%) |
| GAAP gross margin | 75.0% | 54% |
| GAAP net income | $59.7B | $2.3B |
| GAAP diluted EPS | $2.46 | $1.38 |
| Free cash flow (first six months) | $69.9B | $4.1B |
| Next-quarter revenue guidance | $108.0B ±2% | About $13.0B ±$0.3B |
Sources: Nvidia Q2 FY2027 results and AMD Q2 2026 results. Quarter ends differ; free cash flow covers the first six months and uses company-defined non-GAAP measures.
Gross margin is the share of sales left after the costs of the products sold. Free cash flow is a company-defined non-GAAP measure of cash generated after capital spending and related adjustments; the table uses each company’s reported definition.
The quarter ends differ because Nvidia’s fiscal year ends in late January. Its Q2 FY2027 ended on 26 July 2026; AMD’s Q2 2026 ended on 27 June 2026.
Nvidia vs AMD Stock Performance in 2026
AMD had the larger price gain: approximately 181.5%, compared with Nvidia’s 23.8%, between the recorded 31 December 2025 prices and the selected 30 September 2026 workbook quotes. These price changes exclude dividends, which are cash payments to shareholders.
Table 2: Price comparison, 2026
| Measure | Nvidia | AMD |
| Recorded price on 31 Dec 2025 | $186.50 | $214.16 |
| Model price on 30 Sep 2026 | $230.95 | $602.79 |
| Year-to-date price change, excluding dividends | 23.8% | 181.5% |
| Modeled market value using fiscal-year share counts | $5.57T | $0.983T |
Source: Financial Beings valuation workbook, selected 30 September 2026 quotes and recorded 31 December 2025 baseline. Market capitalization uses fiscal-year model share counts; price changes exclude dividends.
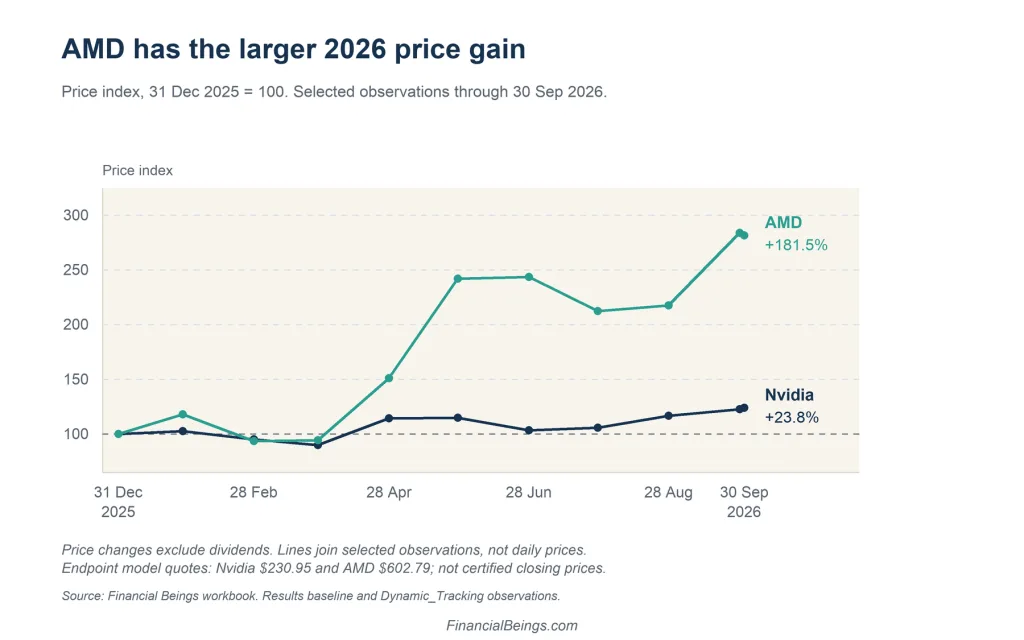
These prices are recorded snapshots, not certified closing prices.
AMD’s price had almost tripled in nine months, which made Sara feel behind. A price increase shows what buyers were willing to pay; it does not establish whether the business can justify that valuation.
Why AMD Has a Higher Share Price Than Nvidia
AMD’s higher price per share does not necessarily make it the more valuable company as it has fewer shares.
Consider a company as a cake divided into slices, each representing a share. The model uses approximately 24.1 billion shares for Nvidia and 1.63 billion for AMD. Market capitalization is the price per share multiplied by the share count.
At the 30 September 2026 quotes, those model share counts give Nvidia a market capitalization of approximately $5.57 trillion and AMD approximately $0.983 trillion. These fiscal-year model counts differ from the latest diluted share counts. The same point applies when comparing Tesla and Nvidia.
AMD Growth and AI Customer Commitments
AMD’s Data Center revenue jumped 107% to $6.7 billion in the quarter ended 27 June 2026. Its customer announcements help explain expectations for future sales, although these announcements alone do not establish what caused the stock-price appreciation.
Data Center Growth
AMD’s Data Center segment includes server processors, AI accelerators and related products. It generated $6.72 billion that quarter, approximately 58% of total revenue and 107% more than a year earlier. The segment is broader than AI GPU sales alone. AMD said it expected Data Center sales to accelerate in the second half of 2026.
AI Customer Commitments
Table 3: AMD’s announced AI deployments
| Customer | What was announced | Announced timing | Source |
| OpenAI | Agreement for 6 GW across multiple GPU generations | First 1 GW beginning in the second half of 2026 | AMD 8-K, 6 Oct 2025 |
| Oracle | Initial deployment of 50,000 MI450 Series GPUs | Start in calendar Q3 2026; expansion in 2027 and beyond | Oracle announcement, 14 Oct 2025 |
| Anthropic | Up to 2 GW of MI450 Series GPUs in Helios racks | First 1 GW in the first half of 2027 | AMD release, 22 Jul 2026 |
| Microsoft | Expanded deployment of Helios racks on Azure | Not dated | AMD Q2 2026 release |
A GPU is a processor used for parallel computations, including AI workloads. A gigawatt (GW) is a unit of electrical power; here it describes the scale of computing infrastructure covered by the announcements.
These are announced commitments and deployment plans. OpenAI’s initial 1 GW includes a binding purchase commitment, and AMD has reported Helios deployment activity. A commitment or installation schedule alone does not establish completed delivery or recognized revenue.
Sara knows the distinction from her shop. A large wedding order is promising when it is booked. Revenue is recognized when the relevant delivery obligations are met and control transfers to the customer. Collecting payment is a separate cash-flow event.
Revenue-recognition basis: FASB implementation Q&A.
Nvidia vs AMD Revenue Margins and Returns Compared
Nvidia leads on the size and profitability measures shown here. It also has a much higher sustainable operating return in the model, although the two companies’ asset bases contain different acquisition and investment balances.
Revenue and Margins
Nvidia reported quarterly revenue of $96.2 billion and a GAAP gross margin of 75.0%, compared with AMD’s $11.5 billion and 54%. First-six-month free cash flow was $69.9 billion for Nvidia and $4.1 billion for AMD.
Table 4: Balance sheet and cash
| Item | Nvidia | AMD |
| Cash and marketable debt securities or short-term investments | $56.6B | $13.1B |
| Equity investments, including long-term public equities | $98.90B | Not tabulated here |
| Total debt | $33.4B | $3.2B |
| Dividend | $0.25 per share per quarter | None |
Sources: company balance sheets at 26 July 2026 for Nvidia and 27 June 2026 for AMD; Nvidia investment disclosures. Debt is reported debt, distinct from model financing adjustments. Nvidia cash excludes equity securities.
Return on Net Operating Assets
Operating returns help Sara compare the profits earned from the resources tied up in each business.
Sara’s ovens, mixers and inventory, less operating liabilities such as amounts owed to suppliers, form her net operating asset base. Net operating assets separate the resources used in operations from financing and non-operating investments.
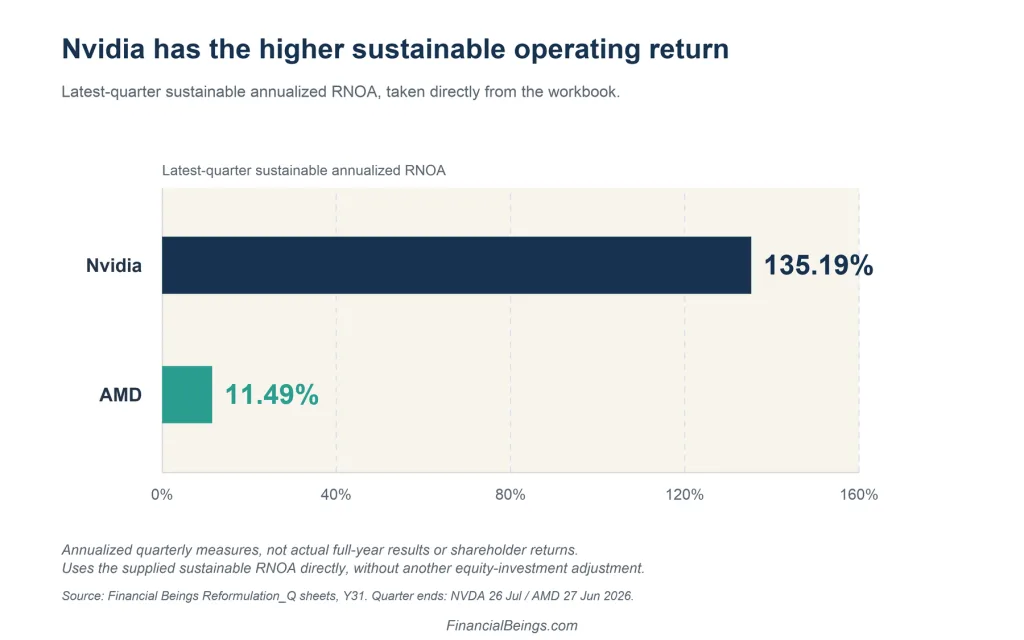
Return on net operating assets (RNOA) measures after-tax operating profit relative to the opening net operating asset base. Sustainable after-tax margin is operating profit as a percentage of sales. Asset turnover is sales divided by opening net operating assets. Multiplying the margin by annualized asset turnover gives the annualized latest-quarter RNOA shown below.
Table 5: Operating returns, latest quarter
| Measure | Nvidia | AMD |
| Sustainable after-tax margin, latest quarter | 55.6% | 13.9% |
| Asset turnover, latest quarter annualized | 2.430x | 0.825x |
| Sustainable RNOA, latest quarter annualized | 135.19% | 11.49% |
Source: Financial Beings quarterly reformulation sheets, quarter ends 26 July 2026 for Nvidia and 27 June 2026 for AMD. Sustainable annualized RNOA is taken directly from Y31, with no further equity-investment deduction. Margin and annualized turnover use the same opening net operating asset basis.
Nvidia’s latest quarter produced approximately $1.35 of sustainable operating profit per $1 of opening net operating assets when scaled to an annual rate. AMD’s figure was approximately 11.5 cents. These rates annualize a single quarter; they are not actual full-year results or shareholder returns.
Three notes keep this fair:
- Nvidia held $98.9 billion of equity investments, meaning stakes in other companies, at 26 July 2026. First-half gains on them were $23.7 billion before tax, about 16.8% of pretax income. The supplied sustainable RNOA already incorporates the model’s equity-investment exclusions and is used directly, without another deduction.
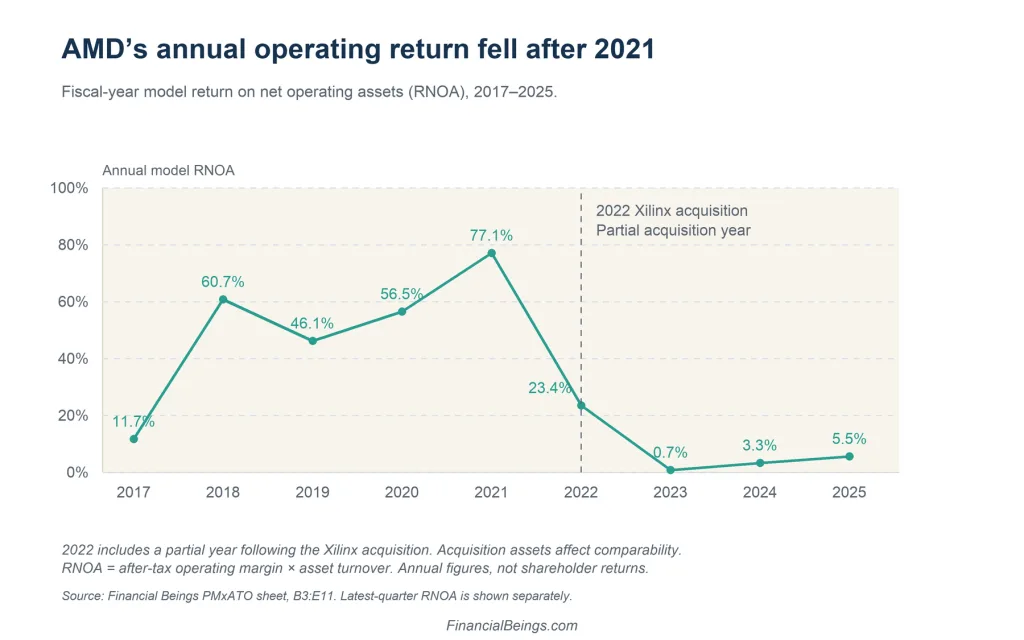
- AMD’s $41.1 billion of goodwill and acquisition-related intangibles represented approximately 70% of its $58.5 billion closing model net operating assets at 27 June 2026. These acquisition balances, including those from Xilinx in 2022, affect comparisons with Nvidia and AMD’s earlier years. AMD’s 2021 annual sustainable RNOA was about 77.1%.
- AMD’s sustainable trailing-twelve-month RNOA was 9.08%, below the model’s 10% hurdle. That measure covers four quarters and uses a different opening net operating asset base from the annualized latest-quarter figure of 11.49%.
What Each Share Price Assumes
At a 10% required operating return, the saved TTM valuation outputs imply annual operating-earnings growth of approximately 7.1% for Nvidia and 9.5% for AMD in perpetuity. The TTM valuation snapshots are dated 30 September 2026 for Nvidia and 27 September 2026 for AMD. These are simplified pricing assumptions, not forecasts for the coming year.
The required operating return is the 10% annual hurdle used to value the operating business. Implied growth is the constant annual growth rate in after-tax operating earnings consistent with that valuation. Separately, the fiscal-year growth premium measures the portion of the share price above its no-growth accounting value. Neither measure guarantees a shareholder return.
If a buyer values Sara’s bakery at $100 and the model’s no-growth value is $22, the remaining $78 is what the buyer is paying for expected future growth. The growth premium is that $78; it does not specify how the business will spend money.
Using the selected 30 September 2026 quotes, Nvidia’s fiscal-year growth premium was 78.3% of price and AMD’s was 96.1%. AMD’s FY2025 sustainable residual operating income was negative $2.46 billion. This economic profit subtracts a charge for capital tied up in operations and helps explain AMD’s low fiscal-year no-growth accounting value.
Table 6: What each share price assumes
| Measure and period | Nvidia | AMD |
| Implied yearly growth in operating earnings, forever (trailing twelve months basis) | 7.1% | 9.5% |
| Growth premium (last-fiscal-year no-growth anchor) | 78.3% | 96.1% |
| Zero-growth operating-earnings yield (sustainable, trailing twelve months) | 3.0% | 0.5% |
| P/E, last four quarters | 28.9x | 159.8x |
Source and price basis: TTM growth, yield and P/E are saved quarterly-sheet outputs using Nvidia’s 30 September 2026 and AMD’s 27 September 2026 snapshots; AMD’s TTM price basis is $630.63. The fiscal-year growth premiums use the selected 30 September quotes of $230.95 and $602.79. The rows therefore have different valuation bases.
At the separate TTM model snapshots, Nvidia’s sustainable operating-earnings yield is approximately 3.0% and AMD’s 0.5%. Both are below the model’s 10% operating hurdle. Each $100 of operating enterprise value is backed by approximately $3 of annual sustainable operating earnings for Nvidia and $0.50 for AMD. These are operating valuation ratios, not dividend yields or guaranteed shareholder returns.
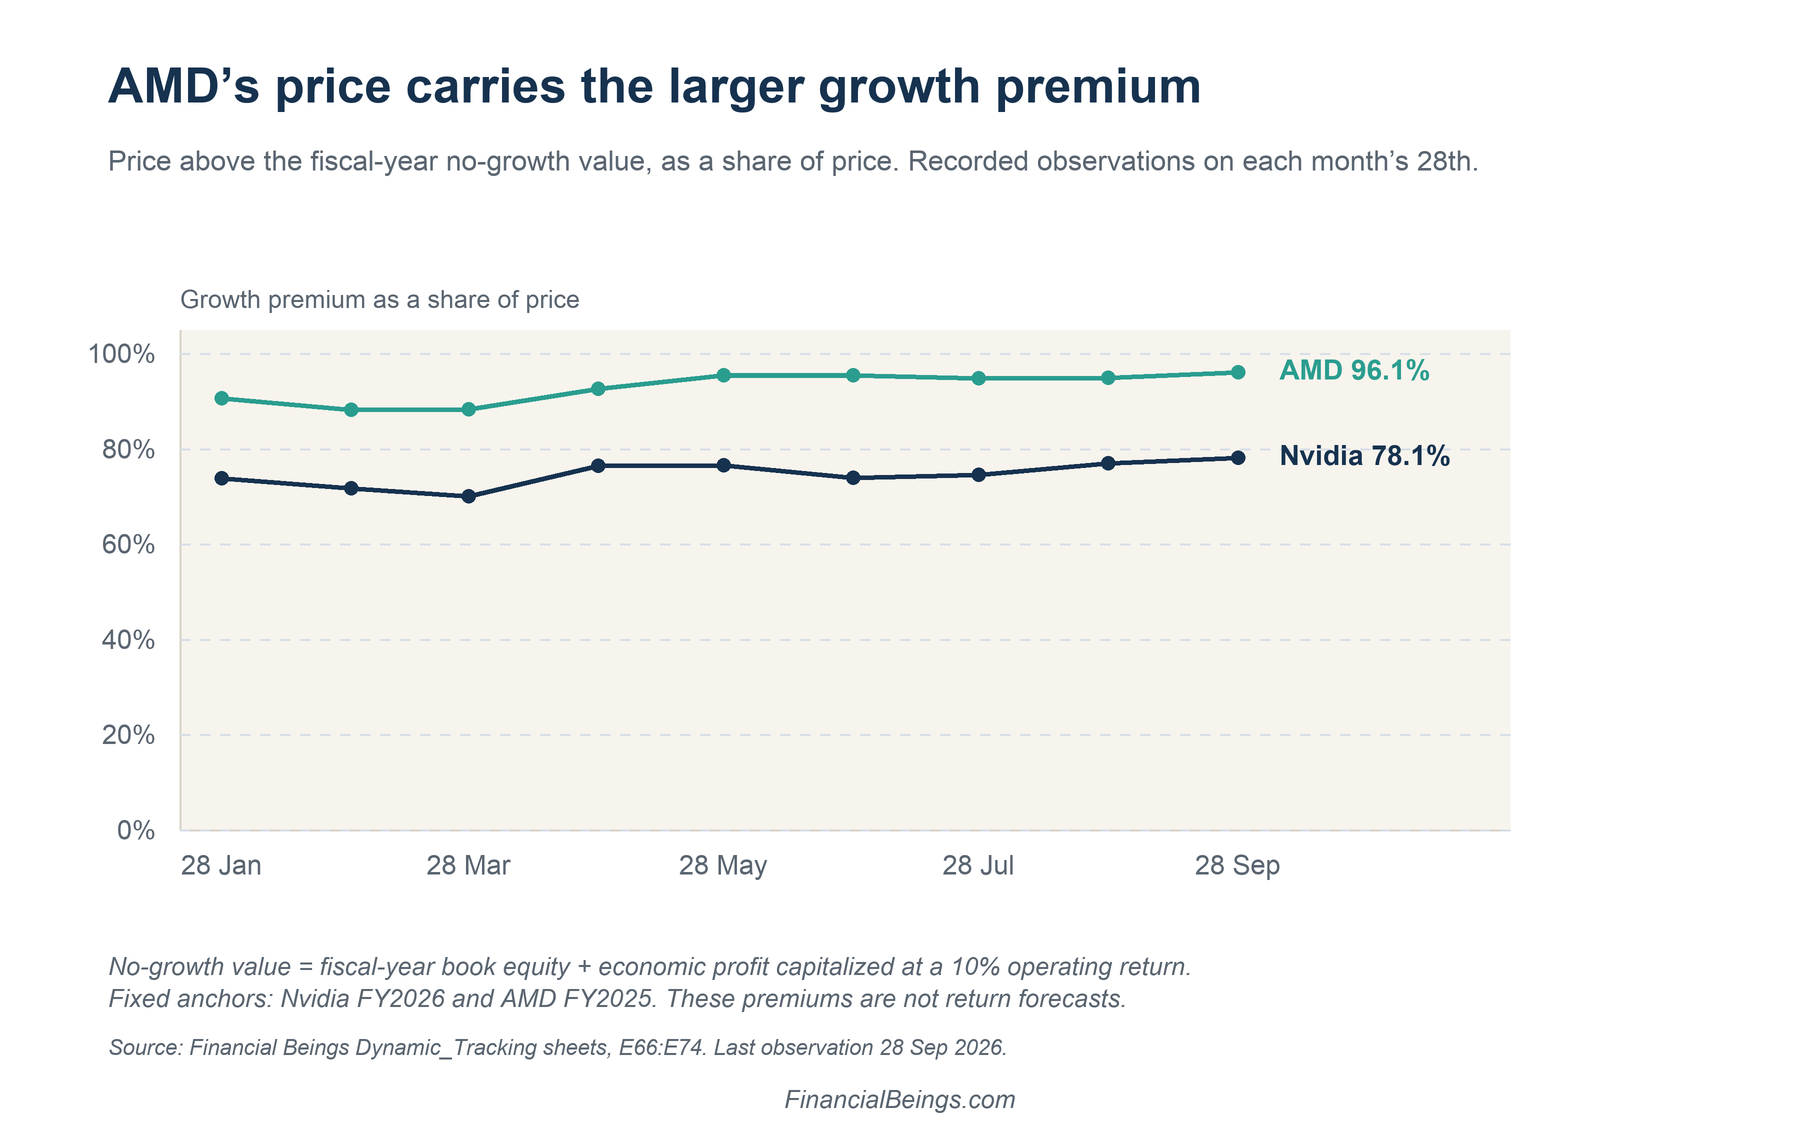
Chart basis: fiscal-year growth premiums from 28 January to 28 September 2026, ending at 78.1% for Nvidia and 96.1% for AMD. Its endpoint differs from the 30 September headline values.
AMD’s price depends more heavily on future growth under the fiscal-year model decomposition. Both companies carry substantial growth premiums. For another pairing, see our Meta vs Nvidia analysis.
Can AMD Beat Nvidia in AI Three Scenarios
Nvidia’s latest-quarter Data Center revenue was approximately 13 times AMD’s. Closing that gap depends on AMD executing its announced deployments and converting them into profitable sales. The commitments in Table 3 have initial deployment dates in 2026 and 2027.
These three scenarios describe possible business outcomes. None has an assigned probability or a stock-price target.
Table 7: Three scenarios
| Scenario | What happens |
| Bear | AI spending or margins weaken. Both valuations face risk if profits and growth fall short. AMD’s larger growth premium shows greater reliance on growth, not a guaranteed larger fall. |
| Base | Nvidia sustains stronger profitability. AMD improves its margins and asset turnover. |
| Bull | AMD’s deployments scale and its profitability improves. Nvidia also keeps growing. OpenAI warrant dilution is a separate risk for AMD holders. |
The next table asks how fast residual operating profit, after the model’s capital charge, would need to grow in perpetuity at a given RNOA to support the fixed grid price.
Table 8: Growth needed at different operating returns
| If RNOA is | AMD needs growth of | Nvidia needs growth of |
| 20% | 9.39% | 9.78% |
| 30% | 8.77% | 9.56% |
| 50% | 7.55% | 9.11% |
Source: Financial Beings annual RNOA grid, using AMD FY2025 and Nvidia FY2026 anchors, a 10% required operating return and fixed annual net operating assets and net debt. Prices are $602.38 for AMD and $231.11 for Nvidia. The rows assume perpetual growth in residual operating profit. They are conditional scenarios, use a different method and price basis from Table 6, and are not forecasts.
Risks for Both Stocks
Both prices can be hurt if profits and growth fall short.
Nvidia Risks
- Its guidance excludes Data Center compute revenue from China.
- Customer-designed chips and rival products could increase competitive pressure.
- Sustaining rapid growth from quarterly revenue of $96.2 billion is demanding.
- Investment gains and losses can add volatility to reported net income.
AMD Risks
- OpenAI holds a warrant to purchase up to 160 million AMD common shares at $0.01 per share. Vesting depends on GPU-purchase, share-price and other performance and commercial conditions. The final share-price milestone is $600; reaching $600 alone does not satisfy all vesting and exercise conditions. Full issuance would add approximately 9.8% to the pack’s 1.63 billion model share base, giving existing holders a smaller proportion of the enlarged share count.
Source: AMD OpenAI warrant filing.
- AMD’s valuation depends on growth expectations being justified by execution and profitability. Delays to MI450 deliveries could put that progress at risk.
- AMD has pledged to invest up to $5 billion in Anthropic.
Both also fail the model’s narrow test of steady economic profit. That is a statistical screen, not a sign of a failing business. For more on chip rivals, see AMD vs Broadcom.
Final Verdict
Sara closed her investing app without buying either stock. She had stopped asking which price had risen more and started asking what each business would have to achieve to justify its valuation.
Nvidia is stronger on the operating measures shown here. AMD’s valuation depends more heavily on future growth, and its customer commitments still need to translate into profitable delivery. Execution, profitability and potential dilution matter to that outcome. These comparisons do not establish which stock will deliver the higher realized return.
FAQs
Is AMD Worth More Than Nvidia
Using the 30 September 2026 quotes and fiscal-year model share counts, AMD’s market capitalization was approximately $0.983 trillion and Nvidia’s $5.57 trillion. A higher price per share does not imply a higher total company value; share count also matters.
Do Nvidia or AMD Pay a Dividend
Nvidia pays $0.25 per share each quarter, following the increase from $0.01 announced in May 2026. AMD does not pay a cash dividend.
Our data sources: Nvidia and AMD company results and SEC filings, and Financial Beings‘ analysis of those filings. The main price comparison and fiscal-year growth premiums use selected workbook quotes dated 30 September 2026. Table 6’s TTM valuation rows use Nvidia’s 30 September and AMD’s 27 September snapshots. The growth-premium chart ends on 28 September; Table 8 uses its separately stated annual-grid prices. Operating figures relate to the reporting periods shown. Data reviewed on 2 October 2026.
Disclaimer: This article is for informational purposes only and is not investment advice.
