
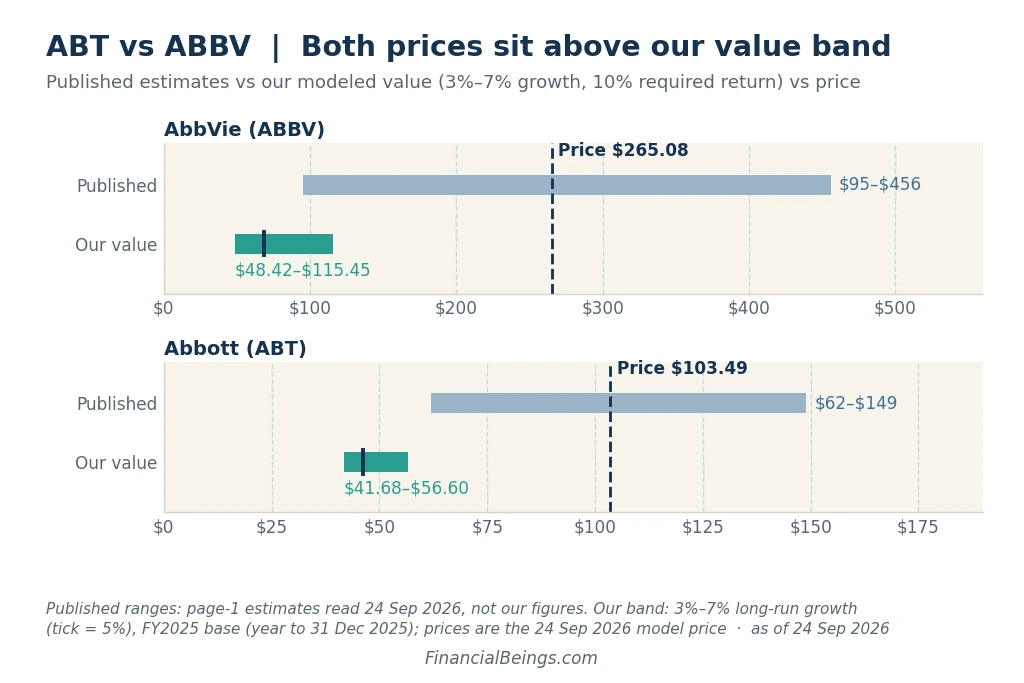
Search “AbbVie intrinsic value,” and you’ll find $95 on one page and $456 on another. You get anywhere from $62 to $149 when you search for “Abbott intrinsic value.” Same stock, same day – wildly different answers.
The two companies, Abbott and AbbVie, were one company until 2013. At present, one stock has increased in value by 16 percent for the year, and the other has decreased in value by 17 percent for the year.
That’s where the story starts. The Abbott vs AbbVie intrinsic value 2026 question isn’t really about which is the “good” or “bad” company. It’s about what each price is saying if you listen to it.
The Quick Answer
Intrinsic value approximates the value of a business, based on the value of the earnings that the business produces, rather than on the value of the market today. We refer to ours as a “modeled value.” It isn’t a target price.
| As of 24 Sep, 2026 | Abbott (ABT) | AbbVie (ABBV) |
| Share price | $103.49 | $265.08 |
| Modeled value at 5% growth | $46.16 | $68.53 |
| Range for 3%–7% growth | $41.68–$56.60 | $48.42–$115.45 |
| Growth the price implies | 8.93% a year | 8.68% a year |
| Move this year / 12 month | −17% / −23% | +16% / +20% |
The short version: Both prices demand roughly 9% excess profit increases per annum without an end date! This is more than double the economy’s long-run growth rate of approximately 4%. If you’re new to the idea, here’s how to find the growth rate a stock price implies.
Why the Estimates Run From $62 to $456
Various websites have distinct tools. Some project cash flow. Others plug earnings into a formula. Others assume faster growth year after year. They each ask a slightly different question, and the responses spread out. This is why readers are even more confused when searching for Abbott vs AbbVie intrinsic value 2026.
A second trap is there. On a stock screener, “profit” may not be the profit that the business makes.
| Last four quarters to 30 Jun 2026 | Abbott | AbbVie |
| Reported net income | ~$5.4B | $6.27B |
| After-tax operating income | $5.20B | $13.94B |
| Price ÷ reported earnings | ~33× | 74.7× |
It is the income of the core business without accounting for interest and one-time accounting items. The wide gap between the two numbers is due to interest on debt and the reestimation of earn-out payments for drug Skyrizi (earn-outs are monies owed to a seller if a product meets targets). Per its Q2 2026 10-Q, AbbVie reports these below operating income. So, a screener suggests that AbbVie is trading at about double the valuation of its operations (74.7× on reported earnings versus 38.3× on business value ÷ operating income).
Much like AbbVie is doing, we leave the revaluation of its acquisition earn-outs below operating income; readers who value those payments as a cost of selling Skyrizi will come up with a lower value than we.
What Each Business Earns on Every $1 of Capital
Consider the operating capital of a company as its kitchen; the factories, equipment and inventory that the company needs to operate. That kitchen is required to pay out rent, which is a reasonable 10% return on investment that someone could demand in another investment.
There are two factors that determine the amount of money the kitchen makes. Profit margin is the number of cents that it retains for every $1 in sales. Capital turnover is the amount of sales per dollar of kitchen. When multiplied, they will yield the return on capital.
| FY2025 (year to 31 Dec 2025) | Abbott | AbbVie |
| Profit margin (after tax) | 15.5% | 20.9% |
| Capital turnover | 0.78× | 0.98× |
| Return on capital | 12.2% | 20.4% |
| Return, last four quarters to 30 Jun 2026 | 8.9% | 20.9% |
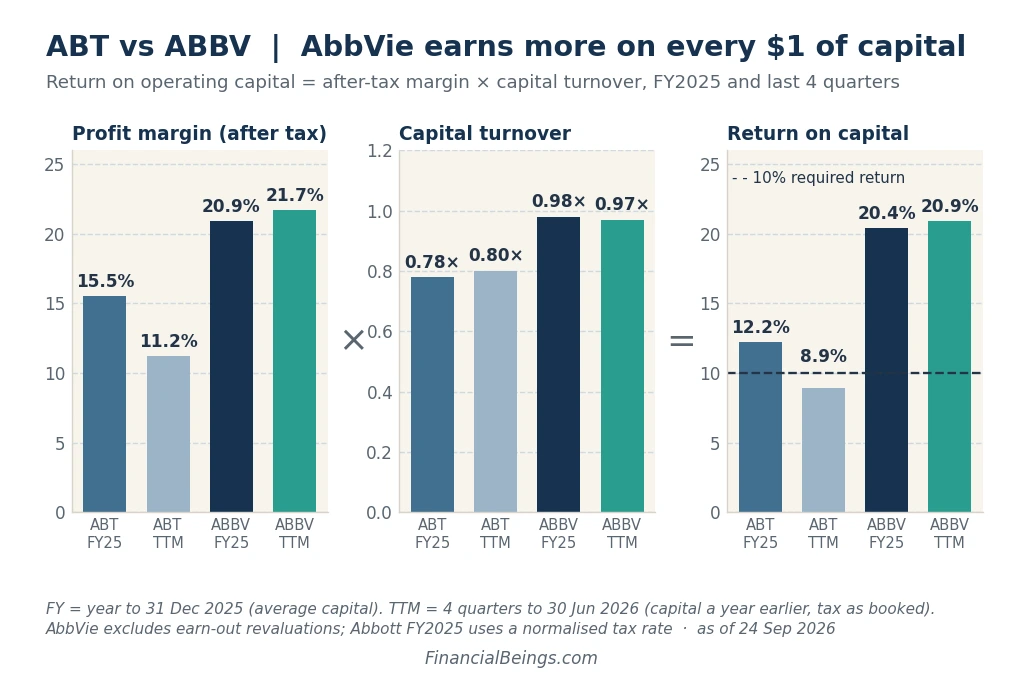
Abbott’s 10% rent was just cleared in 2025. (The tax rate for that year is a normalised rate of around 15%.) It then went ahead and closed the deal on Exact Sciences in March 2026. It has suddenly expanded its kitchen by about 39%. Over the past four quarters, the return has deteriorated to 8.9%, which is below the threshold.
AbbVie makes about 1.7 times as much per dollar. Its return stayed between 16% and 22% every year from 2020 to 2025.
There is one peculiarity that is worth knowing. AbbVie’s shareholder equity for 2025 ended at −$3.27B. That was because it has paid out more to its shareholders than it has reported in earnings. For AbbVie, price-to-book and return on equity do not apply, so we measure its operating capital instead. We used the same approach in our AbbVie vs Johnson & Johnson comparison, where the dividend payouts behind that negative equity are laid out side by side.
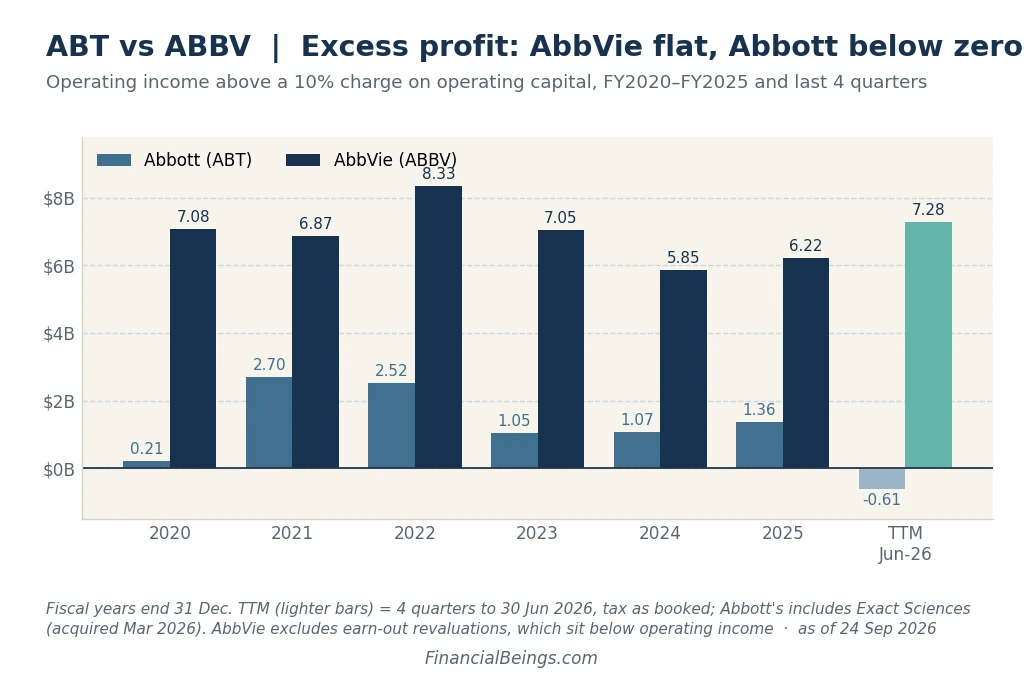
Excess profit is the profit remaining after a 10% rent is paid. AbbVie’s moved sideways between $5.9B and $8.3B from 2020 to 2025 (lowest in 2024, highest in 2022) and was $7.28B in the four quarters to June 2026. Abbott’s peaked at $2.70B in 2021, was $1.36B in 2025, and has now dipped to −$0.61B.
What the Market Is Paying For
Add the company’s net debt (debt less cash) to the current value of its stock to find out the value the market places on each business. That figure is the enterprise value, or the value of the entire operation.
| As of 24 Sep 2026 | Abbott | AbbVie |
| Enterprise value | $184.28B | $531.10B |
| Price paid per $1 of kitchen | 3.18× | 8.94× |
| Value if excess profit never grows | $38.17/share | $33.34/share |
| Share of price that is a growth bet | 63% | 87% |
Put simply: of every $100 you pay, $63 at Abbott and $87 at AbbVie is a bet on growth that hasn’t happened yet.
Now the growth ladder, at a 10% required return:
| Growth | Abbott value | % of price | AbbVie value | % of price |
| 3% (Conservative) | $41.68 | 40% | $48.42 | 18% |
| 5% (Balanced-Growth) | $46.16 | 45% | $68.53 | 26% |
| 7% (Upper) | $56.60 | 55% | $115.45 | 44% |
| Break-even | 8.93% | 100% | 8.68% | 100% |
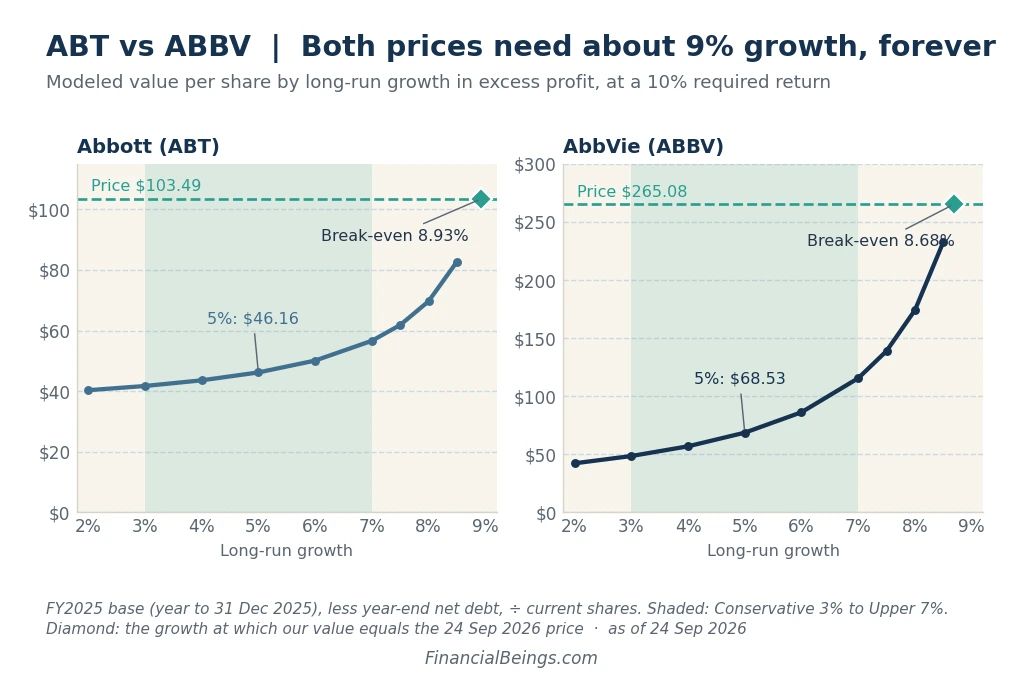
Look at the shapes. Abbott’s ladder is flat. Even at that 7% growth it only equals 55% of the price. The return must increase to close that gap; a growth alone will not suffice.
AbbVie’s ladder is rather steep. But as the growth you are banking on nears the 10% rent, marginal changes in growth have outsized effects on the value. That is the reason why the online estimate range is $95 to $456. That’s why we quote a range, rather than one number. We map out where that range could land by the end of the decade in our AbbVie stock forecast for 2030.
What would have to be the case then? If Abbott does not grow, it would need a 32% return on capital — twice its best year in 2021 of 16%. However, at a 20% return, its price requires just 5.4% growth. For AbbVie, with no growth, it would need approximately 89%. It would still require growth of 6.2% at a 40% return.
Abbott’s lever is return, AbbVie’s lever is growth.
What Could Make These Numbers Wrong
Before any verdict, the honest caveats. No Abbott vs AbbVie intrinsic value 2026 estimate is complete without them.
AbbVie’s edge is narrower than the headline. Remarkably, however, if you simply take the Skyrizi earn-out as a standard business expense, then the company’s excess profit over the last four quarters drops from approximately $7.3B to approximately $2B. Its return would be around 13%, which is about what Abbott earned in 2025.
Abbott’s numbers are flattered too. Abbott’s 2025 excess profit is approximately $0.6B, rather than $1.36B, with the tax actually paid. Our valuation base is for a time before the Exact Sciences deal.
Abbott’s recovery may not come. Abbott’s after-tax operating margin for its first two quarters with Exact Sciences was 8.7% and 8.3%, respectively. Through 2025, it ran around 12%–15%. Part of any rebound rests on its diabetes-care devices, a market it shares with Dexcom, Abbott’s rival in glucose monitoring.
The June 2026 quarter shows the split clearly:
| Quarter to 30 Jun 2026 | Abbott | AbbVie |
| Sales | $12.59B (+13%) | $16.99B (+10%) |
| After-tax operating income | $1.04B (−38%) | $5.63B (+36%) |
AbbVie’s quarter was the strongest in our record, but single quarters swing. The four-quarter figure is the steadier guide.
The Verdict: Four Lenses, Two Companies
On the business, AbbVie wins every lens; on the price, Abbott does. That’s the heart of the Abbott vs AbbVie intrinsic value 2026 debate.
| Lens | Abbott | AbbVie | Edge |
| Return on capital (FY2025) | 12.2% | 20.4% | AbbVie |
| Growth the price implies (24 Sep 2026) | 8.93% | 8.68% | Level |
| Implied growth vs own history | Normal range | Highest since 2019 | Abbott |
| Value at 5% growth, % of price | 45% | 26% | Abbott |
AbbVie is the stronger operating business. Higher margin, faster turnover, and a return above the 10% rate every year since 2020 (10 points above it in 2025).
Abbott’s price sits closer to what its business can support — on one condition. Its return has to recover after the Exact Sciences deal. It reached 16% in 2021.
Neither clears the 10% bar with a margin of safety. Both need about 9% growth, far into the future.
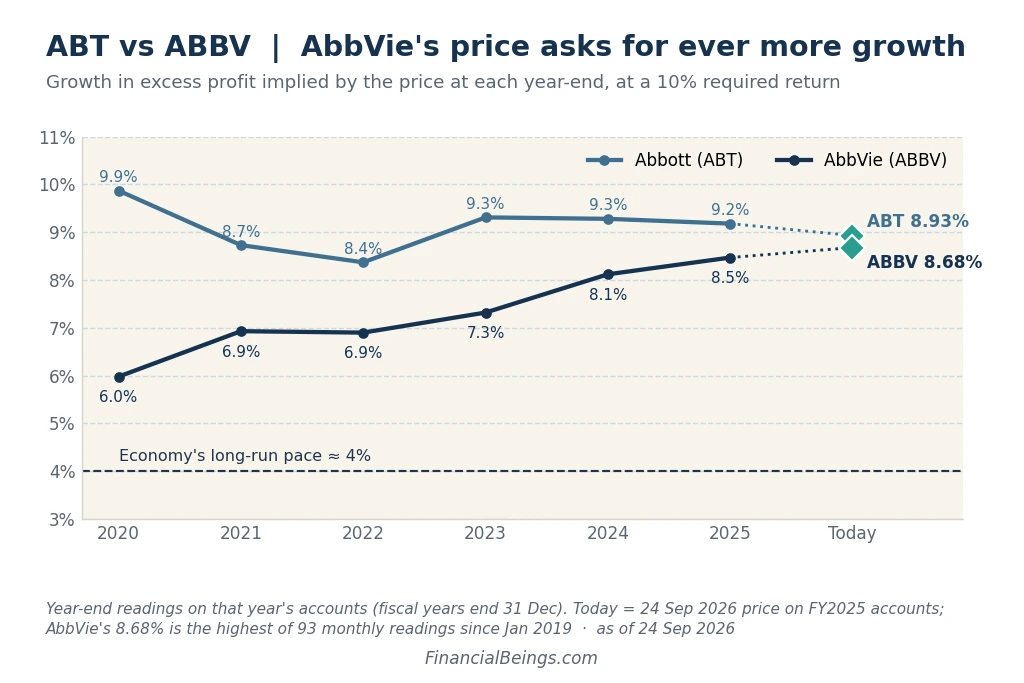
The two prices have an opposing mood. AbbVie’s implied growth has increased from 6.0% at the end of 2020 to 8.68% today, marking the highest level of the 93 monthly readings since 2019. Optimism is in the price. Abbott’s has maintained a steady range from 8.4% to 9.9% since 2020 and the price dropped 17% this year. Already hope has seeped out.
What to watch in the Q3 2026 reports:
For Abbott, it’s whether margins start to rise again above roughly 12%, and for AbbVie, it’s whether excess profit increases at a faster rate than 8.7% and its return remains above 20%.
Well, what does a reader do with this? There’s no tip here. When understanding Abbott vs AbbVie intrinsic value 2026, the reader obtains a clearer question to ask.
In our numbers, AbbVie is the higher quality company: on 2025 operating capital, AbbVie has a 20.4% return, compared with 12.2% for Abbott, and a margin that is wider and a turnover that is faster. At 24 September 2026 prices, both stocks ask for about 9% growth a year, far into the future.
AbbVie’s price asks for more than at any point in our record since 2019, while Abbott’s asks for around what it has at every year-end since 2020, following a 17% drop this year. Abbott’s gap closes primarily if it gets more profitable after the Exact Sciences deal; AbbVie’s does if it compounds its excess profit over decades. Both do not have a margin of safety on our 10% bar. This is not an investment recommendation. To see how both stack up against the wider sector, compare them with the largest healthcare companies on the same measures.
FAQs
What is AbbVie’s intrinsic value in 2026?
About $68.53/share at a 10% required return and 5% growth, in a $48.42–$115.45 range for 3%–7%. At $265.08, the price implies 8.7% growth a year. The range of published estimates is ~$95-$456.
What is Abbott’s intrinsic value in 2026?
About $46.16/share at a 10% required return and 5% growth, in a $41.68–$56.60 range for 3%–7%. At $103.49, the price implies 8.9% growth a year. Estimates published range from ~$62 to $149.
Is AbbVie stock overvalued?
The price implies 8.7% long-term earnings growth in excess operating income — the highest in our record since 2019 and about double the growth of the economy. RNOA is 20.4%; our value at 5% growth is 26% of price. Not investment advice.
Why does AbbVie have negative equity?
As of year-end 2025, the cash it has paid to shareholders is higher than its reported earnings, resulting in a negative book equity of −$3.27B. That renders price-to-book and ROE useless — so we value its operating capital instead. We used the same approach in our AbbVie vs Johnson & Johnson comparison, where the dividend payouts behind that negative equity are laid out side by side.
Why is Abbott’s stock down in 2026?
This year the price has decreased by 17%. The growth it assumes didn’t move much in our numbers (9.2% to 8.9%), and the Exact Sciences deal increased operating capital by 39%, and trailing RNOA fell to 8.9%, which is below the 10% line.
Abbott vs AbbVie — which is better value?
On our 10% bar both prices ask for ~9% growth. At 5% growth Abbott’s value covers 45% of its price, AbbVie’s 26%. Abbott needs its return to rise; AbbVie needs its excess profit to compound for decades. Not investment advice.
Sources
| Source | Publisher | Date | Used for |
|---|---|---|---|
| Abbott Reports Second-Quarter 2026 Results | Abbott | 16 Jul 2026 | Q2 2026 sales and operating results |
| Abbott Q2 2026 Earnings Release (Exhibit 99.1) | SEC EDGAR | 16 Jul 2026 | Quarterly financial statements |
| Abbott Completes Acquisition of Exact Sciences | Abbott | 23 Mar 2026 | Exact Sciences deal completion |
| AbbVie Reports Second-Quarter 2026 Financial Results | AbbVie | 31 Jul 2026 | Q2 2026 revenue and operating results |
| AbbVie Q2 2026 Earnings Release (Exhibit 99.1) | SEC EDGAR | 31 Jul 2026 | Quarterly financial statements |
| AbbVie Q4 and Full-Year 2025 Results | SEC EDGAR | 4 Feb 2026 | FY2025 financials |
| Abbott 10-K and 10-Q Filings | SEC EDGAR | FY2020–Q2 2026 | Historical operating capital and returns |
| AbbVie 10-K and 10-Q Filings | SEC EDGAR | FY2020–Q2 2026 | Historical operating capital, returns and earn-out treatment |
Share prices and year-to-date moves as of 24 Sep 2026. Modeled values are FinancialBeings estimates, not price targets. This is not an investment recommendation.
