

Published 2030 forecasts for Energy Transfer LP (NYSE: ET), a Delaware master limited partnership, run from $10.27 to $45.35 — a 4.4x spread on the same partnership on the same day. ET publishes no guidance beyond 2026, so every one of those numbers is an extrapolation. The useful question is not the price but the yield it implies. If ET sustains its realised distribution pace the annualised payout would reach about $1.54 by 2030, making a $36 unit a 4.3% yield against 6.35% today. Our range is $17 to $29 — and it counts the distributions every competing forecast omits. To compare this midstream partnership with oil producers, see our Exxon, Chevron and ConocoPhillips analysis.
On Tuesday night, Maria was browsing stock forecasts when she came across the number. One website quoted $10.27 for Energy Transfer by 2030. Another said $45.35. Same company. Same year. A 4.4-times difference.
She sat up. No mistake in the rounding. It’s not two analysts differing by a few dollars. It’s an example of two individuals looking at the same business and reaching entirely different conclusions.
Maria isn’t a finance person. She was involved in logistics; she had some index funds, and she’d heard of Energy Transfer being one of those “boring pipeline stocks that pays you well to hold it.” similar to picks in our best dividend stocks roundup. It sounded steady. Boring, even – the stuff that people talk about when they talk of utility bills and bank accounts.
The reason that the difference between the two forecasts seemed so shocking to her was that reputation. Stocks that are boring are not supposed to carry such a lot of disagreement with them.
So, she began to dig. How will this thing be in 2030? She was opening a couple of additional tabs, hoping that one would help her out. Rather, she found out it was all a mess of chaos disguised in certainty, graph after graph, with the dollar signs written in bold, self-assuring colors and neat little arrows that directed upwards in the hope of accuracy that, when she looked more closely, no one had earned. No one said how they acquired their number. No one was demonstrating their work.
That is the reason why you will find all the ET Stock Forecast 2030 headlines on the internet. You will see, when you realize why the numbers are flying that way, which number actually counts, and that is not the price.
What Is Energy Transfer, Anyway?
Energy Transfer is a business that transports oil and natural gas all over the country with a vast pipeline system. Does not drill for oil. Does not pump gas. It’s more a toll road company than anything else: it charges a fee for every energy unit that gets through its pipes, no matter what oil prices are on any given day. if you’re looking for names with direct exposure to oil prices instead, our good oil stocks to buy now roundup covers that side of the sector.
There’s a quirk here that’s important: In the regular sense, Energy Transfer is not a “company.” It is a master limited partnership, that is, you don’t own shares, you own “units” (the partnership equivalent of shares), and you don’t receive a dividend, but rather a “distribution.” Same idea, different paperwork, but as we will see, the paperwork is very important to your tax return.
The current price of the stock (the unit) is approximately $21.42, at the 18 August 2026 close. It pays out $1.36 a year, which works out to a 6.35% yield. That’s the percent of your investment that you’ll receive on an annual basis, simply for holding on to it. It’s an unusually high yield.
That’s why so many analysts are trying to offer all sorts of numbers when predicting this stock’s trajectory going forward. This isn’t the first time the numbers on this stock have swung wildly — our ET Stock Forecast 2025 ran into the same scattered guesswork a year earlier, and little has changed except the year on the headline.
The Real Story Behind the ET Stock Forecast 2030 Chaos
The point is that no one can tell you this at the outset: Energy Transfer has not provided any information regarding its business after 2026. Nothing. No official targets for 2027, 2028, 2029, or 2030. It has held no investor day.
All those ET Stock Forecast 2030 figures floating around the web — the $10.27, the $45.35, and all the rest of it — are all just guesses by someone in disguise. Part of those guesses are constructed upon real analysis. The rest are no better than a computer drawing a straight line through the previous prices and extrapolating it into the future, the financial parallel of forecasting the weather tomorrow by looking at yesterday.
One of them, at least, publicly acknowledges its figure of 2030 as a mere extrapolation (a linear one) – and even its own figure moved from $37.18 to $45.35 in a morning, simply because a scoring tweak had been made internally. It is not a prediction. That is a coin flip in a suit.
The Question That Actually Matters: What Does the Price Have to Yield?
It is at this point that the story of Maria becomes interesting.
Rather than asking, “What will the price be?”, reverse the question: what yield does that price suppose? Since a distribution-paying investment such as this has a simple relationship between price and yield, the further up in price you go without the payout increasing correspondingly, the lower you are effectively yielding.
Currently, Energy Transfer is at a yield of 6.35%. Assuming the unit price rose to $30 in 2030, and the payout increases only slightly, the yield on that $30 unit would be just about 5.1%. It’s the same yield-first math we leaned on comparing OXY and XOM’s dividends — price targets mean little until you check what they do to the payout you’re actually being promised. Climb to $36, and the yield implied is around 4.3%. Hit that eye-popping figure of $45.35 and you will be at approximately 3.4% – just over half the current yield.
That is to say: all the bullish expectations of Energy Transfer are silently placing bets that investors will be content to receive a significantly smaller payout, price-adjusted, than they receive today. Maybe that happens. Maybe it doesn’t. However, it is an assumption to be tested, not a mystery – and it is the truthful variant of an ET Stock Forecast 2030. It’s the same discipline we apply working out Google’s intrinsic value — start from what the business actually pays or earns, and let the price justify itself, not the other way around.
| Source (as of 19 Aug 2026) | 2030 figure | Yield @ $1.54 | Yield @ $1.69 | Basis |
| StockScan.io | $10.27 | 15.0% | 16.5% | Stated annual average. Only consistent with a cut. |
| Traders Union | $26.33 | 5.85% | 6.42% | Year-end |
| Motley Fool — DERIVED | $27.82 | 5.54% | 6.07% | Its “$30 in about five years” pulled back to four. Our derivation. |
| CoinPriceForecast | $31.21 | 4.93% | 5.41% | Year-end |
| CoinCodex | $36.05 | 4.27% | 4.69% | Annual average of monthly means |
| LongForecast | $37.62 | 4.09% | 4.49% | September 2030 close — no year-end row exists |
| Simply Wall St — NOT A 2030 TARGET | $41.64 | 3.70% | 4.06% | A present-day fair value. Included for range only. |
| AltIndex | $45.35 | 3.40% | 3.73% | Linear extrapolation. Was $37.18 the same morning. |
| ET today (18 Aug 2026 close) | $21.42 | 6.35% | 6.35% | Actual, on the $1.36 annualised rate |
| FinancialBeings — Balanced-Growth | $24.81 | 6.21% | 6.81% | Our own. Derived. |
What each published 2030 figure implies. Yields are the 2030 distribution divided by the 2030 figure. $1.54 is Energy Transfer’s realised increment of +$0.0025 a quarter sustained; $1.69 is the top of its stated 3–5% band. Data as of 19 August 2026.
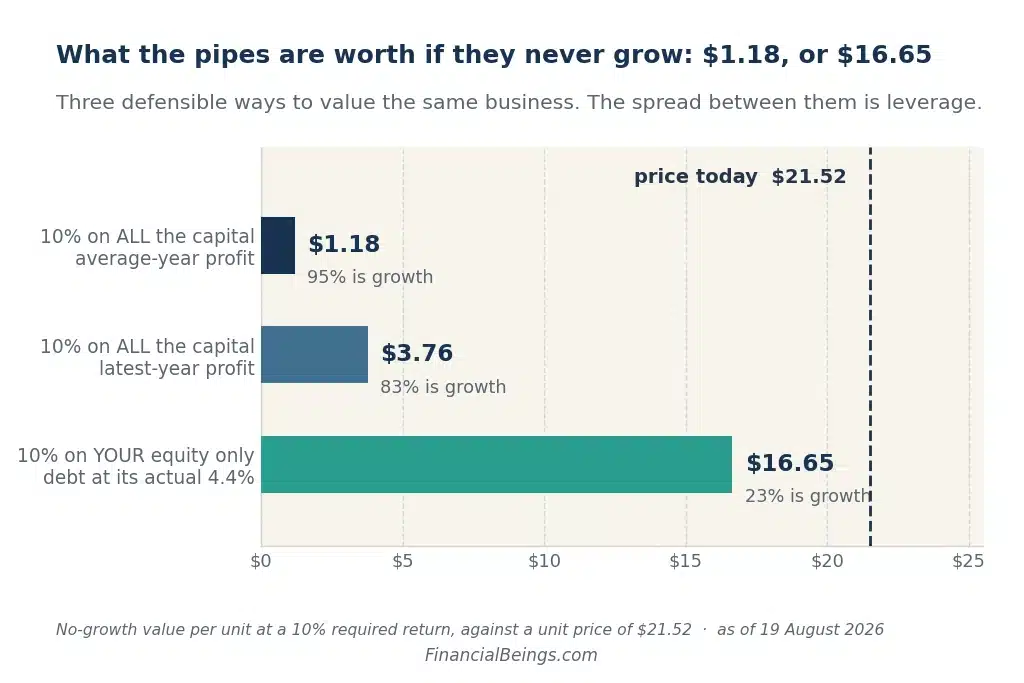
What Maria Would Actually Collect
This is where Maria becomes able to see the story as real.
Suppose that she purchased them today and solely held them until the end of 2030, receiving the quarterly payments. Assuming that Energy Transfer continues to increase its distribution at the rate that it has been doing so over the past few years, namely, small incremental increases, she would receive approximately $6.16 per unit of cash payments alone between now and the end of 2030. Prior to the unit price changing by a single cent.
In other words: even in a dull, no-drama situation, where the price would hardly move, Maria would still take home money worth nearly 29 per cent of the price she would pay, simply by waiting and cashing checks. Nearly all online predictions do not consider this in the slightest and discuss only the price target – as though the years of cash payments in between do not exist.
They do count. In an investment that is constructed around constant payments, the amount of cash that you pick up on the way is frequently a larger component of the narrative than the place the price will end up.
There is only one fair warning, though: this is not certain. Energy Transfer in fact reduced its payout in 2020, reducing it by half in a bad run in the energy markets, and did not fully recover until over two years later. So the $6.16 must be accompanied by an asterisk: it holds only if the company continues to increase the payouts as it has done lately. There is nothing about that which is fixed.
What the Company Has Actually Promised
Strip away the forecasts and look only at what Energy Transfer itself has said publicly, and the picture gets narrower and more honest.
The company has steered investors to adjusted EBITDA of $18.8–19.1 billion for 2026, has devoted genuine cash, above five billion dollars annually, to new pipeline and infrastructure initiatives up to 2029, and has mentioned that it will expand its payout between 3 and 5 percent per annum. That’s it. That is all the recorded plan.
It is significant that one of the major projects, a large natural gas export terminal, was suspended in December 2025. It is still attributed as a future driver of growth by some online summaries. It is not one anymore and making it seem like a certainty is overstating the future.
What You’re Actually Buying
The surprise of most new purchasers of pipeline partnerships such as this one is as follows: you do not own all the cash flow that the company produces.
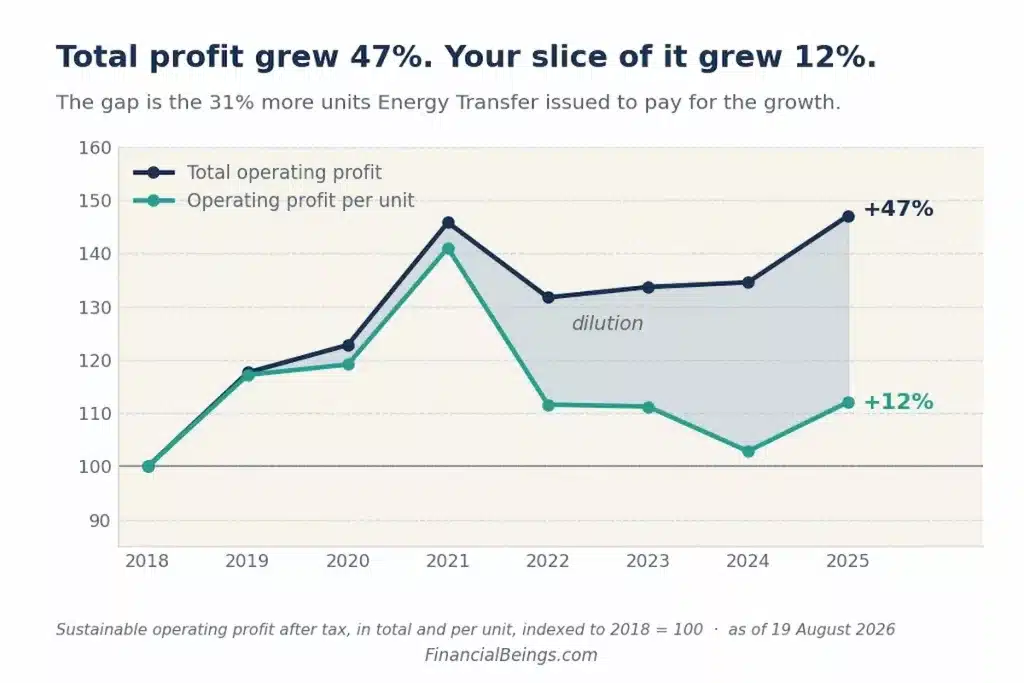
A substantial portion of the earnings of Energy Transfer, approximately a quarter, is really a portion of the earnings of other, smaller businesses that Energy Transfer controls but does not own completely. That slice is baked into the headline figures. Strip it out, and what really flows to you, the unitholder, is significantly less.
Another tax peculiarity to be aware of prior to purchase is the form of tax filing these partnerships file: The firm will not send you a form 1099, as most investors are accustomed to, but a Schedule K-1. K-1s are usually late to file and may complicate a tax filing, particularly within a retirement account. Most people do not see it as a dealbreaker, but it is a real difference, and something worth enquiring of a tax professional before you do.
Coverage is comfortable on the partnership’s own figures: distributable cash flow covered the distribution 2.21 times in the second quarter of 2026 and 1.99 times over the trailing twelve months. Energy Transfer publishes no coverage ratio, so both are our calculation. Note also that the 92.11% “payout ratio” shown by aggregators divides the distribution by GAAP earnings; measured against distributable cash flow, the payout is closer to 50%.
This is descriptive, not tax advice — consult your own adviser.
What Could Go Wrong
Nothing here is a sure thing, and it’s worth saying plainly what the risks are.
In the past two years, debt has increased by approximately a third, to $68,393 million excluding lease liabilities. The company previously issued a leverage target of 4.0 to 4.5 times; that target has been removed without comment in its latest investor materials. That is no evidence of trouble, but it is the sort of thing to keep an eye on.
Most of the largest planned projects are yet to obtain government permits, and at least one has been postponed twice. And that 2020 payout reduction is a fact: consistent, increasing cash payments are secure until, at times, they aren’t.
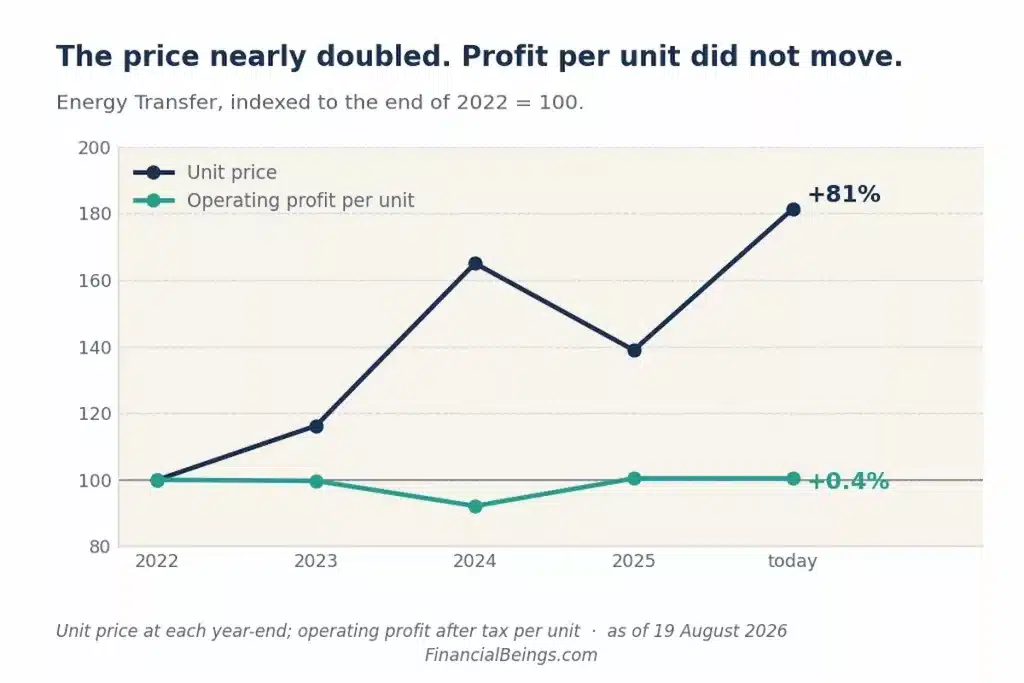
The exit multiple is the single biggest risk, and it can be quantified. The units trade at 7.54 times forecast 2026 adjusted EBITDA today. Below about 6.6 times in 2030 — the range is 6.3 to 6.9 times depending which EBITDA path lands — a buyer today is behind on price and collects only the distributions. That leaves roughly 13% of multiple compression before the price works against you.
So, What’s a Realistic Number?
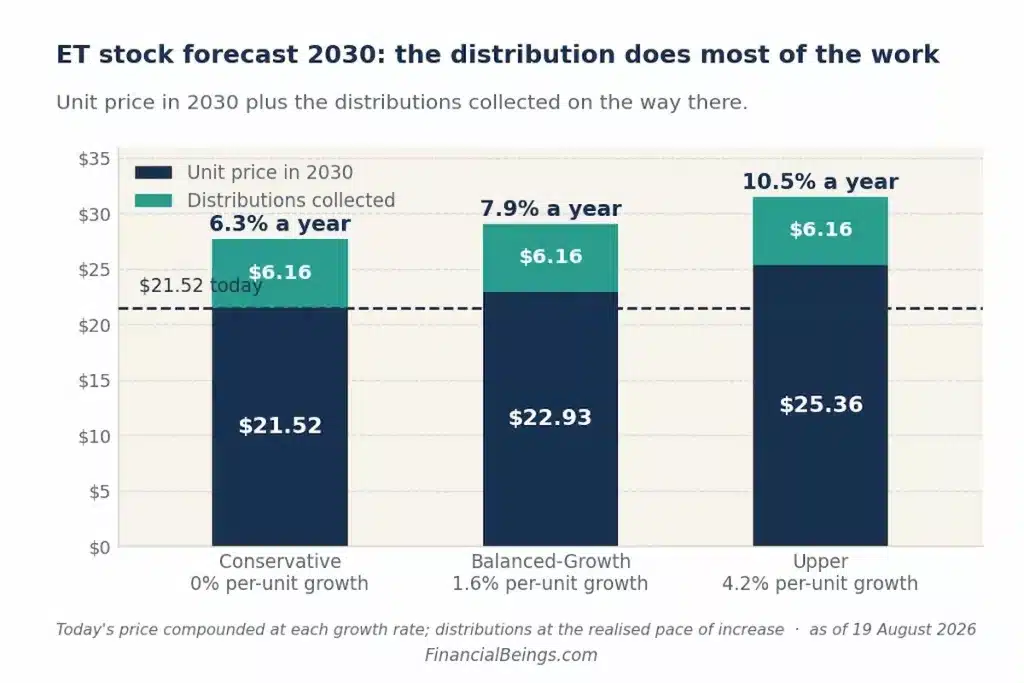
| Scenario | 2030 EBITDA | Exit multiple | 2030 unit price | Yield @ $1.54 | Total return a year |
| Conservative | $21.2bn | 6.2x | $17.17 | 9.0% | +2.0% |
| Balanced-Growth | $22.3bn | 7.1x | $24.81 | 6.2% | +8.8% |
| Upper | $23.1bn | 7.5x | $29.05 | 5.3% | +12.1% |
Enterprise value less net debt, divided by units, on the same equity-plus-net-debt convention as the 7.54x the units trade at on FY2026 guidance today. Net debt excludes lease liabilities. Total return adds $6.16 of cumulative distributions and annualises over 4.37 years from the $21.42 close of 18 August 2026. Data as of 19 August 2026.
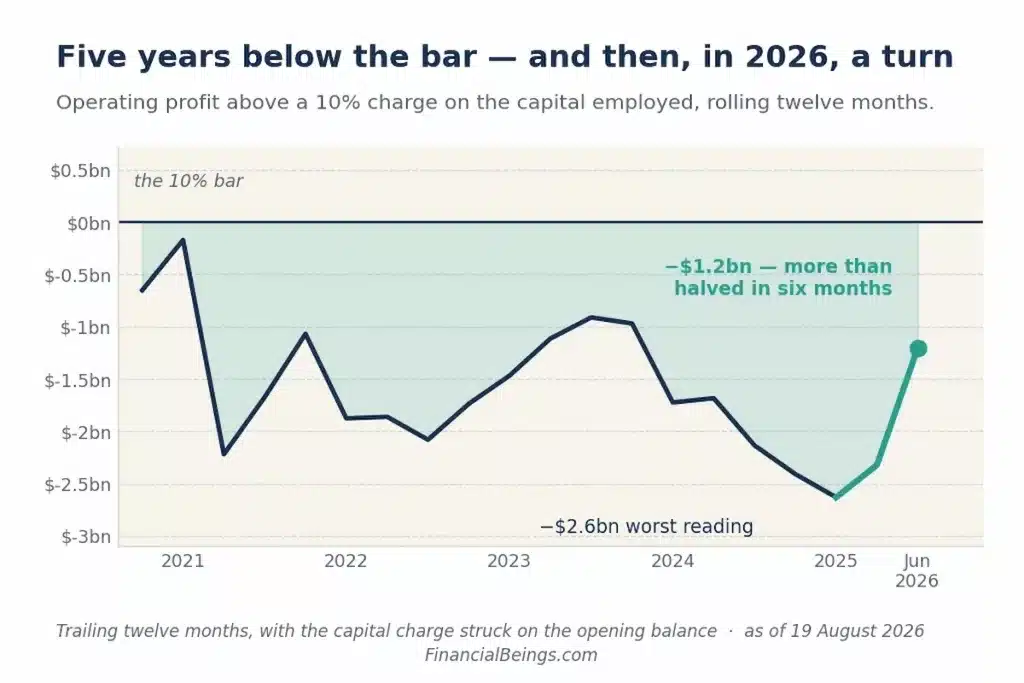
One finding deserves stating plainly, and it cuts both ways. Energy Transfer did not earn a 10% return on its operating capital in any of the ten years to 2025, falling short by between $0.9 billion and $4.9 billion a year. Then, in the first half of 2026, it turned: the trailing shortfall more than halved, from $2.63 billion at the end of 2025 to $1.21 billion by June, and the June quarter cleared the charge for the first time in the series. Both halves matter — the decade explains the scepticism, and the turn is the freshest thing on this page.
Starting with what Energy Transfer has stated, and not what the internet is speculating about, a sensible 2030 range is between approximately $17 at the pessimistic end and $29 at the optimistic end, with a halfway point of about $24.80. Adding the cash payments along the way, that middle case would translate to a high single-digit annual payoff, with the majority of that payoff being the payouts, rather than the price.
And that medium number is nearly at the $24.48 twelve-month price target Wall Street already has of its own. The four years of projected growth may already be contained in the current price, which in itself is an answer.
It was not a price that Maria learned. The practice was to scrutinize the yield a price presupposes, before trusting the price.
Frequently Asked Questions
What is the ET Stock Forecast 2030?
Published forecasts run from $10.27 to $45.35. An approximate estimate based solely on what the company has announced is between $17 and $29 with a midpoint of about $24.80 – the wide popular range being representative of the amount of guesswork used in projecting four years ahead.
Where will ET stock be in 5 years?
Five years to the future is 2031, not 2030 – which is worth mentioning, as some sources confuse the two. By 2030, an intermediate projection places the unit around $24.80, and overall returns (price growth plus payouts) would be around 8-9 percent/year assuming that the increase in payouts remains at the current rate.
Is ET stock a good long-term investment?
The answer to that is not a judgment this article can render, but rather what you want to accomplish and how much risk you can undertake. What is known: the distribution has been maintained at a comfortable level by the cash flow in the recent past, and the yield is 6.35%. What is also known: There is an increase in debt, and the company has reduced its payout at least once, in 2020.
How high will ET stock go?
No one is sure, that is the truthful response. The yield that can be checked is the yield at various prices: $30 would imply a 5.1 percent yield, $36 would imply 4.3 percent, $45 would imply 3.4 percent, against 6.35 percent today. All these are bets that investors will receive a lower payout than they receive at the current price.
