
On the numbers that decide it, nvidia vs apple stock is close to a tie: both are priced to hand you almost exactly the same expected return — around 10% a year — despite running two businesses that could hardly be less alike.
Is Nvidia or Apple the better stock to buy right now?
Neither, on valuation — the market has priced them almost identically, and what either is worth turns entirely on a growth rate nobody can verify in advance.
Table 1 — What each is worth at a 10% required return, by growth outcome
| If growth turns out to be… | NVDA value/share | vs price ($208.76) | AAPL value/share | vs price ($321.66) |
| 4% — the economy’s own rate | $73.76 | 35% | $121.14 | 38% |
| 6% | $107.40 | 51% | $179.20 | 56% |
| 7% | $141.03 | 68% | $237.26 | 74% |
| What the market actually assumes | $208.55 | 100% | $325.75 | 101% |
| 8.5% | $275.57 | 132% | $469.50 | 146% |
Start with the bold row — 8.00% growth for Nvidia, 7.80% for Apple. Value equals price there, which is arithmetic rather than a finding: the market’s assumption is defined as the rate that makes the two equal. What matters sits either side of it. A point below and you are paying a dollar for roughly seventy cents; half a point above and you are getting $1.32 to $1.46. Same fulcrum, both stocks.
Now split that expected return into where it actually comes from.
Table 2 — Where the expected return comes from
| Component | NVIDIA | Apple |
| Return at current price | 10.40% | 10.16% |
| Return from current operations | 2.65pp | 2.57pp |
| Return from future growth | 7.75pp | 7.59pp |
| Share of return dependent on future growth | 74.5% | 74.7% |
| Share of price dependent on future growth | 77.5% | 76.8% |
Barely two and a half points of that ten come from the business as it exists today; the rest is forecast — 74.5% of Nvidia’s return against 74.7% of Apple’s. You are not choosing between a growth stock and a quality stock, but between two growth bets priced as very nearly the same bet.
Nvidia vs Apple stock at a glance: how do the two compare?
Both companies are worth close to $5 trillion, and the lead has changed hands more than once in 2026.
Table 3 — NVDA vs AAPL snapshot (prices to 25 July 2026; multiples on each company’s latest fiscal year; yields from the most recently declared quarterly rate — $0.25 for Nvidia, $0.26 for Apple — annualised at those prices)
| Metric | NVIDIA (NVDA) | Apple (AAPL) |
| Share price | $208.76 | $321.66 |
| Market cap | $5.05T | $4.73T |
| P/E as commonly quoted | 16.1× | 34.3× |
| P/E based on operations | 45.4× | 43.9× |
| P/B as commonly quoted | 31.9× | 66.3× |
| P/B based on operations | 41.4× | 41.5× |
| Latest quarterly revenue | $81.6B (+85.2% YoY) | $111.2B (+16.6% YoY) |
| Operating margin (quarter) | 65.6% | 32.3% |
| Net financial position (reformulated) | +$36.5B net asset | −$21.6B net obligation |
| Dividend yield (declared rate, annualised) | ~0.48% | ~0.32% |
The multiple rows are the ones to sit with. On the numbers most pages quote, Nvidia looks half Apple’s price — 16 times earnings against 34. Measure the operations alone and the gap disappears: 45.4 times against 43.9 on earnings, and 41.4 against 41.5 on book value. Those are the multiples that describe the two businesses; the headline versions describe their balance sheets.
Apple’s book equity has been hollowed by years of buybacks, which inflates its reported multiples, while Nvidia’s $36.5 billion net financial asset deflates its own. On a headline cash-versus-debt view Apple still shows net cash — this model keeps long-term securities inside the operating business.
Why don’t Nvidia’s fatter margins make it the better business?
Because margin is only half the equation. Nvidia keeps about 52 cents of after-tax operating profit per revenue dollar; Apple keeps 27. On that alone Nvidia looks twice the business. But profit per dollar of sales says nothing about the capital you tied up to make the sale.
A jeweller earns a large markup on few transactions; a supermarket a thin one, many times over. Which is better depends on how fast each turns its shelves — and that is where this comparison flips.
Return on net operating assets (RNOA — after-tax operating profit divided by the capital actually employed in the business) breaks into two parts: profit margin × asset turnover. We’ve applied the same RNOA framework to other sector comparisons, such as our Walmart vs Costco breakdown.
Table 4 — Return on operating capital. One year of profit, three capital bases.
| Metric (trailing twelve months) | NVIDIA | Apple |
| After-tax operating margin (PM) | 52.4% | 27.1% |
| Net operating assets — a year ago | $40.4B | $115.3B |
| Net operating assets — average of the five quarter-ends | $88.7B | $118.3B |
| Net operating assets — today | $159.0B | $128.1B |
| ATO / RNOA on average capital | 2.86× / 149.8% | 3.82× / 103.4% |
| ATO / RNOA on today’s capital | 1.59× / 83.6% | 3.52× / 95.4% |
| Operating income above the cost of capital, charged on today’s capital | $117.0B | $109.5B |
Every figure there uses the same twelve months of profit; only the capital base changes. On that one change Nvidia reads 328.6%, 149.8% and 83.6%, while Apple reads 106.1%, 103.4% and 95.4% — a spread of eleven points against Nvidia’s two hundred and forty-five.
So Nvidia’s headline return on capital is mostly a statement about which denominator someone picked. On the base that describes the company as it exists now, the ranking inverts: Apple 95.4%, Nvidia 83.6%.
The reason is the balance sheet. Nvidia’s net operating assets grew 293% in a year, to $159.0 billion, as the Blackwell and Rubin ramp absorbed inventory, prepaid supply commitments and receivables. A year of profit divided by a base that nearly quadrupled during it flatters the return.
Apple’s capital base moved 11%, which is why its three readings barely differ — manufacturing is contracted out, suppliers are paid late and services revenue arrives up front, so $451 billion of revenue turns on $128.1 billion of capital against Nvidia’s $253 billion on $159.0 billion.
Growth consumes capital. Nvidia’s margin advantage is real, and on economic profit — operating income left over after charging the business for the capital it uses at today’s base — Nvidia is still ahead, $117.0 billion to $109.5 billion. It is simply earning that on a capital base it is rebuilding, which is what the return on today’s capital is telling you.
What growth does each share price already assume?
Every share price splits in two: what you can account for from the business as it stands, and what you are speculating about. Put today’s price on the left of the model and solve for the growth that justifies it, and the market’s assumption becomes visible.
At a 10% required return, Nvidia’s price says the market expects about 8.00% perpetual growth in operating income above the cost of capital; Apple’s says 7.80%. The long-run US economy grows around 4%: both prices ask you to believe these companies compound excess profit at twice that rate, indefinitely.
Figure 1 — Nvidia: the market’s pricing of growth, by fiscal quarter. Speculative growth as a share of share price. Source: FinancialBeings model.
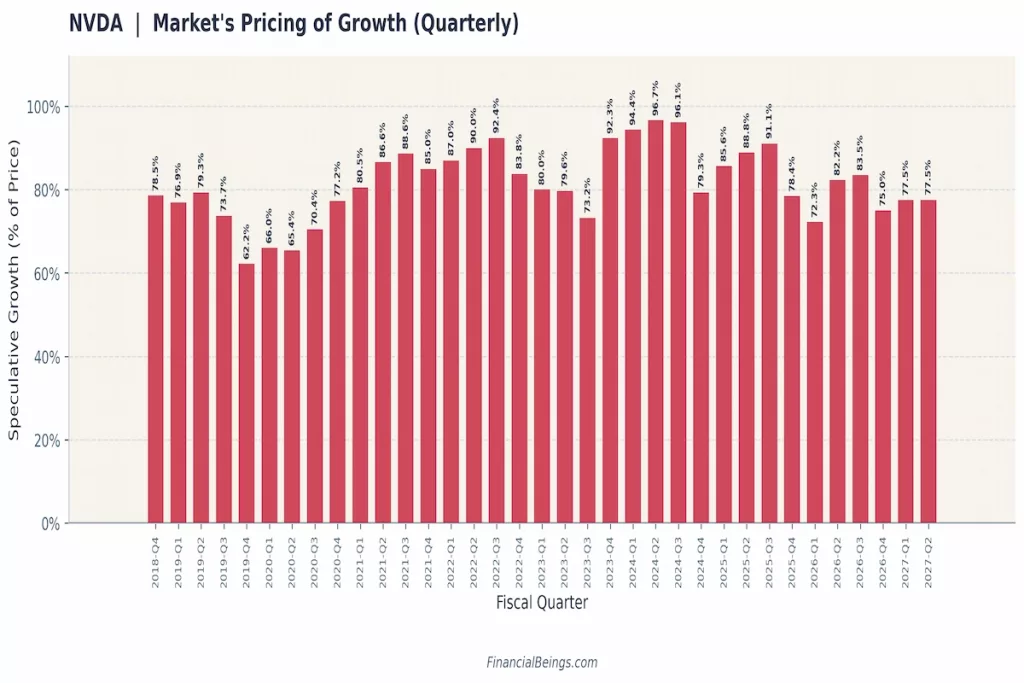
Figure 2 — Apple: the market’s pricing of growth, by fiscal quarter. Speculative growth as a share of share price. Source: FinancialBeings model.
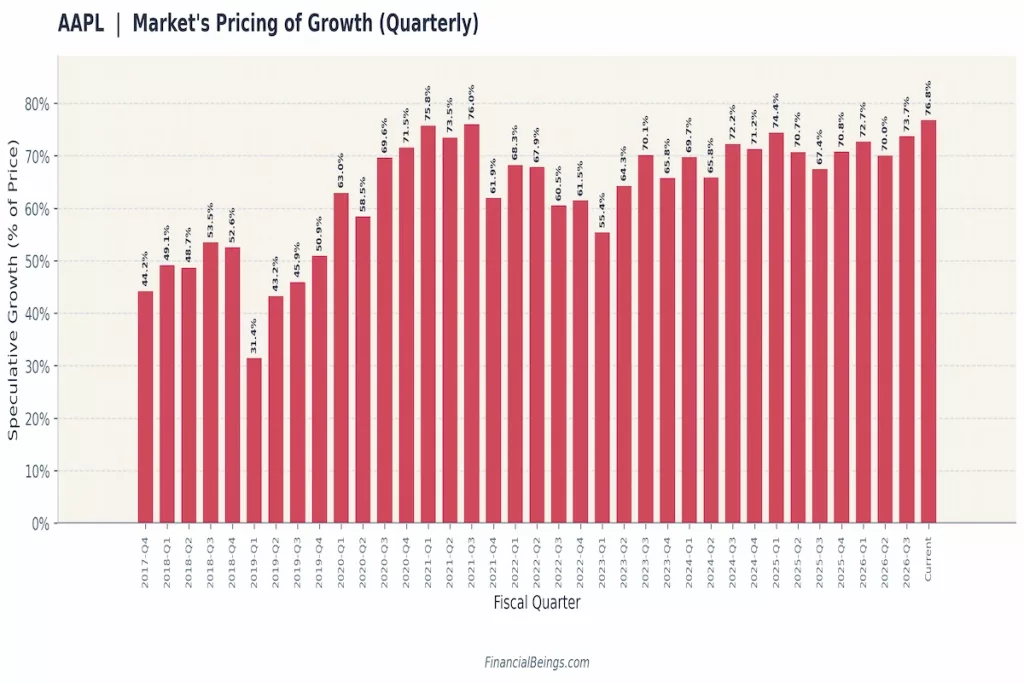
Here is where the consensus view gets uncomfortable. Apple’s speculative share of price sits at 76.8% — $74.62 of its $321.66 price is covered by the business as it stands, the rest is the bet. That is the highest reading in its entire series, edging past the 76.0% of 2021-Q3. Nvidia’s share is 77.5%, essentially the same number, and a long way below the 96.7% it reached in 2024.
Figure 1 shows how Nvidia got there. Its reading dropped from 83.5% to 75.0% in a single quarter — not because sentiment turned, but because a completed fiscal year moved a large slice of value out of the speculative column and into the accounted-for one. This ratio responds to accounting resets as well as to mood, which is why a falling reading is not by itself evidence of a bargain. For the full quarterly breakdown, see our standalone Nvidia valuation analysis.
So the popular framing inverts. The two are asking for near-identical faith, but Apple has never been priced this aggressively against its own record, and Nvidia has been — repeatedly.
Table 1 held the required return fixed and moved growth; this moves the other lever. At a 10% hurdle both prices need roughly 8% growth; at 8%, the requirement falls to 5.98% for Nvidia and 5.76% for Apple. The higher the return you demand, the more growth you have to believe in to justify the same price — which is why the hurdle rate is a decision, not a constant.
Table 5 — What you are actually paying for
| Component of the share price | NVIDIA | Apple |
| Book value | $6.50 (3.1%) | $5.01 (1.6%) |
| Earnings you can already account for | $40.39 (19.3%) | $69.61 (21.6%) |
| Speculative growth | $161.87 (77.5%) | $247.04 (76.8%) |
| Share price | $208.76 | $321.66 |
| Market’s expected growth at r = 10% | 8.00% | 7.80% |
| Market’s expected growth at r = 8% | 5.98% | 5.76% |
The middle row deserves more attention than it usually gets. It is the part of the price that current accounts already support — 21.6% at Apple, 19.3% at Nvidia. Once Nvidia’s FY2026 results are in the anchor, the two companies are asking for almost exactly the same act of faith.
All figures computed at the Table 3 prices, each company’s latest available mark in the week to 25 July 2026. Assumptions: returns on operating assets are stated on the opening capital base except where marked TTM, which uses the ending base; effective rather than statutory tax rates; net operating assets are operating assets less operating liabilities, excluding cash and debt.
Where does the money actually come from?
Nvidia is one business. Apple is five.
Data Center accounted for $75.2 billion of Nvidia’s $81.6 billion quarter — 92% of revenue, up 92% — split roughly evenly between hyperscalers (+115%) and AI clouds, industrial and enterprise (+74%). China data-center compute contributed nothing, against $4.6 billion a year ago, and next-quarter guidance assumes it stays there.
Apple’s quarter split five ways: iPhone $57.0 billion (+21.7%), a record Services quarter at $31.0 billion (+16.3%), Mac $8.4 billion, Wearables and Home $7.9 billion, iPad $6.9 billion. On the AI question competitors keep asking without answering: Apple signed a deal with Google in January 2026, reported at roughly $1 billion a year, to put a custom Gemini model behind a rebuilt Siri, shipping with iOS 27 and iPhone 18 — renting the model rather than building it.
Over a full twelve months the two diverge in a way the revenue lines do not suggest. Apple: $451 billion of revenue producing $109.5 billion of operating income above its cost of capital. Nvidia: $253 billion producing $117.0 billion. Just over half the revenue, and more economic profit — a more efficient machine on a far narrower base.
What breaks each case?
Each has one risk large enough to reset the thesis, and both are visible in the earnings data.
Figure 3 — Nvidia: share price against trailing twelve-month diluted EPS, by fiscal quarter. Series ends fiscal 2027-Q1. Source: company filings; FinancialBeings.
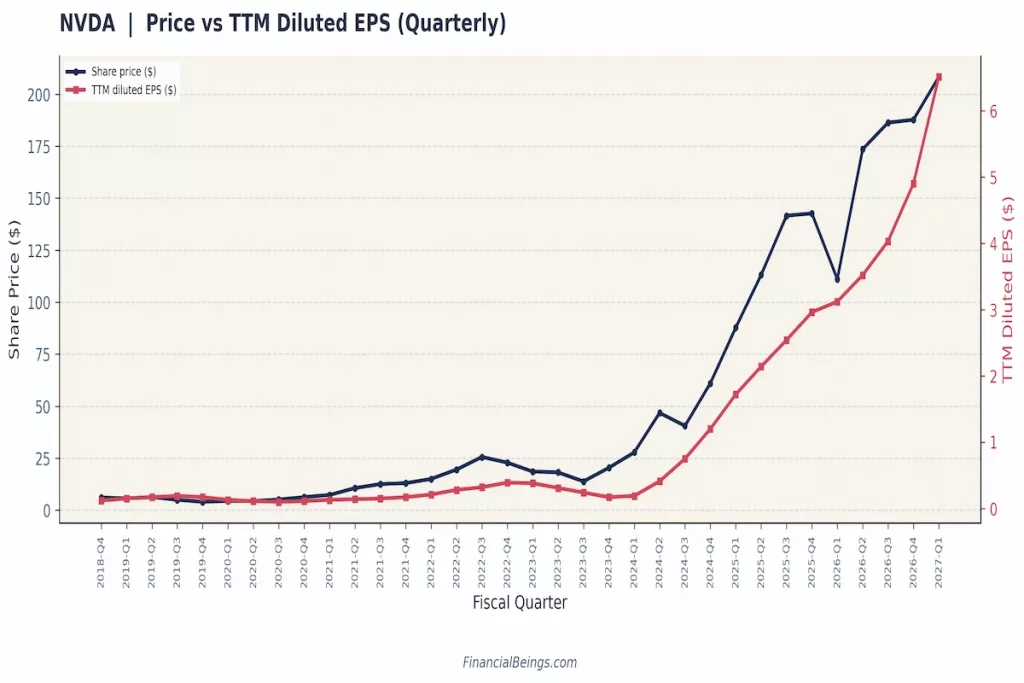
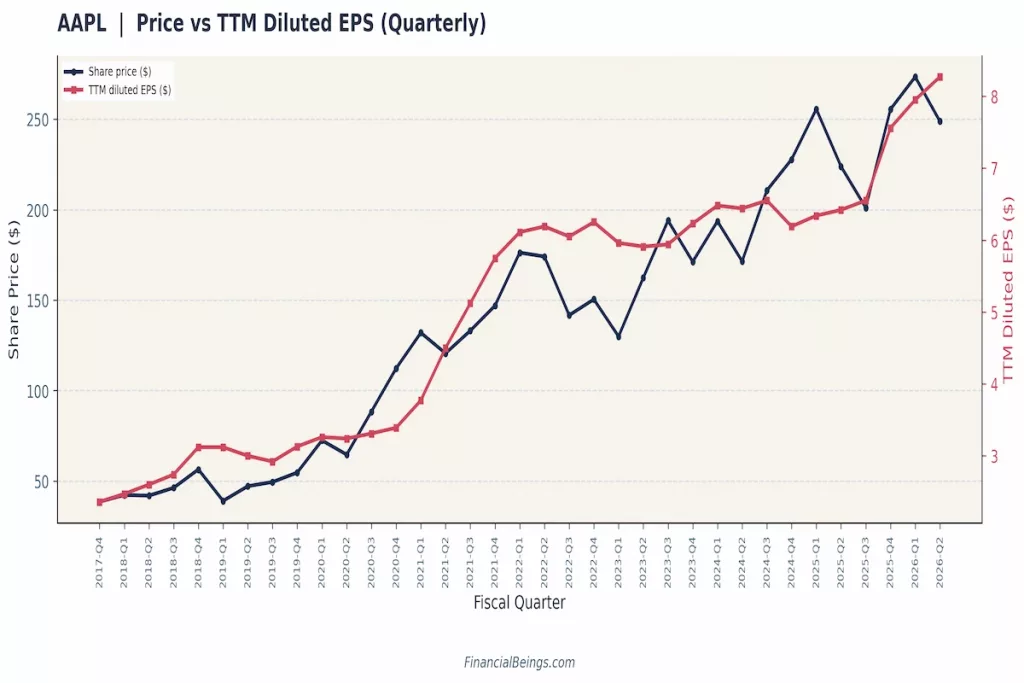
Figure 4 — Apple: share price against trailing twelve-month diluted EPS, by fiscal quarter. Series ends fiscal 2026-Q2. Source: company filings; FinancialBeings.
Nvidia’s risk is capex digestion, and it is not that profit is slowing — economic profit is accelerating. The problem is that the capital behind it grew 293% over the same span. Profit rising while capital rises faster is how a 328% return becomes an 84% one, and it is why Nvidia now earns less on today’s capital than Apple does. Figure 3 shows price and earnings climbing almost together over five quarters, so the multiple has barely moved. Demand this concentrated does not need a recession to disappoint. It needs one budget cycle.
Apple’s risk is the reported $20 billion a year it receives from Google for default search placement — close to pure profit, and under appeal since Google’s 22 May 2026 filing.
Figure 4 shows a subtler one: for three fiscal years Apple’s trailing earnings went essentially nowhere while the price travelled from $176 down to $130 and up to $256. Almost none of that was earnings — it was the multiple moving, and multiples move both ways. Tim Cook’s last day is 31 August 2026, with John Ternus taking over on 1 September — the 30 July call is his last. For the full quarterly breakdown, see our standalone Apple valuation analysis.
One note on method. Every valuation figure here — returns on capital, economic profit, growth expectations and fair value — is built on operating income, the profit the business itself produces before anything the financing side contributes. Market multiples and dividend yields in Table 3 are the exception, and are quoted on a reported basis.
Which one fits your portfolio?
Want a compounder and a single holding? Apple — not because it is cheap, it is at the top of its own valuation range, but because the earnings base is broader and the capital base is stable enough to model.
Want AI-infrastructure exposure? Nvidia, sized to respect a 92%-of-revenue concentration.
Want both? Defensible — they sell into different demand cycles even though the model prices them almost identically. Both clear our internal moat screen in every fiscal year we have assessed: a comparison of earning power against the cost of reproducing the assets, not a third-party rating. If you’re weighing Nvidia against other AI infrastructure names, see our AMD and Broadcom comparisons.
Table 6 — What you actually earn, by growth outcome
| If that growth settles at… | Nvidia, you earn | Apple, you earn |
| 0% (business just holds) | 2.65% | 2.57% |
| 2% | 4.59% | 4.52% |
| 4% (economy rate) | 6.52% | 6.47% |
| 6% | 8.46% | 8.41% |
| 8% | 10.40% | 10.36% |
Read the table across, not down. Whatever you believe about the future, these two hand you the same answer to within a tenth of a percentage point. Neither clears 10% until growth passes about 7.6% a year, forever; at the economy’s own 4% rate you earn roughly 6.5%. The whole thesis lives in the gap between those rows, and it rests on a number nobody can verify in advance.
What would change our view: on Nvidia, another year in which the capital base outgrows economic profit, or a hyperscaler trimming capex. On Apple, an adverse ruling on the Google payment, or services ceasing to outgrow hardware.
The analysis is ours; the hurdle rate, and the decision, are yours. The full method sits on our valuation methodology page, our NVDA and AAPL analysis pages track both quarterly, and the same lens runs through our Walmart vs Costco head-to-head.
Frequently asked questions
Which is bigger, Nvidia or Apple?
Nvidia — $5.05 trillion against Apple’s $4.73 trillion in late July 2026. The lead has changed hands repeatedly this year.
Does Nvidia or Apple pay a better dividend?
Nvidia now does, and that is new. It raised its quarterly payout twenty-five-fold to $0.25 a share in June 2026, taking the annualised yield to roughly 0.48% against Apple’s 0.32%. Neither is an income holding: on a $10,000 position that is about $48 a year versus $32.
Has Nvidia outperformed Apple over ten years?
By a wide margin — and it is the least useful number here, earned by a business that no longer exists in the same form.
Is it too late to buy Nvidia?
That depends on the growth you believe in. At the roughly 8% the market already assumes, you pay about what it is worth. At 7% you are paying a dollar for 68 cents. Neither name offers a margin of safety at today’s price.
Figures are point-in-time as of 26 July 2026 and drawn from company filings with the SEC. Capital-efficiency and growth-expectation figures are FinancialBeings model calculations, not reported figures; market data should be re-verified before you act. Apple reports Q3 FY2026 on 30 July and Nvidia reports Q2 FY2027 on 26 August — this page will be updated after both. Position disclosure: the author holds no position in either NVDA or AAPL at the time of writing. This is information, not personalised investment advice.
📚 Sources & References
- Apple Inc. (2025, October 31). Annual report (Form 10-K) for the fiscal year ended September 27, 2025. U.S. Securities and Exchange Commission. Link
- Apple Inc. (2026, May 1). Quarterly report (Form 10-Q) for the quarterly period ended March 28, 2026. U.S. Securities and Exchange Commission. Link
- NVIDIA Corporation. (2026, February 25). Annual report (Form 10-K) for the fiscal year ended January 25, 2026. U.S. Securities and Exchange Commission. Link
- NVIDIA Corporation. (2026, May 20). Quarterly report (Form 10-Q) for the quarterly period ended April 26, 2026. U.S. Securities and Exchange Commission. Link
© 2026 FinancialBeings.com
This article is for informational purposes only and does not constitute personalized financial advice.
