The Apple Stock Price Prediction 2026 — Will Apple (AAPL) Buy Before its next iPhone Supercycle? Observe growth forecasts, innovation trends, and valuation trends that determine future growth opportunities of Apple.
Apple Inc. (AAPL) has remained the most influential technology company in the world of technology and it has continued to affect the consumer behaviour of people in the world in terms of design leadership, ecosystem integration, and innovativeness in its competitiveness. When the investors consider the Apple stock price prediction 2026, the debate extends beyond the response of the short-term business reaction and into the detailed analysis of the structural performance measures that involve operating margins, operating revenue, net operating assets, including the remaining earnings per share.
The image is reinforced by the fact that the company has been stable financially over the past 10 years, which means that the company is still a high-end, stable, and well-positioned company that can overcome the volatility of the market.
At the same time, the popularity of the eco-systems built with the help of AI, the development of digital services, and the potential of another iPhone megacycle all have a tremendous impact on the hopes of investors. The behavioral finance study mentions that brand loyalty, anticipation bias, and faith in the innovation stream of Apple are paramount to enhancing the feeling of investment. The above-mentioned factors affect all stories about the AAPL stock prediction 2026, which is why the analysis should be based on data and fully aware of psychology.
In this article, Apple’s margins, asset management, performance, Apple innovation and AI strategy will be discussed and applied to the more general question of whether the company is still a good long-term investment or not, and how these variables can best guide realistic views on the Apple stock price prediction 2026.
Financial Performance
The first step in the breakdown of Apple stock price prediction 2026 is the understanding of the financial underpinnings of the company. The revenue, EBITDA, and free cash flow chart that you have provided reveals stable and good trends in the period 2022-2025.
Table 1. Apple’s Key Financials (Rounded Figures in $ Millions)
| Year | Revenue | EBITDA | Free Cash Flow |
| 2022 | 394,328 | 130,541 | 111,443 |
| 2023 | 383,285 | 125,820 | 99,584 |
| 2024 | 391,035 | 134,661 | 108,807 |
| 2025 | 416,161 | 144,748 | 98,767 |
Interpretation and Implications
The following values can lead to some important lessons for Apple as far as its long-term valuation is concerned:
Revenue Resilience
Apple is enjoying a highly stable income that fluctuates a bit with the changes in the economy of world. The variance between the $383B and $416B means that the diversified product and service ecosystem of Apple is diversified in order to react to the market shocks. When the demand is unpredictable, the business continues to receive high volume, repeat revenue streams that increase as a result of the installed base.
EBITDA Expansion
EBITDA is seen to possess a growing trend since it rose to approximately $126B up to nearly $145B. This cement operational effectiveness and prefigures the fact that Apple has yet to complete streamlining the production process, supply chain, and services development. The increase in the EBITDA is a very important sign that fosters the optimistic view on the Apple share price target 2026.
Free Cash Flow Strength
The ability of Apple to generate some $100B of free cash flow annually on its natural swings is the clue to the long-term interest in the investment of the company. When FCF is high, it is conducive to buyback, dividends, Research and Development, and acquisitions, which are strategic moves that strengthen the stability of valuation.
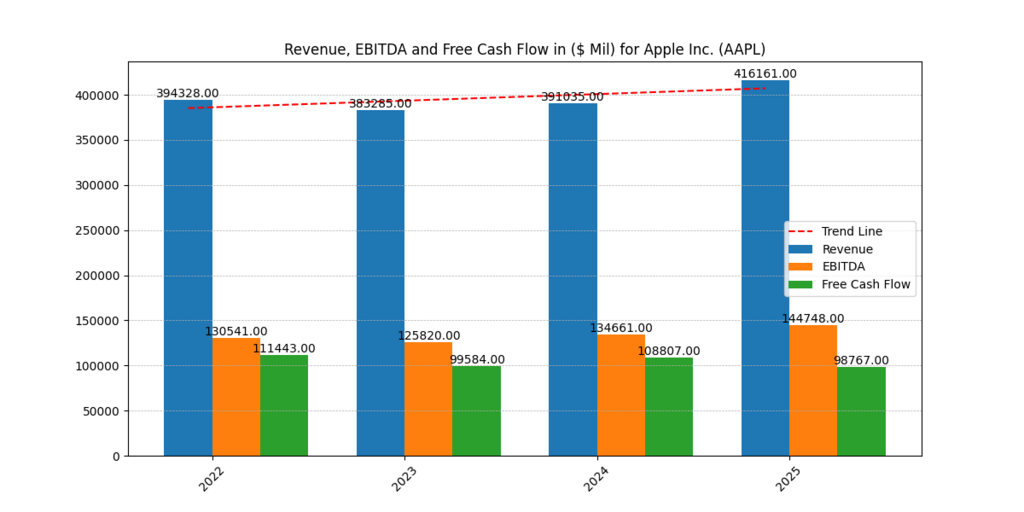
Figure 1. Revenue, EBITDA, and Free Cash Flow for Apple Inc. (2022–2025).
These steady financials are aspects that leave positive anticipations towards the future of Apple stock performance.
Margin Stability and Operational Efficiency (2022–2025)
The margins chart represents gross, operating, and net margins over four years.
Table 2. Apple’s Margin Performance (Rounded Values)
| Year | Gross Margin (%) | Operating Margin (%) | Net Margin (%) |
| 2022 | 43.3 | 30.3 | 25.3 |
| 2023 | 44.1 | 29.8 | 25.3 |
| 2024 | 46.2 | 31.5 | 24.0 |
| 2025 | 46.0 | 32.0 | 26.9 |
Key Insights for 2026 Expectations
Gross Margin Expansion
The price, power, and cost management of the goods change is good since the 43.3% is transformed into approximately 46%. This is done through Apple’s strategic control of components, chip production, and product mix.
Improvement in Operating Margin.
Its operating levels are almost over 30% which is unbelievable in a mega-cap consumer electronics operation. The gradual rise of the 32% percent mark by 2025 acquires power in the efficient operation cost balance of Apple and assists in creating the optimistic economic climate as regards to the AAPL stock perspective 2026. However, if you want to find out a comparison study between AAPL and MSFT, look no further.
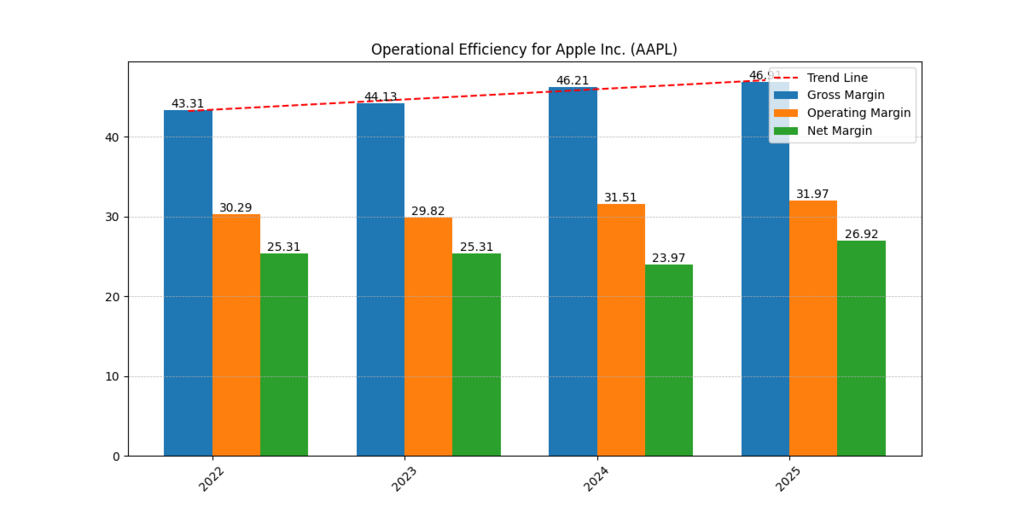
Figure 2. Operational Efficiency for Apple Inc. (Gross, Operating, and Net Margins, 2022–2025).
Net Margin Variability
The net margins have slightly deviated, however, due to the factors of the tax and the cycle of investment; however, net margins are high and stable, which reflects the long-run profitability even during the variations in the macroeconomic conditions.
Claimed risk is reduced by stable high margins, leading to long-term holding behaviour, which leads to above-average support of forecasts like the Apple stock market analysis.
Net Operating Assets vs Operating Liabilities (2016–2025)
The liabilities and NOA of Apple operating provide the impression regarding the asset-light business model of Apple.
Key Observations
- NOA is 0.9×10⁻⁷ and 2.2×10⁻⁷ in the decade.
- It will be noted that the operating liabilities increase in a stable way, which means that it is of greater magnitude and longer periods of payment.
Interpretation
The best financial system is one that offers a balance between good running and reasonable administration of debts. The fact that the NOA of Apple is at an average level implies:
- Low-cost demands on massive growth.
- The services and software are highly scalable.
- Very close relation with the economics of the present platform economy.
The working-capital leverage is efficient and can thus be used to fund day-to-day operations without necessarily using a lot of money to capital investments, as seen in the growth of operating liabilities.
This is the bottom of valuation confidence, which in direct relation is on the side of a positive attitude to Apple stock price forecast 2026.
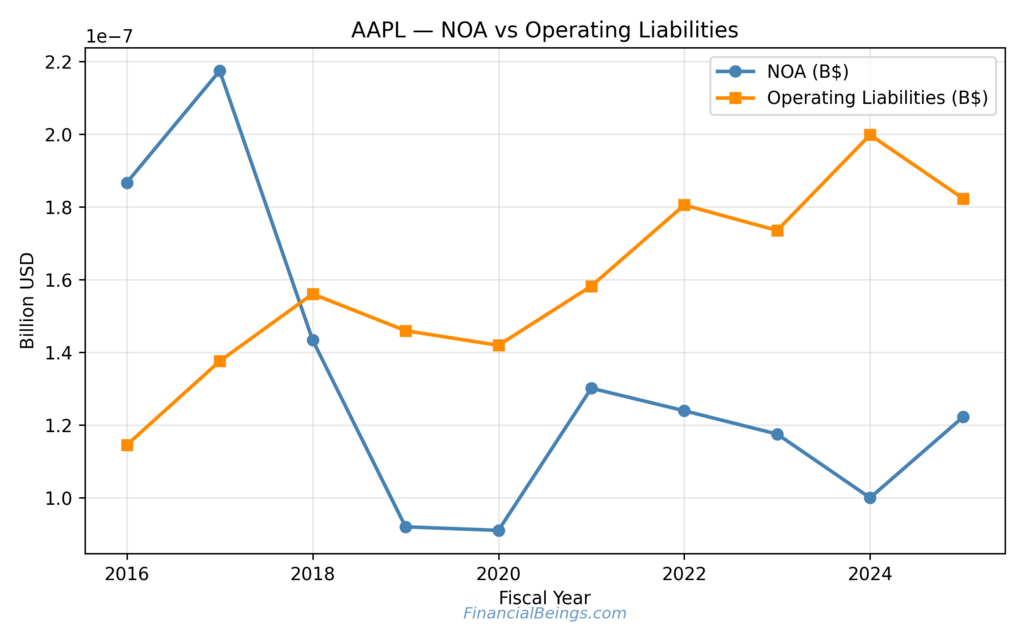
Figure 3. Apple Inc. — Net Operating Assets vs Operating Liabilities (2016–2025)
Return on Net Operating Assets (RNOA)
The narrative of turning operating assets into economic profit at Apple is quite good, as indicated by your RNOA chart.
Rounded RNOA Trends
- Approx. 25% in 2016
- Steady rise to 200% around 2019
- Recent years stabilized between 80-95%
Strategic Implications
RNOA is one of the most obvious indicators of value creation. It is interesting that the very large RNOA of Apple points out:
Superior operating efficiency
Apple has a significantly higher operating income in dollars of net operating assets compared to its average peers.
Shifting toward software and services.
The Apple services unit has assisted in making the company more efficient, scalable, and profitable.
Stronger Valuation justification
High RNOA is associated with low equity values that justify the prediction of Apple stock price 2026.
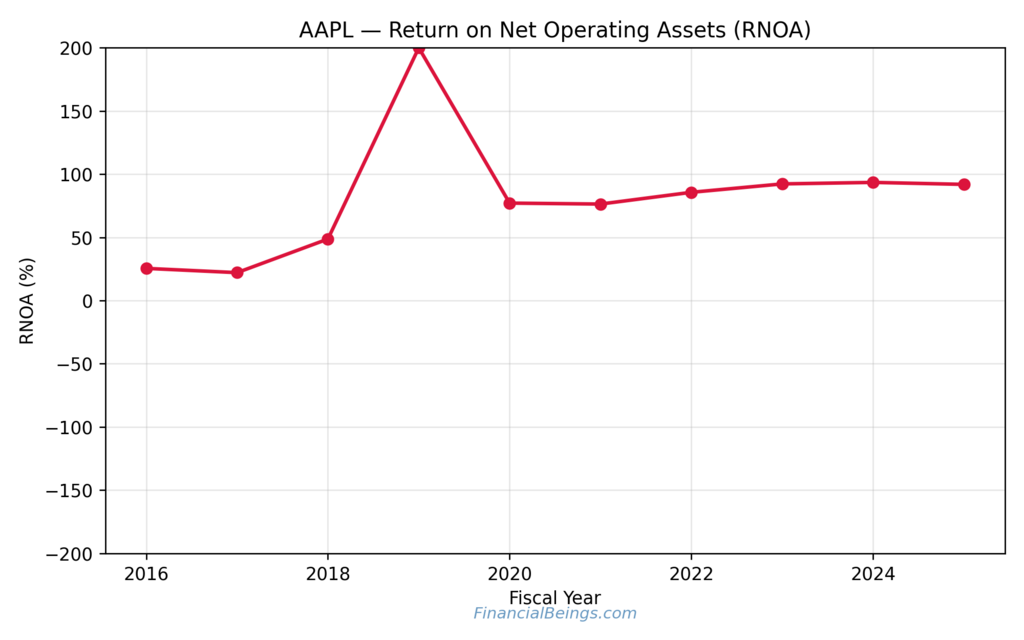
Figure 4. Apple Inc. — Return on Net Operating Assets (2016–2025).
This trust and the high trust of the investor in the firms with steady and high RNOA have a high impact on long-term holding.
Residual Earnings per Share (REPS) and Shareholder Value
Your residual earnings chart shows that Apple can also generate value that is above the required returns.
Rounded Trends
- A peak of approx. $6.8
- A trough near –$0.5
- Stabilisation between $5.5-$5.9 between 2022-2024
Interpretation
The value creation unrelated to the cost of capital is the value generation called residual earnings. The good REPS of Apple are constantly attributed to:
- Strong shareholder returns
- Continuous high value innovation.
- Resilient earnings quality
The stability of REPS shows the premium of the valuation of Apple.
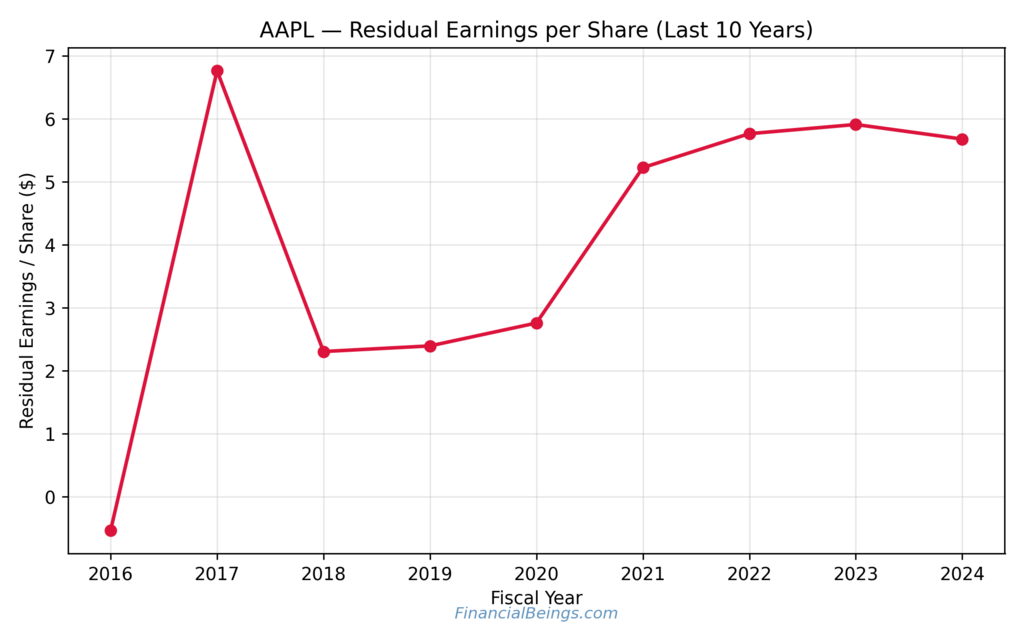
Figure 5. Apple Inc. — Residual Earnings Per Share (2016–2025).
These are some of the factors that contribute to the expectations of the Apple stock price prediction 2026.
Innovation, AI Strategy, and iPhone supercycle impact on Apple shares
Innovation is a primary issue in formulating the investor expectations.
Artificial intelligence across Multiple devices.
Apple valuation and growth outlook have already started stepping into the next gears connected to AI-driven personalization, security, and intelligence on the device, and this direction is already captured in the product announcements of the recent past.
Apple Silicon Expansion
M-series chips remain ahead of the competition in terms of efficiency and performance.
Health and Wearables Growth
Health-centered devices are also a strategic pillar, which has enhanced customer stickiness and uptake of multiple devices.
Services Revenue Scaling
Subsistence income, iCloud, Apple Music, Pay, and TV have recurring high-margin subscription revenue. For our 2026 valuation change after AAPL signs deal for AI services with other companies, please have a look at our latest Apple stock buying guide, “Is Apple Stock Worth Buying in 2026 After AI and Services Growth—Or Is It a Trap?“
Impact on Sentiment of Investment.
The stock behaviour is affected by the consumer psychology significantly:
- The expectation bias is the lure that investors have to buy shares in significant supercycle periods.
- Brand loyalty helps in the support of the recurring purchases within the lines of products.
- Perceived reliability is a guarantee that investors are assured that Apple is a secure technology giant.
Two aspects that are the most undisturbed long-term investments in Apple stock include innovation and psychology, and the psychological aspects are one of the reasons that make Apple’s stock price prediction for 2026 to have more positive expectations.
Further Reading : Apple Stock Price Prediction 2030-Long-Term Growth Insights for Smart Investors!
Further Reading : Unveiling the Future: Apple Stock Price Prediction 2030 for Intelligent Investors!
Valuation Strengths Supporting Long-Term Outlook
The valuation of Apple is still at a premium, yet the premium is explained by the outstanding operational and financial performance.
Table 3. Key Drivers of Apple’s Long-Term Valuation
| Factor | Evidence from Data Charts | Impact |
| High Margins | Gross + operating margins >30% | Strong pricing power |
| Strong FCF | Nearly $100B annually | Supports buybacks & R&D |
| High RNOA | 80–95% recent years | Exceptional value creation |
| Operational Efficiency | Lean NOA growth | Scalable business model |
| Innovation Ecosystem | AI + health + services | Ensures future demand |
The combination of these valuation drivers is an indication of a promising long-term performance of Apple and, in particular, the AAPL stock forecast 2026.
Strategic Risks That May Influence 2026 Performance
There are several possible risks that the volatility of Apple stock price prediction 2026 may involve in the short term and the market sentiment that investors may consider in the long term.
Global Regulatory Pressures
The Apple store has come under scrutiny over matters touching on the policy around its App Store, payment systems, and the privacy of data. The regulatory organs are increasingly raising an ultimatum to the ecosystem in the EU, the US, and Asia, which necessitates the potential of amendments in the commission models or the mandatory transparency of the system.
Intensifying Competition
New Chinese competitors, the competition in AI hardware, cloud services, and high-end smartphones, such as Samsung, Google, and other rising competitors, are accelerating the pace of innovation.
Economic Slowdowns
Drastic changes in the global economic uncertainty, inflation, and rise of interest rates can affect consumer spending power. Apple has also been made vulnerable to the economic crises due to the premium pricing model that has seen some of its products stalled as we await the next upgrade of the iPhones, the MacBooks, and wearables.
Geopolitical Supply Chain Dangers.
Apple remains with a high degree of concentration of manufacturing centers in a small number of regions, and more so in Asia. Geopolitical strains, exportation-based prohibitions, or delays in shipping routes would impact the production timetables or increase the production costs.
Conclusion
According to the financial tendencies observed in the context of revenues, EBITDA, free cash flow, margins, RNOA, and Apple earnings forecast 2026, as well, Apple remains highly stable in the long run and can create value. Its robust cash flows, margin stability, and discipline in operations are factors that favour the growth trend of the company. Risks are present, though they do not bring about material threats to Apple’s strategic positioning and confidence among the investors.
Is Apple stock a buy or sell? Thus, the aggregate evidence is very high about the optimism of the Apple stock price prediction 2026 being not based on any speculations but on the financial strength of Apple, its pattern of innovation, and the behaviors of the finance, which always favor the company.
All calculations and valuation estimates are FinancialBeings’ own, based on data sourced from SEC filings (10K and 10Q), use or reproduction before prior approval is prohibited.
Usama Ali
Usama Ali is the founder of Financial Beings and a self-taught investor who blends classic valuation study with insights from psychology. Inspired by works from Benjamin Graham, Aswath Damodaran, Stephen Penman, Daniel Kahneman, and Morgan Housel, he shares independent, data-driven research to help readers connect money, mind, and happiness.
Disclaimer
The content provided herein is for informational purposes only and should not be construed as financial, investment, or other professional advice. It does not constitute a recommendation or an offer to buy or sell any financial instruments. The company accepts no responsibility for any loss or damage incurred as a result of reliance on the information provided. We strongly encourage consulting with a qualified financial advisor before making any investment decisions.
