

Analysis date: 5 October 2026. Financial results through June 2026; operating-volume updates through Q3 2026.
Tesla’s stock could rise by 2030 if its automotive, energy and AI businesses generate stronger earnings and investors continue to value those earnings highly. The investment question is whether that improvement will be large enough to justify the expectations already embedded in TSLA’s price.
A useful Tesla stock forecast 2030 examines profitability, capital efficiency and investment requirements alongside revenue. Profit margin and asset turnover provide a way to connect these factors. They show whether expansion earns enough on operating capital to create economic profit.
The following analysis combines updated financial evidence with valuation benchmarks and explicit operating scenarios. These scenarios describe conditions that could support different outcomes, without claiming a dependable numerical share-price prediction for 2030.
Tesla’s financial starting point
Tesla generated $103.619 billion of revenue during the twelve months ending June 2026, an increase of approximately 11.8% from the comparable trailing period. However, the latest quarterly comparison shows that higher sales did not produce higher operating profit.
| Financial measure | Q2 2025 | Q2 2026 |
| Revenue | $22.496B | $28.236B |
| GAAP operating profit | $0.923B | $0.398B |
| GAAP operating margin | 4.1% | 1.4% |
| Free cash flow | $0.146B | −$1.092B |
| Cash, equivalents and short-term investments | $36.782B | $43.524B |
Figures come from Tesla’s Q2 2026 financial update. Free cash flow represents operating cash flow less capital expenditure under Tesla’s presentation.
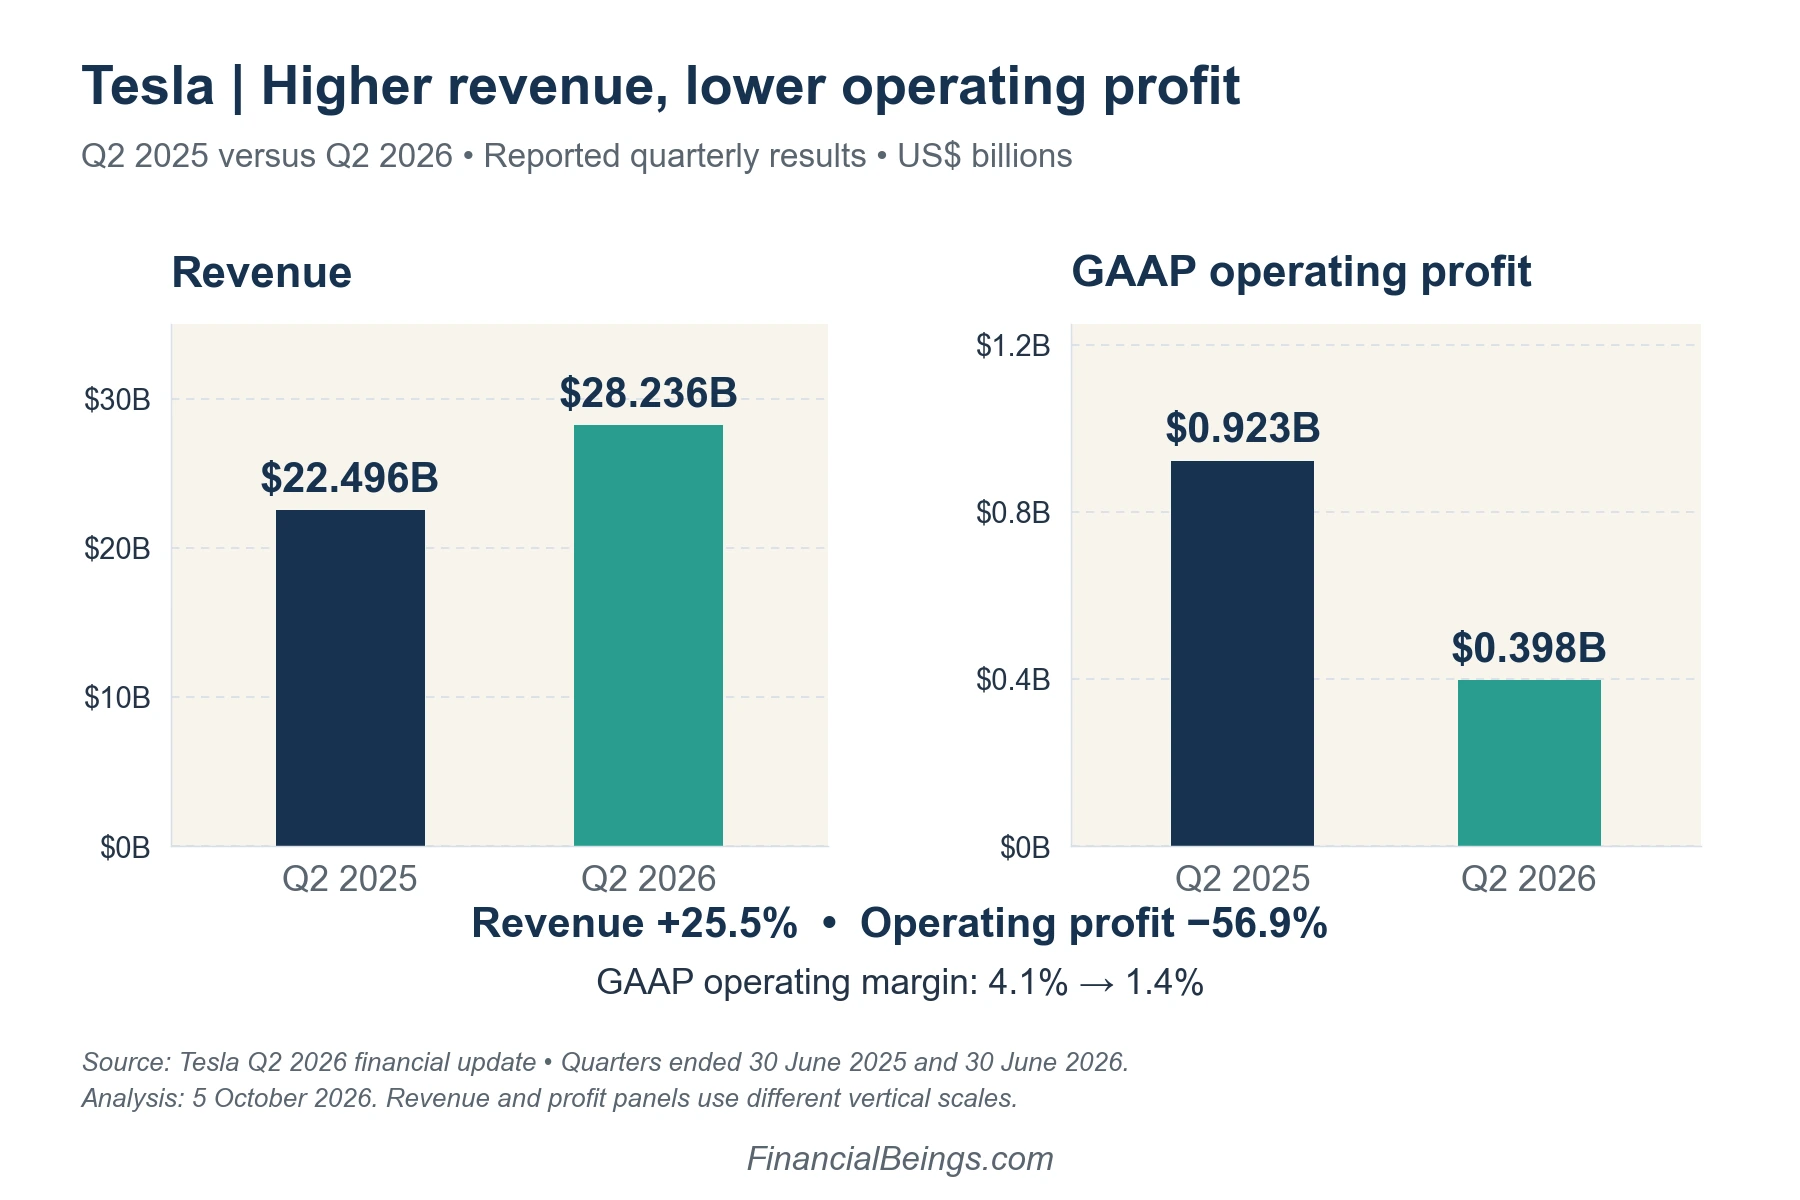
Quarterly revenue increased 25.5%, while operating profit declined 56.9%. That divergence makes margin recovery central to the longer-term outlook.
The cash balance gives Tesla resources to develop products and expand capacity. Negative free cash flow nevertheless shows that investment can consume cash before its returns become visible. Balance-sheet resources support execution, but shareholders still need to assess the price paid for future profits.
Tesla subsequently reported 486,532 deliveries and 13.7 GWh of storage deployments for Q3 2026. Its financial results were scheduled for 21 October, so these volumes should not be treated as evidence of Q3 earnings or margins. Tesla’s Q3 operating release.
What does TSLA’s valuation require?
Our analysis uses a $370.59 share-price snapshot dated 5 October 2026. This is a reference for the calculations, rather than a live market quote.
A simplified reported-profit benchmark combines approximately $1,463.66 billion of market capitalization with $29.34 billion of FY2025 net cash, producing enterprise value of $1,434.32 billion. The financing balance follows the model’s debt and lease classifications and differs from the newer cash balance above.
The benchmark uses $3.1828 billion of after-tax operating profit, calculated from rounded FY2025 reported operating profit and a 27% reported effective tax rate. The underlying financial period is documented in Tesla’s FY2025 update.
With a 10% required return, its simplified perpetual-growth calculation is:
This represents a long-run profit-growth implication under the stated convention. It is not a revenue forecast through 2030 or an estimate of the stock’s annual return.
Because the growth assumption approaches the required return, small changes can materially affect the calculated valuation. A fuller forecast must also model reinvestment, financing and dilution. The benchmark illustrates demanding expectations relative to the selected profit base; it does not establish a precise future share price.
Why profit margin and asset turnover matter
Profit margin, or PM, measures operating profit relative to revenue. In the combinations below, it means normalized after-tax operating profit divided by sales. This differs from Tesla’s company-reported, pretax GAAP operating margin.
Asset turnover, or ATO, measures revenue generated per dollar of net operating assets. Net operating assets represent operating resources after operating liabilities, rather than total assets including financing balances.
Using a consistent period and operating-capital basis:
A business can therefore improve operating returns through higher margins, greater capital efficiency, or both. Conversely, growing sales while adding proportionately more factories, inventory and other operating capital may weaken returns. or the same return-on-operating-capital lens applied to chipmakers, see our Nvidia versus AMD stock comparison.
Taxes also matter because these margins are measured after tax. An improvement in reported operating margin does not translate directly into an identical improvement in normalized after-tax margin. The comparison must retain consistent tax assumptions, operating classifications and capital measurement, particularly when evaluating different business mixes.
Financial Beings uses a 10% annual required operating return for these scenarios. That threshold is an analytical assumption, not a guaranteed shareholder return. Positive residual operating profit arises when operating earnings exceed the corresponding capital charge.
PM–ATO combinations: which cases clear the hurdle?
The selected combinations below come from the Financial Beings scenario analysis. Margins and turnover are assumptions, not reported Tesla results or predictions of their future achievement.
| After-tax PM | ATO | Implied operating return |
| 4.58% | 1.90× | 8.70% |
| 4.58% | 2.20× | 10.08% |
| 5.58% | 1.90× | 10.60% |
| 4.58% | 3.00× | 13.74% |
| 5.58% | 2.30× | 12.83% |
| 6.58% | 1.90× | 12.50% |
| 7.58% | 1.60× | 12.13% |
| 8.58% | 1.40× | 12.01% |
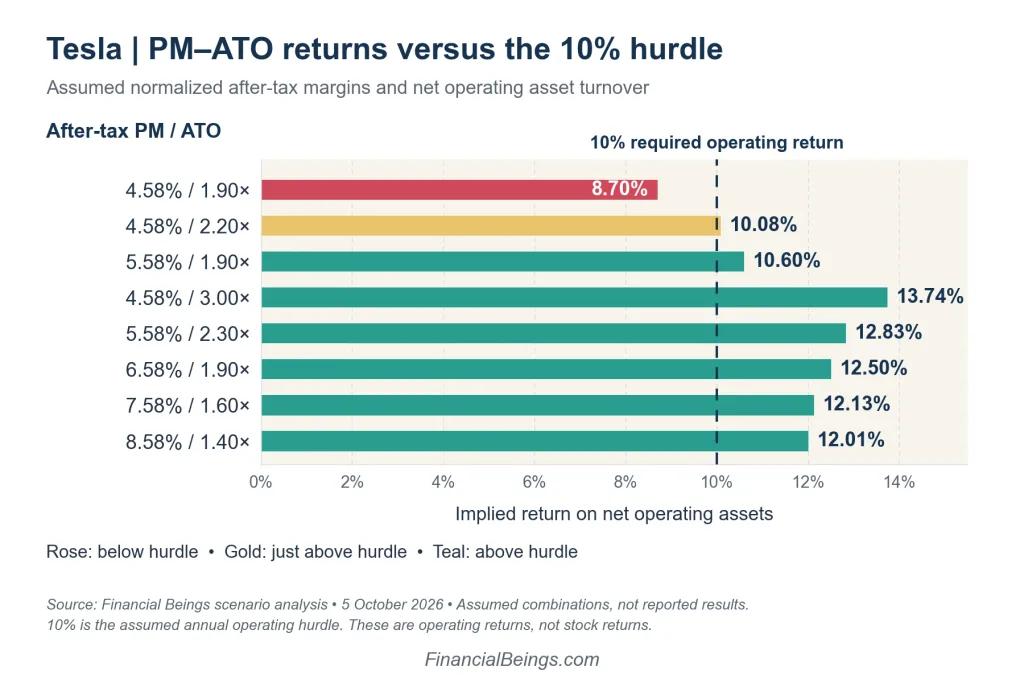
At a 4.58% margin and 1.90× turnover, the operating return remains below 10%. Increasing revenue without changing those relationships cannot produce positive residual profit under this model.
At 2.20× turnover, the same margin barely clears the hurdle. This creates little economic profit per dollar of operating capital.
The stronger combinations show different routes to improvement. A 6.58% margin works with 1.90× turnover, while a 4.58% margin requires substantially greater capital efficiency. Higher-margin operations can support acceptable returns even with lower turnover, provided those margins are sustainable.
At 1.90× turnover, the break-even after-tax margin is approximately 5.26%. Clearing this threshold begins economic-profit creation; it does not automatically justify the market valuation.
Higher turnover could reflect fuller use of existing capacity or less working capital tied up per dollar of revenue. Higher margins could reflect better pricing, lower costs or a more profitable sales mix. Each route needs evidence; the numerical combinations do not establish which operating improvements are achievable.
How much revenue would those combinations require?
To make the combinations concrete, consider an illustrative 2027 requirement of $1.47 billion in annual residual operating profit. This is a model reference requirement, not Tesla guidance or an independently validated earnings forecast.
The following table shows the required annual revenue for each combination:
| After-tax PM | ATO | Required annual revenue |
| 5.58% | 1.90× | $463.95B |
| 4.58% | 3.00× | $117.91B |
| 5.58% | 2.30× | $119.30B |
| 6.58% | 1.90× | $111.63B |
| 7.58% | 1.60× | $110.53B |
| 8.58% | 1.40× | $102.29B |
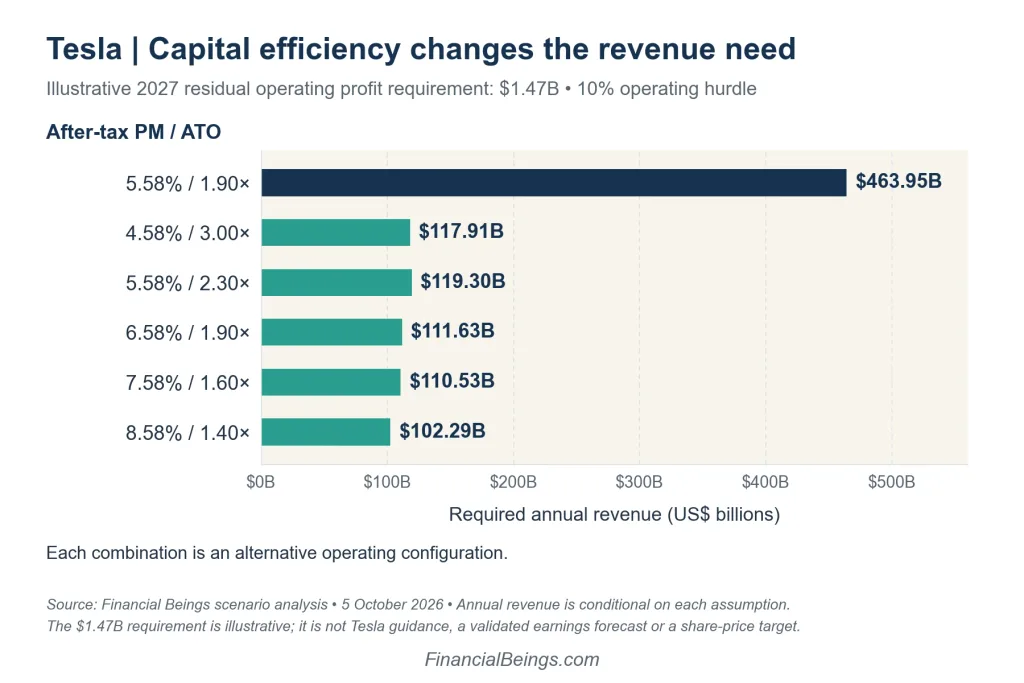
The 5.58% margin with 1.90× turnover earns only slightly above the capital requirement. Consequently, it needs much greater revenue to generate the same residual profit.
By comparison, a 6.58% margin with 1.90× turnover requires approximately $111.63 billion of revenue. That combination implies about $7.35 billion of after-tax operating profit against a $5.88 billion capital charge, leaving approximately $1.47 billion.
These are alternative operating configurations, not cumulative business values. A lower revenue requirement indicates that the specified profit target becomes easier mathematically. It does not demonstrate that Tesla can deliver the assumed margin or efficiency.
There is also no positive revenue solution for a positive residual-profit requirement when PM multiplied by ATO remains below the hurdle. In that situation, increasing scale increases the shortfall under unchanged economics. The relationships must improve before additional revenue can satisfy the specified requirement.
Operating scenarios are not 2030 price targets
A valuation needs the timing of improvement, not merely an attractive combination in one future year. A slow recovery produces a different present value from an early recovery, even if both eventually reach similar margins and turnover.
To estimate a future share price, an analyst must value the business at that future date, adjust for its expected cash and debt, and divide the resulting equity value by expected diluted shares. Discounting that value back to today produces a different measure.
The holding period must also be stated accurately. An assessment beginning in October 2026 has less than five years until the end of 2030. Future tax rates, financing needs and market valuation multiples introduce further uncertainty. Accordingly, these operating tests provide conditions for evaluating the business rather than a mechanical prediction of TSLA’s market price.
Electric vehicles: rebuilding operating profitability
Tesla’s automotive outlook depends on deliveries, selling prices, manufacturing costs and operating expenses. Strong volume growth can coexist with weak earnings if discounts or higher expenses absorb the additional revenue.
For the PM–ATO framework, automotive improvement needs either better profit retention from sales or more revenue from the operating capital already employed. Capacity utilization, inventory discipline and cost control become relevant alongside product demand.
The stronger case would involve recovering margins without requiring disproportionate investment. Investors should also distinguish recurring vehicle economics from regulatory-credit income when evaluating profit durability.
For competitive context, our BYD versus Tesla analysis examines the manufacturers using its stated reporting period.
Energy storage: growth with capital discipline
Tesla’s energy generation and storage revenue increased from $10.086 billion in FY2024 to $12.771 billion in FY2025. Tesla’s annual financial update.
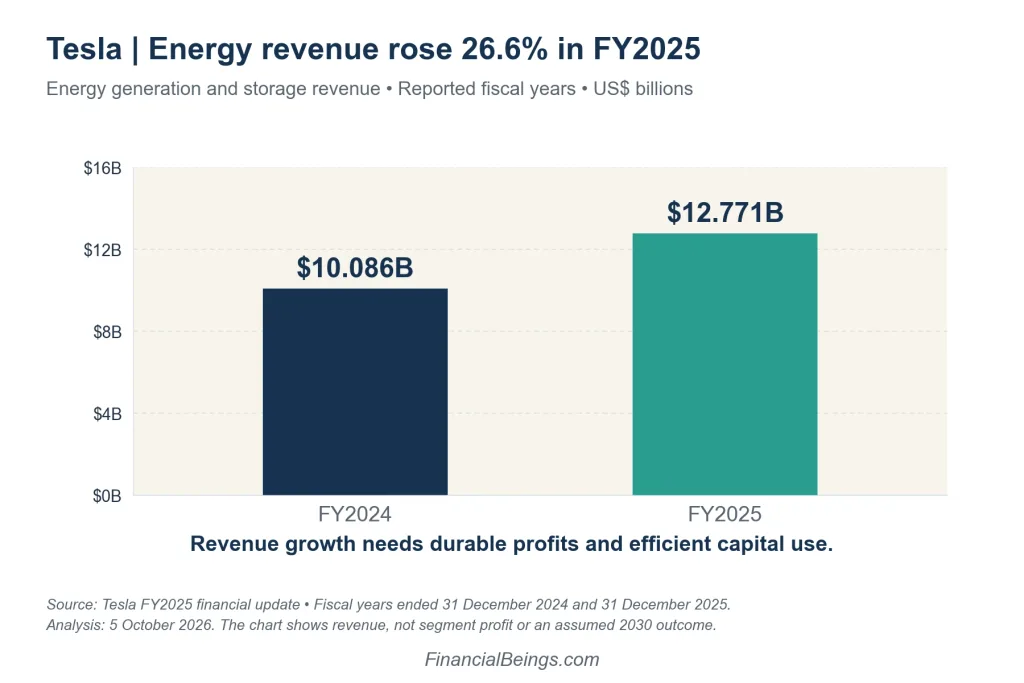
The investment case depends on how that expansion translates into profit after manufacturing, warranty and operating-capital costs. Additional deployments create value when their earnings justify the resources required to deliver them.
Energy could strengthen Tesla’s consolidated economics if it contributes durable margins and efficient capital use. Assuming that it will rival automotive revenue by 2030, however, requires explicit evidence and forecasts. Deployment volumes alone cannot establish that outcome.
AI and robotaxis: monetization needs measurement
AI services could improve Tesla’s profit mix if recurring customer payments exceed development, infrastructure and service costs. The financial evidence should include paid adoption, revenue retention and operating contribution.
FSD (Supervised) requires active driver supervision and does not make a vehicle autonomous. Its commercial and regulatory position must be assessed separately from unsupervised robotaxi operations. Tesla’s FSD documentation.
A robotaxi forecast also needs fleet-utilization assumptions, revenue per vehicle, insurance, maintenance and replacement investment. A company-owned fleet can require substantial operating capital, so attractive gross revenue does not necessarily imply high asset turnover.
AI can strengthen the growth case if monetization improves consolidated margins and returns after investment. Assigning it a separate valuation without checking whether its earnings already appear in the overall forecast could count the same opportunity twice.
Conservative, base and growth outcomes through 2030
Conservative case: expansion earns inadequate returns
In a weaker outcome, vehicle margins remain pressured, energy profits disappoint and AI commercialization requires more time and capital. PM–ATO combinations remain near or below the required return.
Revenue might still rise, but economic profit could stay limited. Investors could then apply a lower valuation to the expected earnings, creating downside risk despite operational growth.
Base case: gradual financial improvement
The middle scenario assumes recovering automotive profitability, a larger energy contribution and developing software revenue alongside continued investment.
Operating returns improve, but the starting share price remains important. Achieving a healthier business does not guarantee an attractive investment return when substantial improvement is already anticipated. Progress should be assessed through margins, cash generation and capital efficiency.
Growth case: sustained profit and efficiency gains
The stronger outcome combines improved vehicle economics, profitable energy expansion and meaningful recurring AI earnings. PM–ATO relationships move comfortably above the required return, producing larger residual profits.
Supporting a higher share price would also depend on reinvestment needs, diluted shares and the valuation investors apply in 2030. This scenario describes financial conditions, without assigning an unsupported numerical target.
What investors should monitor next
The most useful checkpoints are operating-margin recovery, cash flow after investment, operating-capital growth and evidence of profitable commercialization.
For each release, ask whether additional sales produce additional profit and whether that profit adequately compensates for the capital employed. Compare annual measures with annual measures, and quarterly margins with comparable quarterly margins.
Also monitor dilution and changes in financing balances. Shareholders participate in earnings per share, so growth in total business profit can be diluted by a larger share count.
Our Tesla versus Ford analysis provides another perspective on profitability, capital requirements and valuation.
Tesla’s 2030 outlook
Tesla has several possible routes to stronger earnings. The PM–ATO combinations clarify the financial requirements: better margins, more efficient capital use, or a combination that produces sufficient profit above the capital charge.
The current evidence supports careful monitoring rather than a certain price prediction. A stronger investment case would emerge from sustained operating improvement, supported by cash generation and evaluated against the expectations already reflected in TSLA’s valuation.
Usama Ali
Usama Ali is the founder of Financial Beings and a self-taught investor who blends classic valuation study with insights from psychology. Inspired by works from Benjamin Graham, Aswath Damodaran, Stephen Penman, Daniel Kahneman, and Morgan Housel, he shares independent, data-driven research to help readers connect money, mind, and happiness.
Disclaimer
The content provided herein is for informational purposes only and should not be construed as financial, investment, or other professional advice. It does not constitute a recommendation or an offer to buy or sell any financial instruments. The company accepts no responsibility for any loss or damage incurred as a result of reliance on the information provided. We strongly encourage consulting with a qualified financial advisor before making any investment decisions.