
Introduction
The 2025 Earnings Summary for Occidental Petroleum Stock (OXY) contains Q4 and full year financial breakdown alongside information about profitability metrics and debt reduction along with dividend growth projections. Read more!
Occidental Petroleum Corporation (NYSE: OXY) is a leading independent energy producer in the US, operating in exploration, production, chemical manufacturing, and petroleum distribution services. With a century of operation since 1920, the company has guided the global oil and gas industry, adjusting to industry changes and maintaining a dominant market position. Occidental emphasizes carbon management, enhanced oil recovery, and sustainability practices, becoming a leader in developing a lower-carbon future. The company operates in three essential areas: oil and gas exploitation, chemical manufacturing, and midstream handling with marketing responsibilities. Its multiple revenue streams ensure market adaptability and maintains a steady cash flow system.
An extensive financial performance blogpost ‘Occidental Petroleum Stock (OXY) Earnings Summary for 2025’ shows detailed information on revenue segments alongside profitability ratios and investor market sentiment metrics. Investors who want to gauge OXY’s market potential moving forward need complete knowledge about its 2024 performance together with its financial results from the past three years because of changing market conditions and unpredictable energy prices.
An analysis of Occidental Petroleum Stock (OXY) segment revenues, debt performance, dividend changes and valuation metrics determines the suitability of owning OXY Stock. Let’s dive in!
Financial Analysis for OXY
Revenue and Earnings Growth
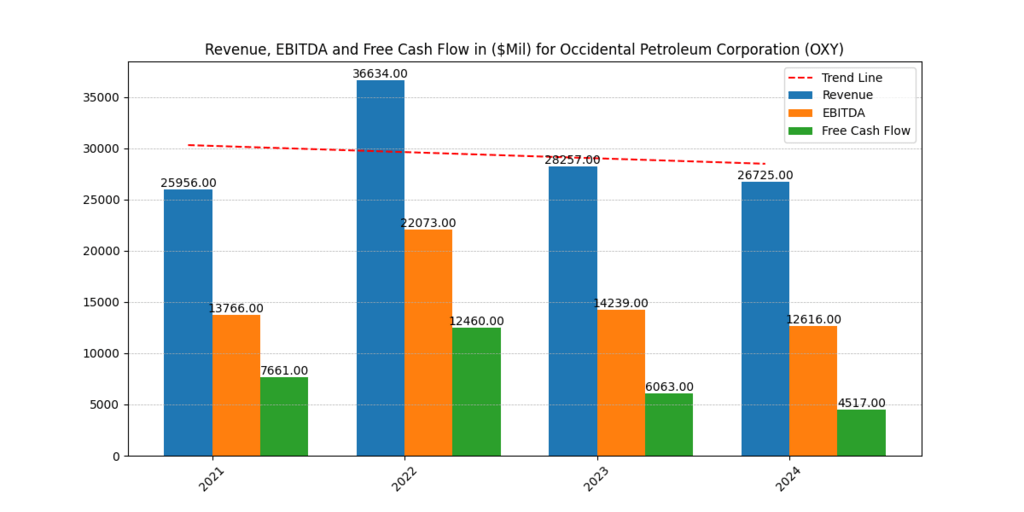
Total revenue for Occidental Petroleum (OXY) reached $26.73 billion during 2024, which demonstrated a 5.4% decrease from $28.26 billion in 2023. Oil prices dipped and regional production reduced to cause the revenue decrease at Occidental Petroleum although operational efficiencies remained strong. The core division of oil and gas operations generated the highest revenue at Occidental Petroleum followed by chemical and midstream functions. Total EBITDA reached $12.62 billion while experiencing an 11.4% decrease from the $14.24 billion recorded in 2023. This indicates profitability reductions.
The revenue decline did not stop Occidental from outperforming production targets alongside robust cash flow generation, which demonstrated their capability to maintain success throughout market instability. OXY generated adequate profitability through its gross margin of 35.73% as well as its operating margin of 20.93% although weaker commodity prices led to compressed profits. The company survived the downturn because it implemented strategic divestitures and cost-control measures, which supported its financial stability. [3]
Profitability Margins for OXY
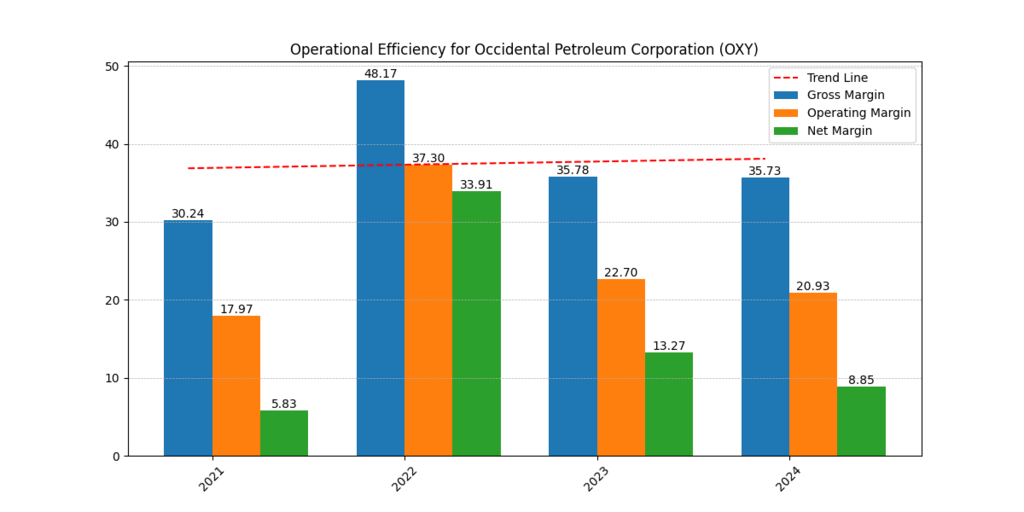
The 2024 profitability figures of OXY proved lower than before because of severe market fluctuations affecting the energy sector. Production together with cost management remained steady based on the margin comparison between 2024 and 2023 which indicated a rate of 35.73% and 35.78%. The operating margin decreased significantly in 2024 to reach 20.93% from its previous level at 35.78% in 2023 due to increased operating costs and diminished pricing abilities. A decline occurred in net margin to 8.84% margin from its previous value of 13.27% mainly due to reduced revenue growth and additional interest expenses.
Profitability experienced declines because low crude oil prices and inflationary forces affected the business performance. Occidental’s cost efficiency programs together with its efforts to streamline operations and reduce debt levels allowed the company to absorb the negative effects of margin compression. Despite facing ongoing industry challenges, the company successfully retains double-digit profitability levels which strengthens its capacity to adapt within the evolving energy sector.
Return on Equity (ROE) and Return on Capital (ROTC)
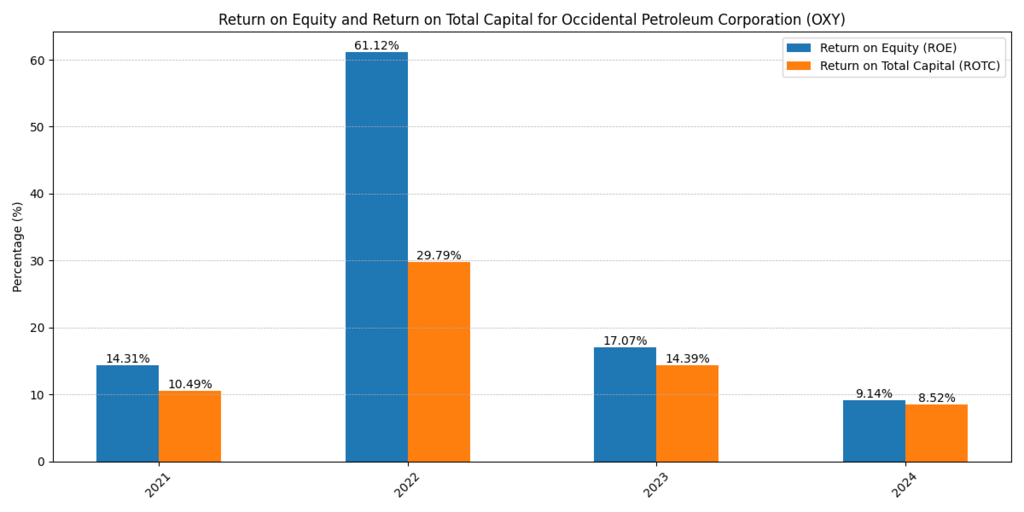
OXY faced a substantial decrease in its Return on Equity (ROE) ratio which dropped to 9.14% during 2024 despite reaching 17.07% in 2023 leading to both reduced net earnings and reduced shareholder returns. The decline occurred because of decreased oil prices coupled with increasing interest expenses and reduced revenue expansion. Capital efficiency decreased substantially when Return on Total Capital dropped to 8.52% from 14.37% during the 2023-2024 period.
This data shows that OXY delivered decreased returns for every dollar invested in both equity and capital assets so investors face diminished benefits from capital deployment. The company’s debt repayment and asset optimization strategies might enhance these financial performance figures throughout the upcoming years. Despite falling figures in ROE and ROTC, the company maintains disciplined financial management and strategic investments in carbon capture and enhanced oil recovery technologies (EOR) that could propel future business expansion and optimize capital performance. [2]
Debt and Cash Flow Management
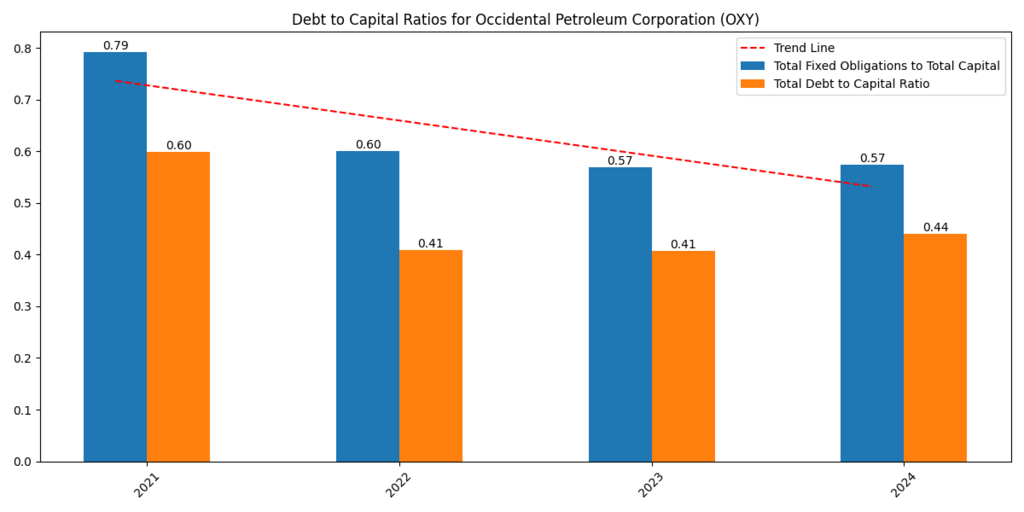
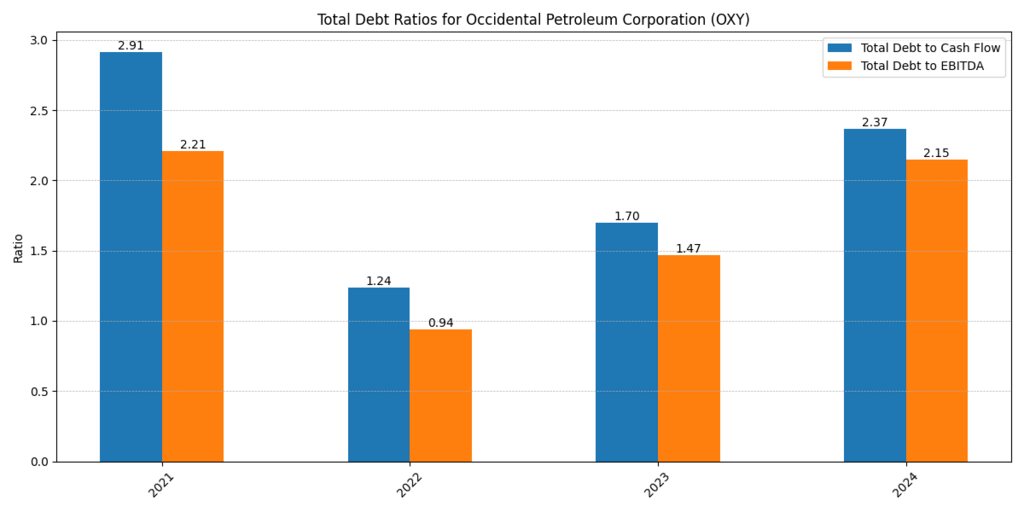
The company successfully finished its $4.5 billion rapid debt reduction goal while remaining committed to debt reduction. OXY experienced a marked increase in Total Debt to EBITDA ratio between 2023 and 2024 from 1.47 to 2.15 because the company encountered weaker earnings accompanied by greater debt load. Total Debt to Cash Flow rose to 2.37 in 2024 after showing a lower ratio of 1.70 in 2023 thus suggesting Oxy’s debt position grew compared to operating cash flow. The debt ratios at OXY were increasing but the company managed to maintain strong cash flow liquidity through its $3.6 billion operating cash flow generation.
Free Cash Flow (FCF) generated $1.4 billion before factoring in working capital fluctuations thus letting the company allocate $1.8 billion for capital expenditures alongside shareholder distribution. Due to the ongoing portfolio optimization program OXY plans to divest $1.2 billion during Q1 2025 to decrease leverage as this will help stabilize its financial position despite energy price variations. Find out the comparison between Energy Sector Giant Exxon Mobil vs. Occidental Petroleum.
Comparison table of Occidental Petroleum (OXY) with ExxonMobil (XOM) and Energy Transfer (ET)
| Metric | OXY | ET | XOM | Average |
| Asset Turnover | 0.31 | 0.66 | 0.75 | 0.57 |
| Return on Sales (%) | 8.84 | 5.32 | 9.93 | 8.03 |
| Return on Assets (ROA) (%) | 2.77 | 3.5 | 7.43 | 4.57 |
| Financial Leverage | 2.48 | 2.7 | 1.68 | 2.29 |
| Return on Equity (ROE) (%) | 6.85 | 9.46 | 12.45 | 9.59 |
| Return on Total Capital (ROTC) (%) | 8.52 | 9.56 | 15.64 | 11.24 |
| Return on Capital (ROC) (%) | 1.49 | -0.21 | 5.32 | 2.20 |
| Price-to-Earnings (PE) Ratio | 22.84 | 15.45 | 14.21 | 17.50 |
| Enterprise Value (Millions $) | 75,554 | 128,410 | 531,621 | 245,195 |
| EBITDA (Millions $) | 12,616 | 15,396 | 73,311 | 33,774 |
| EV/EBITDA Ratio | 5.99 | 8.34 | 7.25 | 7.19 |
| Equity Ratio (%) | 55.99 | 43.4 | 84.85 | 61.41 |
| Free Cash Flow to Equity (FCFE) (Millions $) | 23,459 | 20,411 | 79,077 | 40,982 |
| Free Cash Flow to Firm (FCFF) (Millions $) | 18,828 | 18,438 | 86,480 | 41,248 |
| Gross Margin (%) | 35.73 | 18.79 | 22.62 | 25.71 |
| Operating Margin (%) | 20.93 | 11.12 | 11.69 | 14.58 |
| Net Margin (%) | 8.84 | 5.32 | 9.93 | 8.03 |
The higher price-to-earnings (PE) ratio of 22.84 makes Occidental Petroleum (OXY) relatively more costly compared to ExxonMobil (14.21) and Energy Transfer (15.45). The company has achieved a notable gross margin of 35.73% which indicates it maintains excellent control over costs and operates with high efficiency. The company shows moderate profitability by maintaining a net margin of 8.84% though it falls slightly below XOM at 9.93% while surpassing ET at 5.32%. OXY shows poor capital utilization efficiency through its 1.49% return on capital when compared to XOM’s superior 5.32% ROC.
The ratio of debt to equity at OXY stands at 2.48 while XOM displays 1.68 and ET shows 2.7 which demonstrates OXY has higher debt compared to ExxonMobil but remains steadier than Energy Transfer. OXY offers financial flexibility to investors through its strong free cash flow to equity worth $23.46 billion which allows continued dividend payments along with buying back shares because of its attractive nature to long-term investors. [2]
Occidental Petroleum’s Recent Developments
| Project/Initiative | Description | Details |
| Predictive Maintenance Using AI | Occidental employs artificial intelligence to enhance predictive maintenance, aiming to reduce unplanned events and optimize operations. | By analyzing historical data, AI models predict equipment performance, enabling proactive maintenance and minimizing downtime. |
| Exploration and Production Optimization | Utilizing machine learning algorithms to analyze geological data for more accurate drilling locations. | Integrating AI with geological models enhances understanding of subsurface formations, leading to more successful drilling outcomes. |
| Carbon Capture Initiatives | Development of large-scale carbon capture, utilization, and storage (CCUS) projects to reduce CO₂ emissions. | Occidental is building a fleet of plants that extract CO₂ directly from the air, with plans to sell carbon credits to companies like Microsoft. |
| Digital Transformation | Migration to cloud infrastructure to enhance operational efficiency and scalability. | Moving to the cloud allows for rapid experimentation with new technologies, including AI and machine learning, improving overall operations. |
| Permian Basin Expansion | Targeting deeper formations in the Permian Basin to increase production. | Focusing on secondary benches, including deeper Wolfcamp zones, to enhance production and efficiency. |
| Debt Reduction and Divestitures | Achieved debt repayment target and announced asset divestitures to strengthen financial position. | Reached a $4.5 billion debt repayment goal and plans to divest assets worth $1.2 billion in the first quarter of 2025. [1] |
Conclusion
The industry leadership position of Occidental Petroleum (OXY) exists through its strong financial outcomes along with artificial intelligence-driven industrial innovations and its carbon capture sustainability programs. The company’s positive financial stability originates from efficient operations alongside robust free cash flow generation despite its premium stock value at current PE ratio levels. Performance statistics at OXY surpass ExxonMobil (XOM) and Energy Transfer (ET) yet the company reveals typical ROC results and requires better control of its leverage metrics.
OXY holds positive long-term growth potential because management chose to invest in AI predictive maintenance systems and exploration initiatives and extensive carbon capture programs. Investors establish the company’s appeal based on their assessment of protective measures and financial debts along with market capitalization assessment and evaluation of the potential industrial shift in the energy sector.
**Please be informed that the content is informational and by no means serve as a buy or sell signal. The company is not responsible for the loss of capital.