Microsoft expected return analysis 2026-2030 is an analysis of MSFT valuation, market-implied growth, and expected returns for growth, balanced, and conservative portfolios.
Introduction
This Microsoft expected returns analysis 2026 to 2030 is founded on one question: how much growth performance should Microsoft deliver in order to realize attractive long-term returns on the price today? Instead of developing a story behind headlines, the analysis will start with the sensitivity of valuation and then test the operating performance (RNOA, NOA, and operating leverage) to understand whether the growth in the market price is being sustained. This is the strategy that aligns with defining risk as Microsoft does it, to predict future outcomes, they always concentrate on performance, time spent on investment, and those uncertainties that they disclose in the SEC reports (Microsoft, 2025).
To ensure that the valuation assumptions are economically plausible, the analysis then evaluates the consistency of the denoted valuation assumptions on the growth in the market price via the Microsoft stock valuation 2030, that is, Return on Net Operating Assets (RNOA), Net Operating Assets (NOA), and operating leverage and current market implied growth. These measures can be utilized to assess the speed with which Microsoft will be able to expand, as well as the degree to which Microsoft will be able to convert growth into economic value, which is of significance to investors.
Where MSFT fits — Growth, Balanced, and Conservative Portfolios

Figure 1: MSFT Investment Strategy Guide.
Based on growth-sensitivity valuation, it has a clear line of division: it would be as follows: ~5-5.3% long-term growth has the intrinsic value, the current market price completely covered. Portfolio suitability is then relaxed. The intrinsic value being less than the price will cause the returns to compress and the stock will become a priced-for-perfection story; when the intrinsic value is larger than the price, then expected returns are more compelling, and risk-reward is improved.
Growth Portfolio – BUY
Valuation sensitivity is something that can tolerate in a growth portfolio, as long as the upside is backed by execution, rather than speculation. On the upside thesis of the valuation chart (7-8% long-term growth), the intrinsic value of Microsoft increases evidently over the prevailing market price, and anticipated returns are favorable (approximately, 10.0-11.0%). This will produce a desirable MSFT risk-reward analysis profile: gains are independent of additional multiple growth, but instead of the business growing to continue to compound and the valuation to gradually converge with that growth.
Why MSFT can fit here:
- This is the case with Microsoft since its long-term plan revolves around scalable cloud services and AI-driven productivity and infrastructure, which the management brands as long-term growth engines instead of temporary opportunities.
- Meanwhile, the company recognizes that heavy investment cycles (like data centers, platform development, and engineering) may strain margins in the short-term and position the company better in the long-term competition (Microsoft, 2025). It is a trade-off that growth investors must be ready to take.
Microsoft stock for a growth portfolio has a good expected payoff when sustained high growth (7-8%), and is willing to accept that valuation is sensitive to Microsoft long-term growth assumptions. This is the best case of Buy condition in this Microsoft expected returns analysis 2026-2030.
Balanced Portfolio -HOLD / POSITION SIZING
Even in a good but not perfect future, a portfolio balanced enough needs to have enough returns. As in the structural case (5-6% growth), projected returns revert to normal, approximately between 8.25%-9.16%, and the valuation line is close to fair value. It suggests “hold” as compared to chase.
At this level, MSFT balanced portfolio position sizing would be the major decision-making tool. As the intrinsic value is close to the price, the outcome of the returns is figured out by:
- Whether Microsoft can sustain structural growth of approximately 6 percent in comparison with trending towards more GDP-like growth,
- Whether the reinvestment still produces high operating returns rather than diluting them down,
- And the operating leverage and capital intensity are put in check.
Microsoft can be owned as a part of a balanced portfolio, but must be sized as a “fairly priced compounder”, rather than a deep-value opportunity. In other words, in this analysis of the MSFT expected returns, the balanced position will be Hold, control position size, and dislocations, not enthusiasm.
Conservative Portfolio – AVOID
In the case of conservative portfolios, margin of safety is the most important: the price must be sustained even in the case of subdued growth. The intrinsic value is far below the market price in the range of 2-3 per cent growth (GDP range), and the expected returns are compressing (~5.51 per cent -6.42 per cent). This is not bad, in an absolute sense, but it is unpleasant compared to the risk that the market is already getting more robust results.
This is the most definite answer to the question of Is Microsoft stock overvalued or undervalued going through 2026?
- Under GDP-like assumptions of growth, it appears overvalued (price exceeds intrinsic value).
- It appears fair in the case of 5-6% growth in structure.
- Under 7-8% growth- The company appears to be undervalued in relation to intrinsic value.
This is why conservative portfolios, which are not supposed to pay to get the best-case growth experience, should, in general, not engage with MSFT at such a valuation level, according to this MSFT expected return analysis 2026-2030.
MSFT 2030 valuation scenarios: MSFT growth sensitivity analysis and market-implied growth
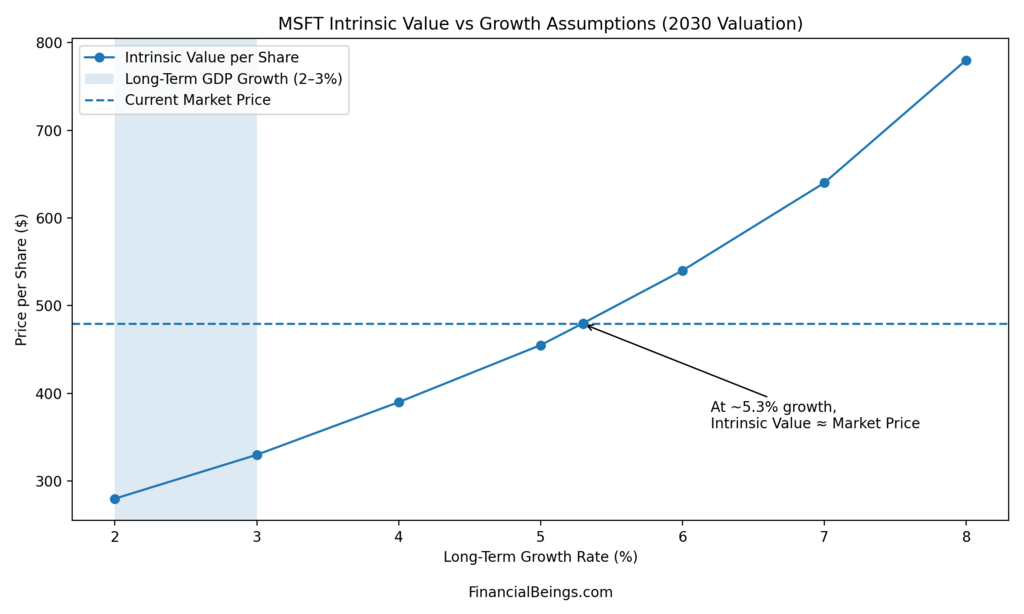
Figure 2: MSFT Intrinsic Value vs Growth Assumptions (2030 Valuation)
The Microsoft intrinsic value per share grows at a rapid rate, as long-term growth increases, and the curve crosses the market price line at approximately 5 -5.3%. This is literally the MSFT market-implied growth region: the price in the market seems to be pricing out a growth path that is significantly more than GDP, but not an extreme growth path.
Table 1:Expected Return Analysis Summary
| Long-term growth assumption | Expected return per annum | What it means for valuation support |
| 2–3% (GDP range) | ~5.51%–6.42% | Intrinsic value below price; expected returns compress; low margin of safety |
| 5–6% (structural case) | ~8.25%–9.16% | Intrinsic value aligns with price around ~5–5.3%; 6% begins to create support |
| 7–8% (upside case) | ~10.0%–11.0% | Intrinsic value above price; stronger valuation support; upside asymmetry |
Key insight: Microsoft does not need the extreme growth to be justified by the current price, but an improved, sustained growth would have a significant positive impact on the expected returns and would cause upside asymmetry. This one relationship is the backbone of the MSFT expected return outlook for 2026-2030.
Why the operating charts matter: turning growth into value
Valuation sensitivity cannot stand independently since the business will not be able to convert growth into economic profit. This is the reason that the next step of this Microsoft expected return analysis 2026-2030 will be testing the operating engine:
- NOA vs Operating Liabilities is used to show the direction and amount of reinvestment and operating balance-sheet arrangement.
- OLLEV shows the level of operating leverage (i.e., operating assets are being funded by operating liabilities).
- RNOA gives a view of whether Microsoft is reaping good returns on the capital invested in the operations or not.
The combination results in a direct result of a Microsoft residual income valuation lens: value is generated when the operating returns are strong relative to the required return, as the firm must reinvest. These operating measures are especially relevant, as it is mentioned in the filings of Microsoft that the margins and returns of such operating metrics can be affected in Microsoft long-term return expectations due to the constant platform investment and operating environment (SEC, 2025).
NOA vs Operating Liabilities: reinvestment scale and balance-sheet structure
MSFT -NOA vs Operating Liabilities indicates two significant facts:
- The Net Operating Assets (NOA) expand in the later years of the series, and this is a period that shows increased reinvestment and building up of the operating assets.
- There is also an increase in the operating liabilities, but NOA is growing at a higher rate in the latest period, indicating that Microsoft is increasing its operational capacity and investment capabilities, rather than it is funding the operations using operating liabilities alone.
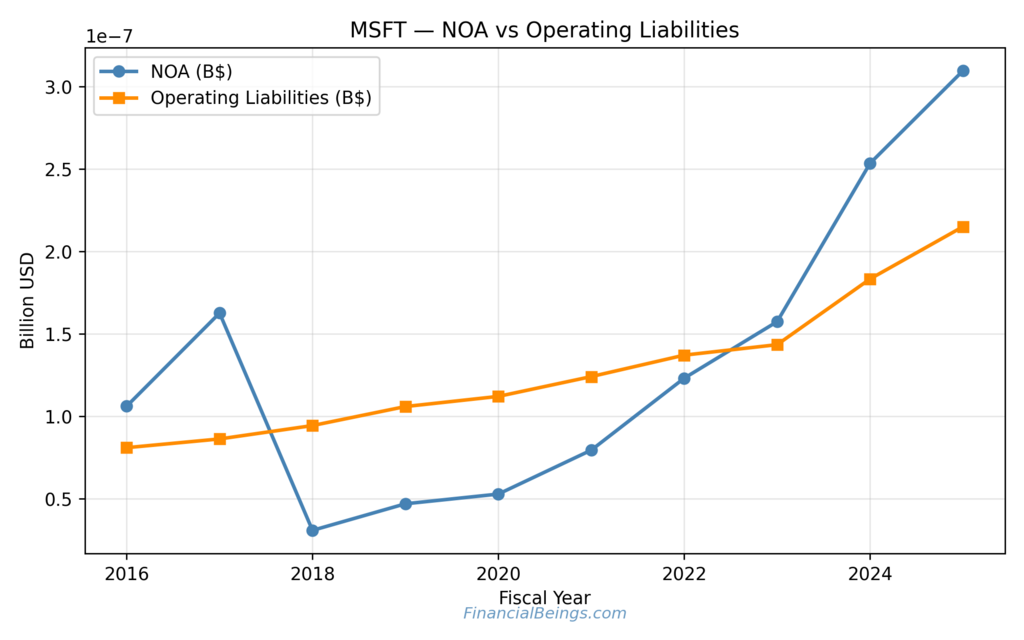
Figure 3: MSFT – NOA, Operating Liabilities.
The Microsoft long-term return expectation interpretation:
- An increase in NOA is a common indication of an investing cycle (data centers, product development, expansion of platforms).
- That will justify more development projections (the structural and the upside cases), but it will increase the execution bar: the company increasingly needs to make good returns on the expanded operating base.
Microsoft highlights that the results are dependent on further investment and the competitive environment, which is valid in the fact that reinvestment is a first necessity, but it is not a risk-free matter (Microsoft.n.d.).
OLLEV: Operating leverage is moderating, which changes the risk profile
MSFT – Operating Liability Leverage (OLLEV) demonstrates an acute peak at the beginning of the time frame, after which the values decrease to more reasonable proportions. The simple story is: Microsoft has been using operating liabilities as leverage on operating assets, but this ratio has declined.
The rationale behind that to the MSFT valuation under different growth rates:
- High OLLEV means that operating returns are amplified, although the business is more sensitive to the working-capital areas and operating cycle changes.
- OLLEV is more conservative when OLLEV is negative; this can mitigate the possibility of the so-called hidden leverage risk, yet can also mitigate the mechanical enhancement of returns.
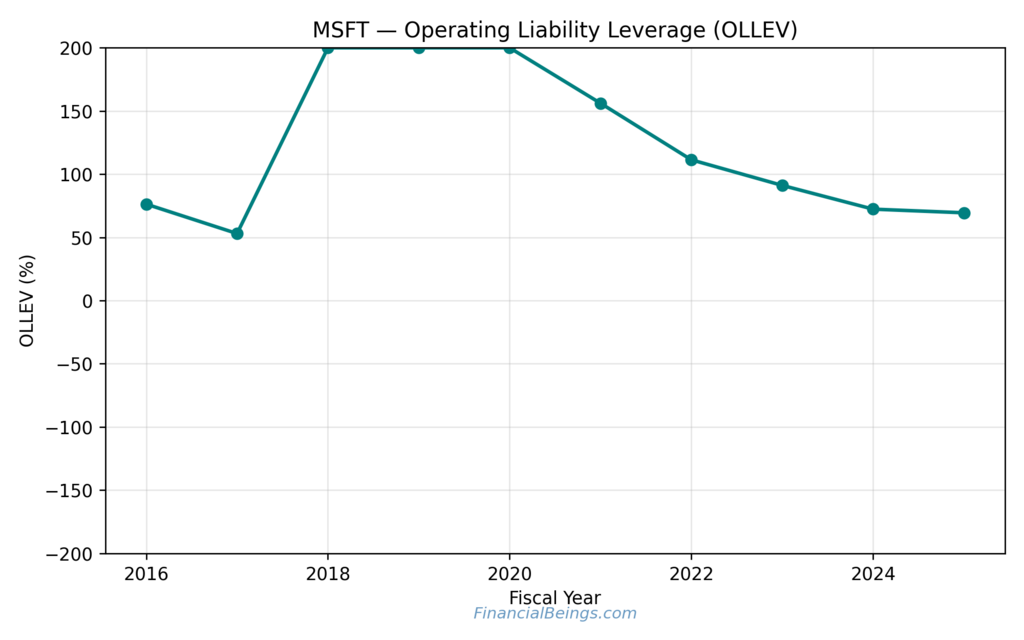
Figure 4: MSFT-Operating Liability Leverage (OLLEV).
Thus, it is possible to view OLLEV moderation as a stabilizing power of MSFT risk-reward analysis. It supports the balanced-case opinion: Microsoft can compound, but at a lower degree in terms of leverage effects and at a higher level in terms of real operating profitability and growth execution.
RNOA: peak, normalization, and what it implies for growth assumptions
The Return on Net Operating Assets (RNOA) shows that its peak has been drastic, with a normalization following it at quite strong rates. It is not the peak itself that is the valuable understanding: it is what follows:
- The normalized yet healthy profile of RNOA means that Microsoft is yet to be reinvested in, but it remains a high-paying venture.
- On the other hand, normalization can also be used to signify that as the operating base grows, high returns become increasingly harder to sustain, that is to say that growth must be both durable and high quality.
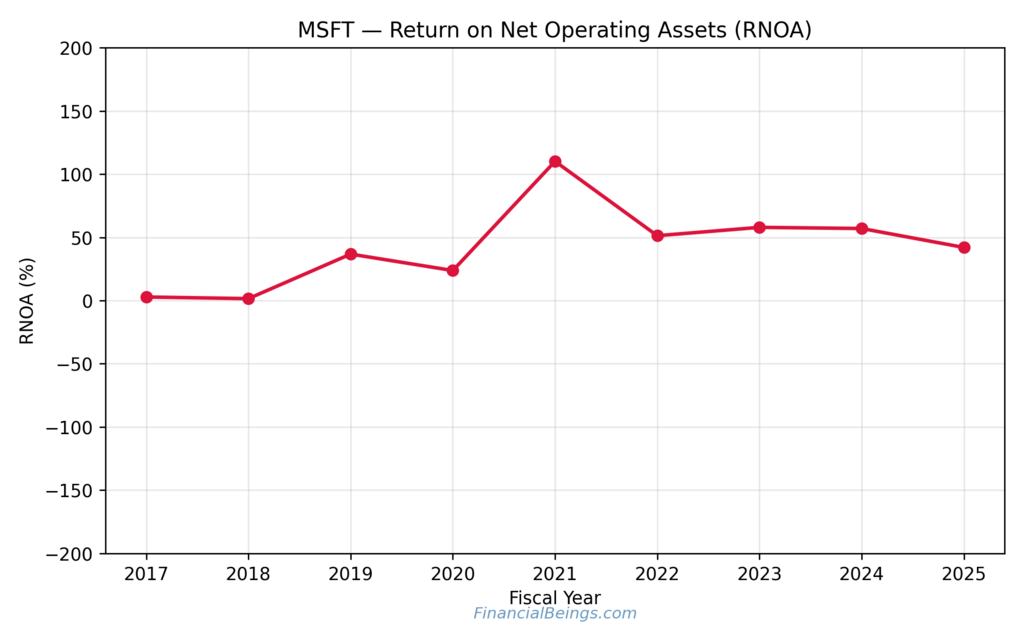
Figure 5 MSFT — Return on Net Operating Assets (RNOA).
MSFT vs CRM Stock: Which Tech Giant Offers Safer Growth in 2026?
Top 5 AI Companies 2025: A Comparative Study of NVDA, MSFT, GOOGL, META, and AVGO
MSFT Stock After Q1 2026: Evaluating Growth, Valuation, and Future Profitability Drivers
MSFT growth vs GDP comparison: why 2–3% changes the whole story
The GDP range (2 -3 percent) is greater than a conservative estimate – it is a stress test. In the case of the expansion of Microsoft and the economy in general, the valuation becomes false: intrinsic value is much lower than the price, and the approach to the expected returns.
The significance of this is that it clarifies what investors are actually buying:
- Not Microsoft as a stable blue chip in the older conventional sense of that term,
- but Microsoft is a structural grower, which does not cross GDP in the long run.
The strategy employed by Microsoft and the risk factors that can influence its further development are structural and not cyclical, which is explained in the annual report and the Form 10-K (Microsoft.n.d.).
Conclusion:
This Microsoft expected return analysis 2026-2030 brings to a disciplined, scenario-driven conclusion:
- In case Microsoft could revert to 7-8% long-term growth, the share has attractive expected returns, which should be incorporated into growth portfolios.
- In case Underwrite 5-6% structural growth, Microsoft should be in balance portfolio position sizing since the valuation support is there but not high.
- If the base case is 2-3% GDP-like growth, MSFT would not be suitable in a conservative portfolio, as the valuation would be stretched and the margin of safety would be thin.
Concisely, Microsoft does not require extreme results in order to justify the current price, but it demands consistent growth of above GDP and operating quality to achieve the best results. This is the main message of the Microsoft expected return 2026.
Freqently Asked Questions (FAQs)
What growth rate is implied in Microsoft’s expected return analysis for 2026–2030?
The current market price implies a long-term growth rate of about 5-6%, where the intrinsic value equals the market value. Growth above this level is what increases the anticipated returns and vice versa.
What are Microsoft’s expected returns under different growth assumptions?
The projected returns are 5.51 to 6.42% at a growth of 2-3%. At 5-6 percent growth, the expected returns increase in the range of 8.25-9.16 percent. We have expected returns of 7-8 percent growth, which increases to an even greater amount of 10-11%.
Which portfolios benefit most from Microsoft based on expected returns?
Microsoft is most appealing to long-term high growth portfolios, the balanced portfolios can also enjoy the stable returns, and is less attractive for conservative portfolios that require significant margin of safety.
All calculations and valuation estimates are FinancialBeings’ own, based on data sourced from SEC filings MSFT (10K and 10Q) use or reproduction before prior approval is prohibited.
Usama Ali
Usama Ali is the founder of Financial Beings and a self-taught investor who blends classic valuation study with insights from psychology. Inspired by works from Benjamin Graham, Aswath Damodaran, Stephen Penman, Daniel Kahneman, and Morgan Housel, he shares independent, data-driven research to help readers connect money, mind, and happiness.
Disclaimer
The content provided herein is for informational purposes only and should not be construed as financial, investment, or other professional advice. It does not constitute a recommendation or an offer to buy or sell any financial instruments. The company accepts no responsibility for any loss or damage incurred as a result of reliance on the information provided. We strongly encourage consulting with a qualified financial advisor before making any investment decisions.