LLY vs ABBV vs AMGN 2026 : residual earnings valuation, dividend quality and pipeline strength decide which pharma stock is the best buy.
Introduction
By 2026, the LLY, ABBV, and AMGN investment case will be in the middle of a significant change in the healthcare industry. Amgen (AMGN) is positioning itself with asset biosimilars and rare-disease medications, Eli Lilly (LLY) is dominating the rapidly expanding GLP-1 market with its portfolio of obesity and diabetes therapies, and AbbVie (ABBV) is handling the post-Humira transition with innovative immunology development drivers. To long-term investors, making a decision between these three is not merely one of picking out a Pharma stock- it is a decision of picking out the appropriate strategy in a dynamic industry environment.
A company is a unique investment profile. The growth stock is LLY, which is supported by a high demand of Mounjaro and Zepbound, as well as a very high total addressable market in treating obesity. ABBV is the income stock, which is driven by its status as a Dividend Aristocrat and stable cash flow, despite losing Humira revenues to Skyrizi and Rinvoq. AMGN is also not a value stock, but has less aggressive growth implied in its current market price and a balanced business.
This article analyzes each of the three through a unified structure: residual earnings valuation to determine how much growth has already been priced into the stock, and dividend quality scoring to evaluate income sustainability and ability to generate capital returns. This strategy emphasises that the investors should pay for the stock based on the current performance rather than optimistic expectations.
Amgen (AMGN) is the best buy of the year 2026 among these three stocks since it has the least aggressive growth assumptions in the long term and yet provides good fundamentals.
| Metric | LLY | ABBV | AMGN |
| Investment profile | Growth | Income | Value |
| Market cap | $794.4B | $377.6B | $188.3B |
| 52-week return (price only) | +3.04% | +4.00% | +13.66% |
| 1-year total return (dividend-adjusted) | +3.80% | +7.49% | +17.22% |
| 3-year total return (dividend-adjusted) | +168.36% | +48.14% | +61.83% |
| Market-implied growth rate | 9.06% | 8.51% | 7.33% |
| Current price ($/share) | $889 | $213 | $349 |
| Hurdle rate | 9% | 9% | 9% |
| Valuation rating | Overvalued | Overvalued | Near Fair Value |
| Current yield (%) | ~0.7% | ~3.8% | ~3.0% |
| FCF dividend coverage ratio | 1.11x | 1.53x | 1.58x |
| Net debt / EBITDA | 0.99x | 2.74x | 2.69x |
| Primary growth driver | GLP-1 portfolio | Skyrizi / Rinvoq | Biosimilars + rare disease |
| Best fit for investor type | Growth-oriented investor | Income investor | Value / contrarian investor |
Overview – Three Pharma Giants, Three Investment Cases
Eli Lilly (LLY)
Eli Lilly (LLY) is the high-growth example of large-cap Pharma, which is being propelled by its GLP-1 portfolio, such as Mounjaro for diabetes, and Zepbound for obesity. The total addressable market is growing fast, as the treatment of obesity is now a long-term concern in the global healthcare sector, and the company is benefiting from this. Nonetheless, LLY is trading at a very high premium, and the question that the investors would want to know is whether this growth runway is high enough to warrant such a valuation.
AbbVie (ABBV)
AbbVie (ABBV) is the revenue-centred investment within this category, which is founded on a solid background in immunology and oncology. Although Humira revenues are falling as a result of the biosimilar competition, the effect is being mitigated by the increased revenues of Skyrizi and Rinvoq. Being a Dividend Aristocrat that has grown its dividends over 50 years with no interruption, ABBV is a stable income compounder, not a high-growth stock.
Amgen (AMGN)
Amgen (AMGN) is the least demanding case where a well-established biotechnology portfolio is coupled with a growing biosimilar enterprise. The purchase of Horizon Therapeutics has given it exposure to rare-disease therapies like Tepezza, making it stronger in its positioning in the long term. AMGN is growing at a slower rate compared to LLY, although the company is valued at a more sensible price, thus it is more appealing to investors who want to balance between growth and value.
| Metric | LLY | ABBV | AMGN |
| Market cap | $794.4B | $377.6B | $188.3B |
| 52-week return (price only) | +3.0% | +4.0% | +13.7% |
| Primary growth driver | GLP-1 portfolio | Skyrizi / Rinvoq | Biosimilars + rare disease |
Stock Performance & Total Returns – 2024 to 2026
| Metric | LLY | ABBV | AMGN |
| 1-year total return (dividend-adjusted) | +3.8% | +7.5% | +17.2% |
| 3-year total return (dividend-adjusted) | +168.4% | +48.1% | +61.8% |
Eli Lilly (LLY) presents a distinct division between short-term and long-term performance. Its 1-year total gain of +3.8% is comparatively low and lags the wider index (XLV), indicating a phase of stabilization following a high surge. Nevertheless, the 3-year gain of +168.4% indicates the strength of the re-rating of the GLP-1-motivated re-rating.
AbbVie (ABBV) has provided more consistent and equal returns. Its 1-year return of +7.5% was higher than XLV, whereas its 3-year return of +48.1% was also higher than the healthcare return. This indicates that the market has slowly regained its trust in ABBV to counter the fall of Humira using Skyrizi and Rinvoq, also being valued as a high-growth stock.
Amgen (AMGN) has been the best in the most recent period with a +17.2% one-year return that evidently performed better than XLV. Its three-year return, which is +61.8%, is also above the industry average of 2.8 percent in the healthcare industry, indicating a consistent implementation and the investor’s ability to appreciate its diversified portfolio. Nevertheless, the differences in the returns are not conclusive but descriptive; the investment case is decided by the valuation system in the following section.
Valuation Analysis
Residual earnings valuation explains if the stock can create value for shareholders after adjusting for its cost of capital . It does not assume the fair value of a stock, but rather examines the current data to analyse if the prices offer any rationale.
The required return is taken to be 9% in this analysis. The model then works out the perpetual growth rate implied by the current market price of each company. This would enable the investors to not only compare the rate of growth in individual companies, but also the degree of growth already presupposed in the market going forward.
| Valuation metric | LLY | ABBV | AMGN |
| Market-implied growth rate | 9.06% | 8.51% | 7.33% |
| Current price ($/share) | $889 | $213 | $349 |
| Hurdle rate | 9% | 9% | 9% |
| Valuation rating (Financial Beings) | Overvalued | Overvalued | Near Overvalued Territory |
The question for investors is whether, considering a 9% hurdle rate, is the current price justifiable to take position in any of these stocks? If so, which one is a rational buy?
The market anticipates that Eli Lilly will maintain a constant growth rate of 9.06% indefinitely. This expectation implies that the company must execute its plans flawlessly, as there is no room for mistakes or inefficiencies. Consequently, there is no buffer or safety net in place if the company’s execution does not go as planned.
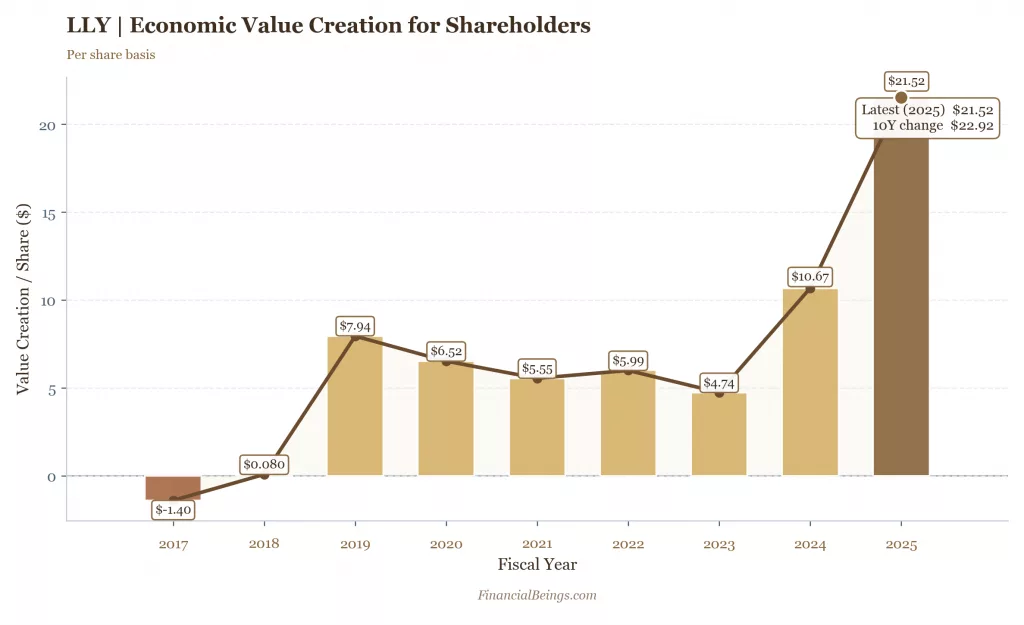
Figure 1. Eli Lilly (LLY) economic value creation for shareholders on a per-share basis, fiscal years 2017–2025
AbbVie at $213 suggests a perpetual growth rate of 8.51%. – within a 50-basis points range of the hurdle. In the market, where the Humira cliff of the company is still running its course, the market is expecting an almost flawless performance, indefinitely. That is a high conviction bet, not a good buying price.
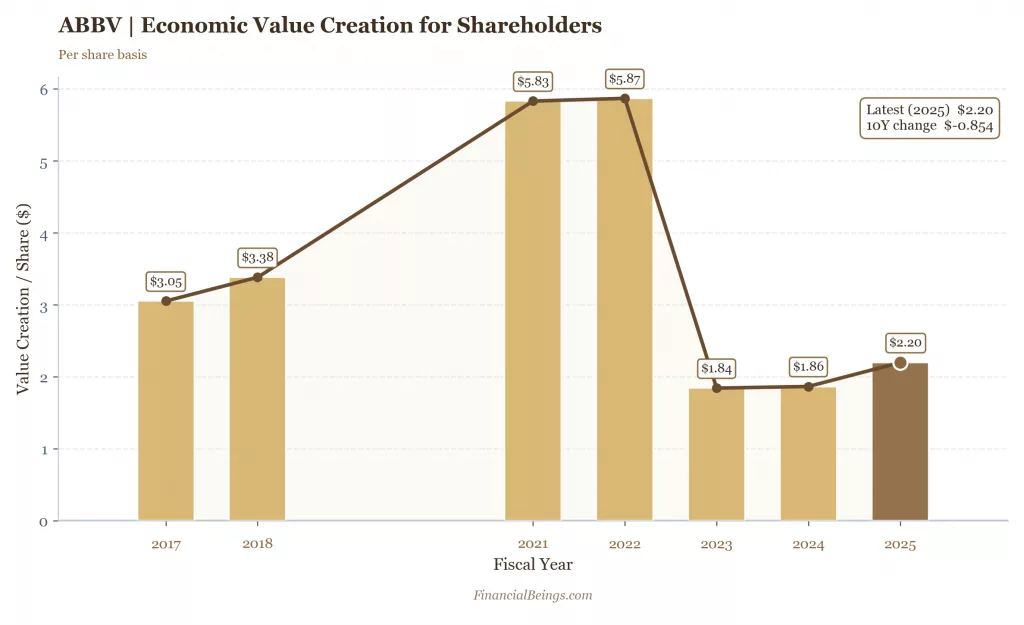
Figure 2. AbbVie (ABBV) economic value creation for shareholders on a per-share basis, fiscal years 2017–2025.
The relative standout is Amgen. The implied growth rate at the market is 7.33% at a price of $349, which is high but has a 167-basis-point leeway to the hurdle. Out of the three, AMGN is the only name which does not imply an assumption of growth which necessitates a near-perpetuity premium. Amgen has the largest margin of safety as of March 2026, among the three stocks, not because it is inexpensive, but because it is the least expensive and still offers no to less margin of safety.
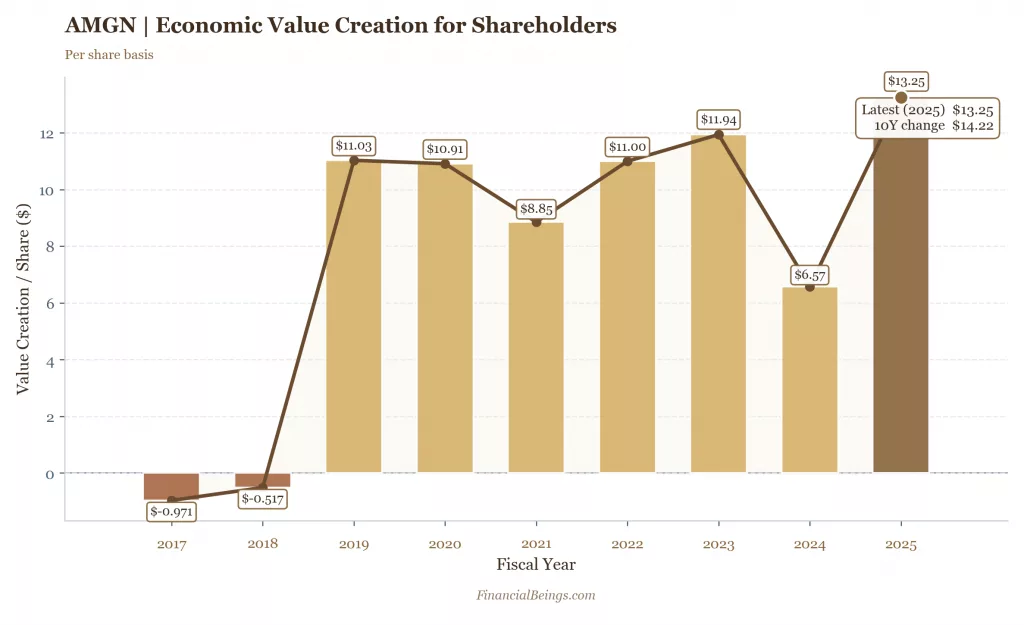
Figure 3. Amgen (AMGN) economic value creation for shareholders on a per-share basis, fiscal years 2017–2025.
The important issue is whether the growth premium at Eli Lilly is warranted by its GLP-1 pipeline and the growth of the obesity market. Although the growth opportunity is enormous and is backed by high demand, the valuation is already based on close to perfect implementation and continued high growth in the long term.
Amgen is the safest by the largest margin of the three, not because it is inexpensive, but because it has the highest margin of safety of the three, with a market-implied growth rate of 7.33%, though higher market expectations but lesser than the other two companies.
Generally, the three names are overpriced and offers no margin of safety
Intrinsic Value of LLY, ABBV and AMGN (Interactive Chart)
| Growth (%) | ABBV | AMGN | LLY | ||||||
|---|---|---|---|---|---|---|---|---|---|
| Intr. Value ($B) | Price / Share | V/P % | Intr. Value ($B) | Price / Share | V/P % | Intr. Value ($B) | Price / Share | V/P % | |
V/P > 100% = The stock screens undervalued under that growth assumption. V/P < 100% = The stock screens overvalued; the market price is ahead of the model value. V/P = 100% = Intrinsic value equals the stock’s current market cap at that scenario.
AMGN crosses above current market cap between 6% and 7%, posting 113.0% V/P at 7%. ABBV stays below current market cap through 7.5% but moves above it at 8%, reaching 137.5% V/P, while LLY never reaches current market cap and tops out at 88.9% V/P at 8%.
Note: All scenarios use a 9% hurdle rate.
Pipeline & Growth Drivers
Eli Lilly — GLP-1 runway
The major drivers of Eli Lilly’s revenue in 2026 and beyond will be its GLP-1 portfolio, including Mounjaro (type 2 diabetes) and Zepbound (obesity). These drugs are already in full commercial phase and still enjoy high demand because obesity treatment is now a long-term health care agenda. The overall addressable market size of GLP-1 therapies is growing at a very high rate, as the global rates of obesity continue to increase, and the payer coverage continues to rise; this is the biggest growth opportunity in the Pharma sector today.
Eli Lilly is also spending heavily on manufacturing capacity to satisfy demand, which is extremely vital in maintaining growth. In addition to GLP-1, donanemab (Kisunla) in Alzheimer’s disease is another growth driver that makes the pipeline diversified. The revenue trajectory reflects this strength, with 2025 revenue at $65.2B (+44.7% YoY) and consensus 2026 estimates of ~$80–89B (+22-25% YoY). The company is evidently experiencing an upward trajectory, yet the valuation already presupposes that, as evident by the 9.06% growth rate.
AbbVie — Post-Humira transition
The revenue engine of AbbVie can be characterized by the company’s Humira, which is still depreciating because of biosimilar competition. The main question is whether the new medications can make up for the lost revenue. To date, Skyrizi (immunology) and Rinvoq (immunology) are spearheading this shift and have become the business’s main growth drivers.
Otherwise, Imbruvica and Venclexta continue to play a significant role in oncology, and neuroscience assets (Vraylar and migraine therapies) offer further diversification. The revenue profile of AbbVie reveals the transition stage vividly with 2024 full-year revenue of $56.3B, 66.16B in 2025, and estimates of 2026 of to be about $66-68B (+17-19%) year-over-year. The pipeline is operational, and it needs to keep providing constant growth to match the market expectations.
Amgen — Biosimilar moat & rare disease
The acquisition of Horizon Therapeutics has brought assets like Tepezza (thyroid eye disease) and Krystexxa (gout) that contribute significantly to the revenues and make Amgen more competitive in specialty markets. Besides this, pipeline assets like olpasiran (cardiovascular) and MariTide (obesity) have greater upside in the long run.
The financial profile of Amgen indicates stable, average growth, and in 2025, the revenue is $36.75B and in 2026, the consensus is $37-39B, all with a growth of 9.96% and 7-9 percent year-over-year, respectively. This is a significant difference between Eli Lilly and this slower growth- it does lead to a less aggressive valuation, aiding the case of Amgen as the more balanced and comparatively appealing investment.
Dividend Quality Analysis
| Dividend metric | LLY | ABBV | AMGN |
| Current yield (%) | ~0.7% | ~3.8% | ~3.0% |
| 5-year dividend growth rate (CAGR %) | ~15% CAGR | ~5% CAGR | ~10% CAGR |
| Payout ratio (%) | 27.2% | 292.0% | 70.8% |
| FCF dividend coverage ratio | 1.11x | 1.53x | 1.58x |
| Consecutive years of dividend growth | ~12 years | 50+ years | ~14 years |
| Dividend Aristocrat status | NO — growth reinvestment model | YES (50+ years) | NO — strong but decelerating |
The strongest income stock in this category is AbbVie (ABBV). It is a Dividend Aristocrat that has paid a higher dividend over the last 50 years, not only since Abbott took over. To income investors, this track record is significant indicating consistency, discipline of management, and determination to pay cash to the shareholders. Although the payout ratio is significantly high, ABBV continues to enjoy strong coverage of free cash flow, which contributes to the sustainability of its dividend.
Amgen (AMGN) has a balanced dividend profile. Its current yield is a bit less than AbbVie, however, it is backed by a better payout ratio and the highest coverage of the free cash flow among the three. The increase in dividends has been robust within the last five years but it is beginning to decelerate due to business maturity. This causes AMGN to be a secure, yet aggressive, income choice in the space.
Eli Lilly (LLY) is the lowest-yielding company, but this is not a weakness but a strategy. The company is focusing on reinvestment in research, development and production capacity, especially to facilitate its GLP-1 portfolio. This growth-based capital allocation strategy, where retained earnings are used to finance growth instead of maximizing short-term income, is reflected in its low payout ratio.
The dividend of AMGN is the most balanced in terms of sustainability because it is well-covered and moderately paid. But to income-oriented investors, AbbVie will be the best choice, as it is the highest yield, with the longest track record of increasing dividends and explicit commitment to stockholders.
Balance Sheet & Free Cash Flow
The most important question to investors is simple: which company is financially sound enough to maintain dividends, invest in R&D, and acquire other companies simultaneously? This balance is more important in Pharma than in most industries since research expenditure and manufacturing investment are the direct drivers of future revenues, and free cash flow serves to pay shareholders and reinvest in future endeavours.
| Metric | LLY | ABBV | AMGN |
| Net debt / EBITDA | 0.99x | 2.74x | 2.69x |
| Free cash flow yield (%) | 0.75% | 4.72% | 4.30% |
| R&D spend as % of revenue | ~16.6% | ~7% | ~13% |
| Capital return yield (buybacks + dividends, %) | 1.19% | 3.35% | 2.72% |
Eli Lilly (LLY) has the best balance sheet, with the least leverage of 0.99x net debt to EBITDA. Nonetheless, it has the lowest free cash flow yield because the company is investing heavily in manufacturing capacity and R&D to cover its GLP-1 portfolio. This is a high capital expenditure, yet it lowers the cash returns in the short-term and maintains shareholder payouts at a low level.
AbbVie (ABBV) has a more advanced cash flow profile. Although the leverage is greater, the company has a high free cash flow, as it is indicated by a 4.72% yield and increased capital return to shareholders. This helps in its dividend policy but also restricts the flexibility position of Lilly, which has lower debt levels, particularly as it remains to cope with the post-Humira transition.
Amgen (AMGN) lies in between the two. It has a leverage comparable to that of AbbVie, but it adds to it a high generation of free cash flow and a balanced approach to capital allocation. AMGN is able to invest in growth projects and still pay off shareholders because it has a high free cash flow yield of 4.30% and a consistent R&D investment.
In general, LLY has the best balance sheet but focuses on reinvestment, ABBV has the highest cash returns and has a greater leverage, and AMGN has the most balanced mix of financial strength, cash flow and flexibility.
2026 Catalysts & Key Risks
| Company | Key 2026 catalyst | Key 2026 risk |
| Eli Lilly | Donanemab (Kisunla) Alzheimer’s international expansion; Zepbound manufacturing capacity scale-up; GLP-1 combination pipeline readouts | Novo Nordisk/semaglutide competition intensifying; IRA Medicare negotiation inclusion risk for Mounjaro/Zepbound; GLP-1 manufacturing execution risk |
| AbbVie | Skyrizi + Rinvoq combined revenue expected to breach $20B run-rate by end-2026; oncology pipeline readouts (ABBV-951, emraclidine neuroscience) | Humira biosimilar erosion continuing; Imbruvica revenue declining on competition; IRA price negotiation risk on key oncology assets |
| Amgen | Multiple biosimilar launches (HUMIRA biosimilar, Stelara biosimilar); Tepezza international expansion; pipeline assets olpasiran, MariTide | Biosimilar pricing pressure on Enbrel and HUMIRA biosimilar portfolio; Horizon integration costs; IRA drug pricing exposure on Enbrel |
The 2026 catalyst of Eli Lilly (LLY) is further growth of its GLP-1 franchise, such as Zepbound capacity scale-up and new combination therapies, and international expansion of donanemab (Kisunla) in Alzheimer’s disease. Execution is the greatest risk because, if there is a failure of manufacturing capacity to meet demand or competition by Novo Nordisk increases at a faster rate, the margins may decrease even with a robust underlying demand.
The ability to sustain Skyrizi and Rinvoq ramp is a key catalyst to AbbVie (ABBV) because it is projected to reach a combined revenue run-rate of over $20B by the end of 2026. This would validate that the transition after Humira is over. The key threat is continued Humira erosion and oncology competition, especially on Imbruvica, that might counter the improvements of newer assets.
The execution of Amgen’s (AMGN) 2026 catalysts is done on various fronts: new biosimilars, the launch of Tepezza in international markets and the improvement of pipeline assets like olpasiran and MariTide. The main threat is the pricing pressure in the biosimilar segment as well as integration issues post-acquisition of Horizon, which might impact margins.
The Inflation Reduction Act (IRA) presents another risk to all three companies but has varying effects. AbbVie and Amgen are more directly exposed to the developed drugs like Imbruvica and Enbrel that can be easily price-negotiated. Eli Lilly has a more forward-looking exposure, depending on the possibility of GLP-1 drugs such as Mounjaro and Zepbound being negotiable in the future as their market grows.
The Verdict – Which Pharma Stock Is the Best Buy in 2026?
| Investor profile | Recommended pick | Why |
| Long-term income investor | ABBV | Dividend Aristocrat status, yield sustainability, FCF coverage |
| Growth-oriented investor | LLY | GLP-1 TAM expansion, strongest revenue growth trajectory |
| Conservative / lower-risk investor | AMGN | Better blend of valuation support, mature FCF, and lower execution risk than LLY |
It is concluded that Amgen (AMGN) is the overall best buy in 2026. According to the residual earnings model, AMGN has the fewest aggressive long-term growth assumptions and provides investors with the greatest margin of safety of the three. Eli Lilly has the best growth story and the best income profile, but both are too expensive to afford mistakes.
This is important since at high implied growth rates, there is more risk of disappointment with the investment. AMGN is not dependent on flawless performance to justify its valuation, which is why it can withstand slower growth or fluid market conditions. It has a better risk-reward profile than LLY and ABBV.
Such a suggestion would vary depending on certain circumstances. When Eli Lilly demonstrates a consistent upside to the current GLP-1 expectations and is not forced to increase its margins, it might warrant its premium valuation. AbbVie can close the gap in case it proves to be more resilient in terms of earnings than expected, and its dividends remain unaffected. But when Amgen experiences a major pressure in its biosimilar prices or execution during the Horizon integration, its relative strength would diminish.
All calculations and valuation estimates are FinancialBeings’ own, based on data sourced from SEC filings of LLY (10K and 10Q), ABBV (10K and 10Q) and AMGN (10K and 10Q). Use or reproduction before prior approval is prohibited.
Frequently Asked Questions (FAQs)
Is LLY or ABBV a better long-term buy in 2026?
Neither LLY nor ABBV present a margin of safety
as per the analysis presented above. The market-implied continuity growth rate of 9.06% of LLY and 8.51% of ABBV are both within 50-100 basis points of the 9% hurdle, with no room to spare on execution risk, price pressure, or pipeline disappointment. At current prices, both names fail to pass the bar to a long-term investor who needs a discount to intrinsic value before taking the plunge.
Is Eli Lilly overvalued in 2026?
Yes, on the residual earnings of Financial Beings analysis. The current price of LLY implies that the market anticipates the stock to grow at 9.06% perpetually. The GLP-1 runway is reality, but it is already over-priced by far.
Which Pharma stock pays the best dividend in 2026?
AbbVie is the best dividend payer in this group since it has the highest current yield and Dividend Aristocrat status and good coverage of free-cash-flow. Amgen is a viable second option that has a slightly higher FCF coverage, but the company does not have as strong an income profile as ABBV. Lilly has the lowest dividend since the management is still focusing on growth reinvestment.
What is Amgen’s competitive advantage over Eli Lilly and AbbVie?
The competitive advantage of Amgen is scope and value. It possesses a real biosimilar platform, Horizon rare-disease assets including TEPEZZA and KRYSTEXXA, and an upside to its pipeline assets, including MariTide and Olpasiran, but its current price still suggests a lower perpetual-growth need than Lilly or AbbVie. That renders the most suitable value proposition among the three.
How does the IRA affect LLY, ABBV, and AMGN differently?
The IRA is most significant when the mature and high-priced Medicare drugs are taken into the negotiation pressure. For AbbVie and Amgen, it is a risk that is simpler to detect since CMS public-engagement documents explicitly mention Imbruvica and Enbrel during the initial round of negotiations. The short-term 2026 narrative of Lilly is rather an expansion of access and the dynamics of obesity reimbursements; however, the overall drug-pricing policy will continue to be important due to limited margins where the surprises may arise.
Usama Ali
Usama Ali is the founder of Financial Beings and a self-taught investor who blends classic valuation study with insights from psychology. Inspired by works from Benjamin Graham, Aswath Damodaran, Stephen Penman, Daniel Kahneman, and Morgan Housel, he shares independent, data-driven research to help readers connect money, mind, and happiness.
Disclaimer
The content provided herein is for informational purposes only and should not be construed as financial, investment, or other professional advice. It does not constitute a recommendation or an offer to buy or sell any financial instruments. The company accepts no responsibility for any loss or damage incurred as a result of reliance on the information provided. We strongly encourage consulting with a qualified financial advisor before making any investment decisions.
References
AbbVie. (2026, February 4). AbbVie reports full-year and fourth-quarter 2025 financial results. AbbVie News Center.
Amgen. (2026, March). 2025 letter to shareholders. Amgen.
Centers for Medicare & Medicaid Services. (2026). Medicare drug price negotiation program: Selected drugs and negotiated prices. CMS.
Eli Lilly and Company. (2026, February 4). Lilly reports fourth-quarter 2025 financial results and provides 2026 guidance. Lilly Investor Relations.
Yahoo Finance. (2026). AbbVie Inc. (ABBV) quote page. Yahoo Finance.
Yahoo Finance. (2026). Amgen Inc. (AMGN) quote page. Yahoo Finance.
Yahoo Finance. (2026). Eli Lilly and Company (LLY) quote page. Yahoo Finance.
