Find out the value AVGO stock in 2030 following Q1 2026 earnings of Broadcom. This forecast will examine the growth in AI, earnings power, and price potential in the long-term under different growth scenarios based on operating performance.
Introduction: What This Broadcom Stock Forecast Analysis Covers
The artificial intelligence and cloud computing ecosystem has one of the most significant infrastructure companies in the industry, which is Broadcom (NASDAQ: AVGO). The company delivers networking chips, data-center silicon, and enterprise infrastructure software that are used to make hyperscale AI systems. Due to this positioning, the primary question that is being posed by many investors: how much will AVGO stock be in 2030?
The analysis will not be based on speculation but on three main factors:
- The recent history of earnings and operating profitability of Broadcom.
- Long-term growth implications of the current valuation.
- Sensitivity of intrinsic value to long-term growth assumptions.
The findings indicate that the future valuation of Broadcom relies on the ability of the corporation to maintain long term growth in the high single digit range. Minor fluctuations in the growth expectations will have a major impact on the intrinsic value of the stock, and that is why the question: how much will AVGO stock be in 2030? cannot be answered without analyzing the growth assumptions and earnings power.
Estimated AVGO Stock Price in 2030 (Interactive Chart)
According to growth sensitivity model, in the year 2030, the estimated value of Broadcom stock will vary between approximately $146 and $418 per share, based on whether the under assumption long-term growth rates will materialise.
For investors interested in Broadcom’s comparison with Nvidia can read our deep dive analysis on NVIDIA vs Broadcom in 2026: Which AI Giant Is the Smarter Buy Right Now?
The valuation model performs intrinsic value analysis in the range of 2%-8.5% growth rate, which creates a broad spectrum of potential results.
| Growth (%) | Intr. Value ($B) | Price / Share | V/P % | Exp. Return % |
|---|
V/P > 100% = The stock is undervalued. Intrinsic value exceeds the market price; you are getting more than you are paying for. V/P < 100% = The stock is overvalued. The market price exceeds intrinsic value; the price embeds growth expectations the model hasn’t yet confirmed. V/P = 100% = The stock is fairly valued. Price equals model value at the assumed growth rate.
At 2-7.5% growth, AVGO’s intrinsic value remains below its current market price. The model only turns modestly undervalued at about 8.0% terminal growth, reaching roughly 122.1% V/P at 8.5%.
Note: Sustaining roughly 8% long-term growth is still a demanding assumption for a business already at Broadcom’s scale. To support the current price, the model needs durable growth from semiconductors, infrastructure software, and AI-related demand well beyond the near-term cycle.
| Scenario | Expected Growth | Estimated AVGO Price in 2030 |
| Bear Case | 2%–4% long-term growth | ~$146 – $176 |
| Base Case | 5%–6% sustainable growth | ~$198 – $230 |
| Bull Case | 7%–8.5% AI infrastructure expansion | ~$277 – $418 |
This analysis demonstrates that the current valuation of Broadcom suggests that the current market price is only supported at a long-term growth rate near 8%, which is challenging to maintain, considering that this company already functions on a great scale.
Broadcom’s Q1 2026 Results – Why the Long-Term AVGO Outlook Just Changed
The trend in the earnings of Broadcom has gotten stronger in recent years. The firm has matched great semiconductor demand and a growing infrastructure software revenue after significant acquisitions.
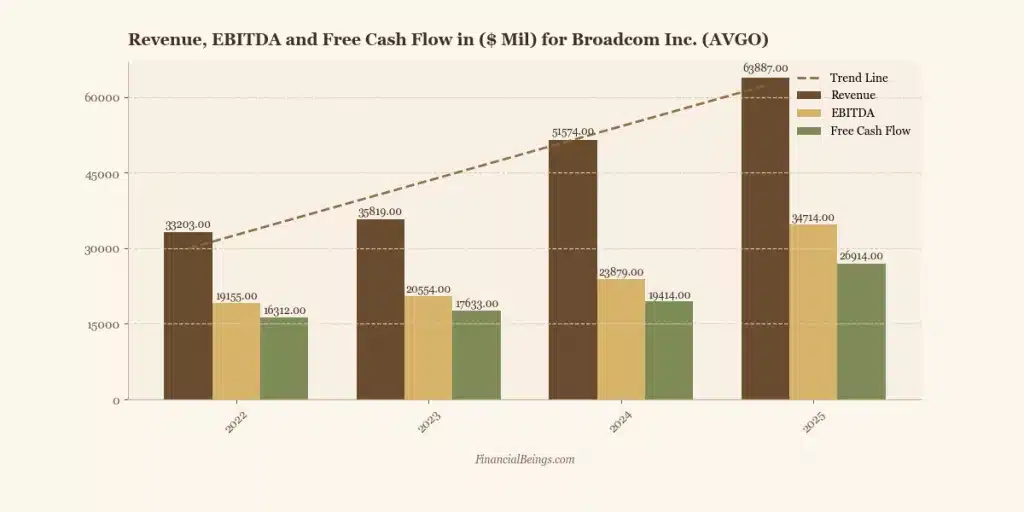
Figure 1. Revenue, EBITDA, and Free Cash Flow Growth for Broadcom (2022–2025)
It shows steady increases across all major operating metrics:
| Year | Revenue ($M) | EBITDA ($M) | Free Cash Flow ($M) |
| 2022 | 33,203 | 19,155 | 16,312 |
| 2023 | 35,819 | 20,554 | 17,633 |
| 2024 | 51,574 | 23,879 | 19,414 |
| 2025 | 63,887 | 34,714 | 26,914 |
Some significant tendencies were developed.
The increase in revenue was much higher in 2023-25. Second, the operating leverage is high, with EBITDA. Third, Broadcom is increasing in its free cash flow generation, which has offered capital to dividends, acquisitions, and share repurchases.
These findings contribute to understanding the reason why the analysts often speak about the Broadcom stock forecast 2030 options based on long-term infrastructure demand.
What Will AVGO Stock Be Worth in 2030? Key Drivers of Broadcom’s Growth
To answer the question of what AVGO stock will be in 2030, it is important to study the structural growth drivers of the company.
Broadcom is at the crossroads of various strong trends in technology.
AI Data Center Expansion
The use of AI infrastructure is causing high-performance networking chips and interconnect technologies to remain in high demand. Hyperscale data centers are in need of rich switching and connection options, which is what Broadcom offers to the major cloud providers.
This trend is projected to be high because businesses are putting high investments in AI training and inference systems.
Semiconductor Leadership
Broadcom is a strong position holder in:
- networking chips
- custom silicon
- high-performance connectivity
- broadband infrastructure
These segments have a positive influence on the increase in global data traffic that in turn increases investment in cloud infrastructure.
Enterprise Infrastructure Software.
Broadcom has also ventured into enterprise software by acquiring it. This provides returns on a recurrent basis and makes it less cyclical than semiconductor-only firms.
Free Cash Flow Strength
Broadcom is producing a large amount of free cash flow in comparison with revenue, which is used to pay dividends and invest in growth strategies. This financial strength is usually taken into consideration by long-term investors when assessing AVGO stock prediction 2030 scenarios.
What Will AVGO Stock Price Be in 2030 Based on Current Growth Trends?
Broadcom profitability ratios depict the abundance rate at which the company converts revenue into earnings.
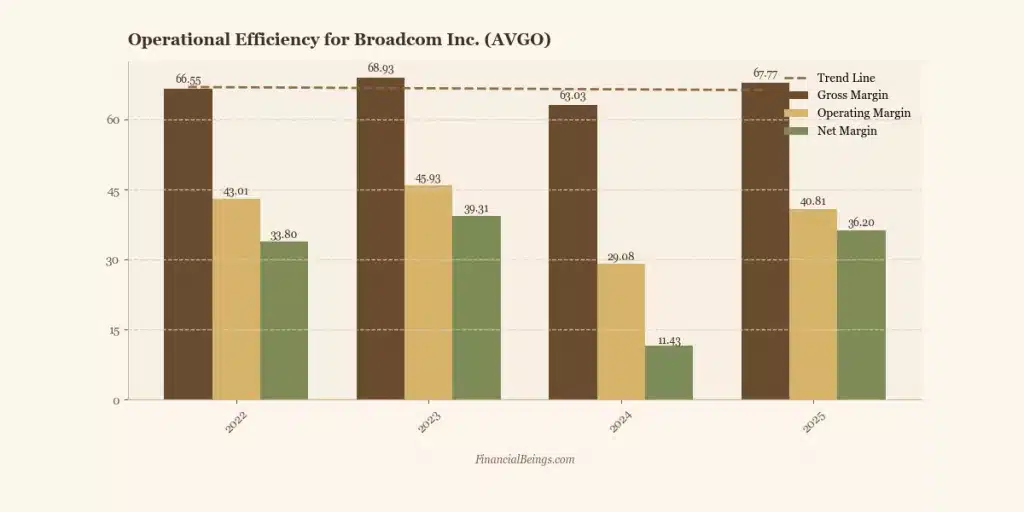
Figure 2. Operational Efficiency Metrics for Broadcom (Gross, Operating, and Net Margins)
| Year | Gross Margin | Operating Margin | Net Margin |
| 2022 | 66.55% | 43.01% | 33.80% |
| 2023 | 68.93% | 45.93% | 39.31% |
| 2024 | 63.03% | 29.08% | 11.43% |
| 2025 | 67.77% | 40.81% | 36.20% |
The margin profile shows several significant features:
- Gross margins are always greater than 60%, and this shows that the pricing power is strong.
- The 2025 recovery of operating margins was beneficial.
- Net margins have also increased significantly after operational changes.
These changes in profitability provide support for long-term earnings growth assumptions in the Broadcom long-term investment outlook.
Broadcom’s Operating Asset Structure
Understanding of the balance-sheet structure of Broadcom can be used to explain the efficiency with which the company is able to produce operating earnings. An effective scale to use in this analysis is Net Operating Assets (NOA), the scale being the capital that has been invested in the main operations of the firm, excluding operating liabilities. This ratio shows the extent to which operating capital should bring returns to the business to create value.
The Net Operating Assets show the part of the balance sheet that produces operating income. The company has to ensure that its operating earnings performance is high as long as operating assets rise to ensure that it has attractive returns on capital.
The operating structure of Broadcom is based on the capital requirements of a big semiconductor and infrastructure software company. The company has increased its operating base of assets through investments in semiconductor design, intellectual property and enterprise software platforms that help the company grow its revenue in the future. Return on Net Operating Assets (RNOA), which is a key measure of the efficiency with which the company turns the invested capital into operating profits, is also dependent on the balance between operating assets and operating liabilities.
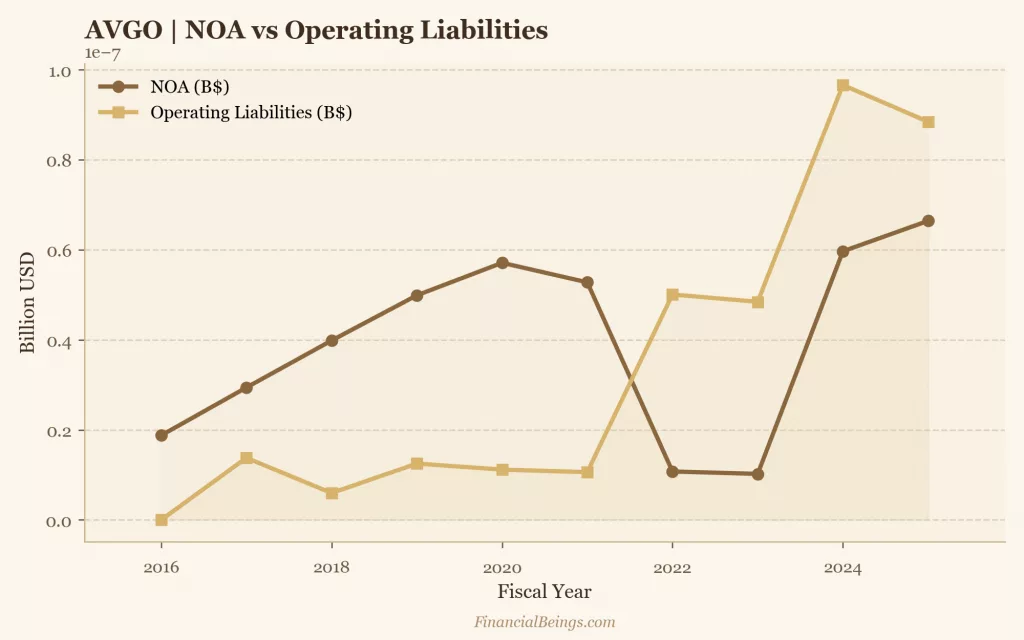
Figure 3. Broadcom Net Operating Assets vs Operating Liabilities
| Fiscal Year | Net Operating Assets (NOA) ($B) | Operating Liabilities ($B) |
| 2016 | 0.19 | 0.00 |
| 2017 | 0.30 | 0.14 |
| 2018 | 0.40 | 0.06 |
| 2019 | 0.50 | 0.13 |
| 2020 | 0.57 | 0.11 |
| 2021 | 0.53 | 0.11 |
| 2022 | 0.11 | 0.50 |
| 2023 | 0.10 | 0.49 |
| 2024 | 0.60 | 0.98 |
| 2025 | 0.67 | 0.90 |
How Much Could AVGO Stock Rise by 2030? Valuation Scenarios
Growth sensitivity analysis shows the degree to which the valuation is sensitive to assumptions of growth.
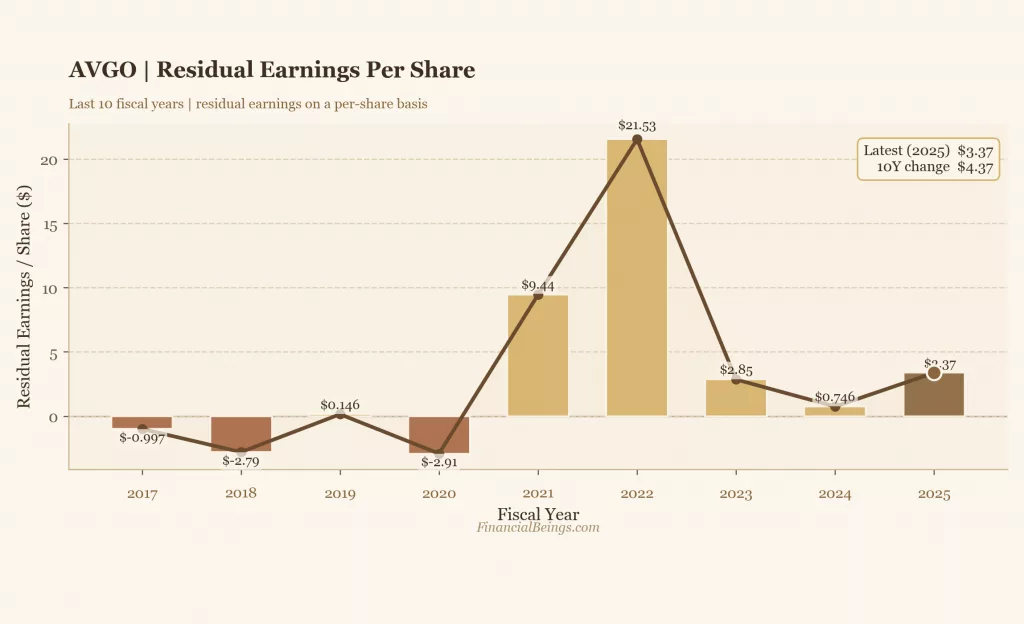
Figure 4. Broadcom Residual Earnings Per Share (REPS) Trend
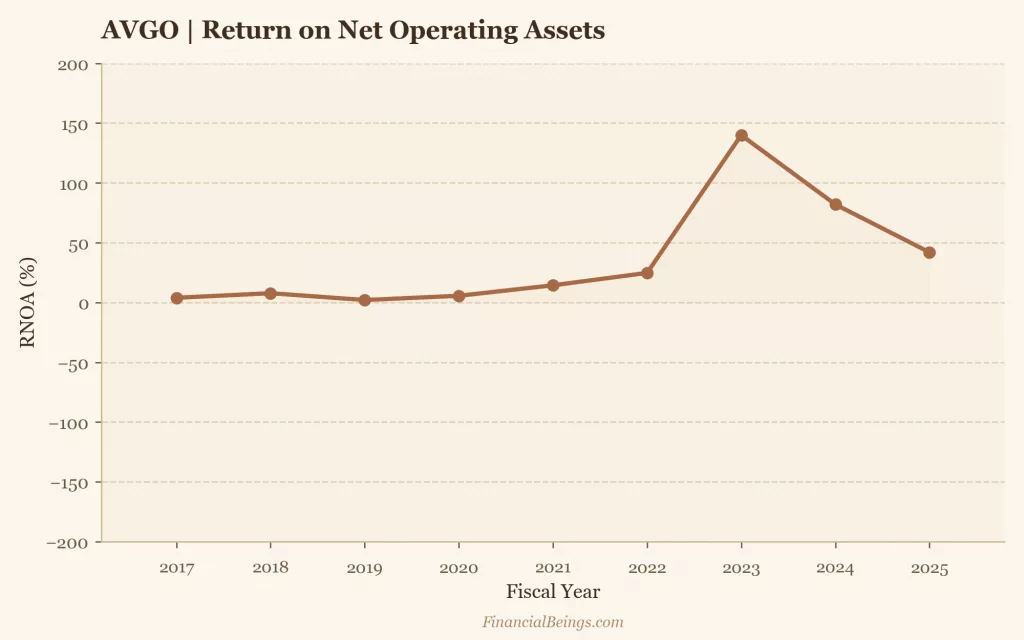
Figure 5. Intrinsic Value Sensitivity to Long-Term Growth Assumptions
The analysis considers growth of 2%-8.5%.
| Growth | Intrinsic Value ($B) | Price/Share | V/P % |
| 2% | $695B | $146.70 | 42.8% |
| 4% | $836B | $176.53 | 51.5% |
| 5% | $943B | $198.90 | 58.1% |
| 6% | $1,091B | $230.22 | 67.2% |
| 7% | $1,314B | $277.20 | 80.9% |
| 8% | $1,685B | $355.50 | 103.8% |
| 8.5% | $1,982B | $418.14 | 122.1% |
Minor variations in growth assumptions have huge variations in intrinsic value. For example:
- Intrinsic value is approximately $198/share at a growth rate of 5 per cent.
- Intrinsic value at 8.5% growth is of $418 per share.
This is the sensitivity that has led most investors to argue about what the AVGO stock price will be in 2030 based on long-term AI infrastructure demand.
Broadcom Stock Forecast 2030 – Risks Investors Should Watch
Even strong firms have risks that may impact the long-term valuation.
Hyperscalers Concentration
Broadcom relies on massive cloud enterprises to earn a considerable amount of revenue. Hyperscale customers might change their spending, which would affect growth.
Semiconductor Cycles
The semiconductor business is cyclical. Seasons of excess supply or reduced demand may have an impact on profits.
AI Investment Cycles
Though the current level of AI infrastructure spending is high, these levels may vary with time.
Acquisition Integration
Broadcom has expanded through acquisitions. The ability to integrate new businesses successfully is relevant to remaining profitable.
These are some of the factors that should be put in consideration when considering the value of AVGO stock in the year 2030.
Portfolio Strategy – Where Does AVGO Fit in an Investor Portfolio?
The combination of high profitability, the increasing AI-driven demand, and the high level of free cash flow generation defines Broadcom. The stock valuation analysis indicates that the long-term value of the stock is very much dependent on the growth expectations, and based on current stock valuation, will reflect approximately 7.5- 8% long-term growth. Due to such a profile, Broadcom has the ability to serve a variety of functions based on the portfolio strategy of an investor.
AVGO in a Growth Portfolio
Broadcom is a potential core AI infrastructure investment in a growth portfolio. With a high long-term growth, intrinsic value may increase up to the range of $355-$418 per share under higher sustained growth conditions according to our valuation model. Given the higher growth is maintained by AVGO.
AVGO in a Balanced Portfolio
Balanced portfolios require growth as well as preservation of capital, Broadcom at current price levels is significantly priced for higher growth. A limited exposure can be maintained, however, it should be noted that if the growth drops to levels between 5%-6%, there will be a drawdown in stock price between $198-$230 per share.
AVGO in a Conservative Portfolio
To conservative investors, capital preservation is of utmost desire. Broadcom has high margins and cash flows, which makes it stable. Nevertheless, when ong-term growth is cut to between 2-4% percent, the intrinsic value might decrease to as low as between $146 and $176 per share, which indicates erosion of a major scale to its intrinsic value.
Is Broadcom a Good Long-Term Investment Through 2030?
Broadcom seems to be a good long-term investment option because of its good profitability, growing AI infrastructure requirements, and steady generation of free cash flow. The networking chips, custom AI silicon, and software enterprise infrastructure are the major sectors the company is involved in, and they will promote growth in long-term revenues.
Valuation, however, is very dependent on future growth. The analysis on of growth sensitivity indicates that the current valuation of Broadcom in the market suggests long-term growth of around 8.0%. With faster growth, the intrinsic value would increase to between $355 and $418 per share, and slower growth of 2-4% percent would give intrinsic values of between $146 and $176 per share.
Thus, Broadcom can be regarded as a good long-term investment provided that the corporation continues to enjoy the benefits of AI data-centre expansion and sustainable growth in earnings till the end of the decade.
Final Verdict: How Much Will AVGO Stock Be in 2030 for Long-Term Investors?
The long-term valuation of Broadcom is primarily subject to its capacity to maintain high growth in earnings in the AI infrastructure, semiconductor networking, and enterprise software platforms. The growth-sensitivity analysis suggests that the long-term growth expectations of around 8% have already been incorporated in the current market price.
Assuming that in the future Broadcom keeps a high level of demand among hyperscale data centers and is continuing to grow its AI semiconductor business, intrinsic value would shift between $355 to $418 per share by 2030. The estimated value, at more moderate growth assumptions of 5-6%, would probably be more clustered around $198-$230 per share. Nonetheless, in case of a substantial slowdown of the long-term growth (2-4%), valuation will decrease to around $146-176 per share.
Broadly, Broadcom continues to be a strong long-term technology firm, but with a high sensitivity towards the future developments of the AI infrastructure on a global scale. For long-term investors, the crucial determinant of whether AVGO stock will be worth in 2030 depends on company’s ability to retain high-single-digit growth and sustain high profitability with increasing revenues.
All calculations and valuation estimates are FinancialBeings’ own, based on data sourced from SEC filings of AVGO (10K and 10Q), use or reproduction before prior approval is prohibited.
Usama Ali
Usama Ali is the founder of Financial Beings and a self-taught investor who blends classic valuation study with insights from psychology. Inspired by works from Benjamin Graham, Aswath Damodaran, Stephen Penman, Daniel Kahneman, and Morgan Housel, he shares independent, data-driven research to help readers connect money, mind, and happiness.
Disclaimer
The content provided herein is for informational purposes only and should not be construed as financial, investment, or other professional advice. It does not constitute a recommendation or an offer to buy or sell any financial instruments. The company accepts no responsibility for any loss or damage incurred as a result of reliance on the information provided. We strongly encourage consulting with a qualified financial advisor before making any investment decisions.
