Introduction to Dividend Aristocrats
The Best Dividend Stocks (Aristocrats) are stocks that have raised their dividends for a minimum of 25 years consecutively with stability and reliability. They are usually large, established, and financially strong firms to provide stable and reliable cash flows to the investors. Dividend Aristocrats can potentially increase in value and provide a steady income stream to the investors. In this article, I will review 10 well-known Dividend Aristocrats, determine their payout ratios, examine the dividend growth, regularity, and reinvestment policies, as well as the approximate fair value estimate based on the model of perpetual income stream. In this article I will discuss 10 best dividend stocks with their fair value to buy in 2024.
What Are Dividend Aristocrats?
A Dividend Aristocrat therefore refers to an S&P 500 stock that has raised its dividend for at least 25 consecutive years proving financial strength and capacity to generate consistent cash flows. More on best dividend stocks HERE. These companies are market dominant players with a large market base and reasonable economic health. It is able to raise dividend payouts during economic volatility and other risks associated with the market it proves its dedication to shareholder wealth generation. Dividend Aristocrats are particularly appealing to income investors interested in predictable, reliable income during post-career or supplementary income. However, such status is attainable only by organizations that are serious about their financials and the value they propose to shareholders. [1]
The Importance of Dividend Payout Ratio
The payout ratio is widely considered a key measure of a company’s prospects of maintaining and increasing its dividends into the future. This is computed as total of dividends divided by the total net income which simply gives an indication of how much of the income generated is distributed amongst its shareholders.
A low payout ratio indicates that the company is retaining a substantial portion of its earnings for reinvestment in its operations, to reduce debt or to establish a cash reserve, which could help it to maintain or even improve its dividend payout during leaner years. Such a strategy may be more comforting to investors who are interested in consistent dividends over the long term. Multiply your investment by finding metrics for best stocks HERE!
However, a high payout ratio means that most of the earnings are being distributed to shareholders, reducing the room for maneuvering or any leeway in case of an emergency. In such cases, if the company is experiencing some shocks or poor performance in terms of earnings per share, then it can be difficult for the firm to maintain the dividend payments, so there might be reductions or even suspensions.
Hence, while a higher payout ratio may be attractive to investors with high expectations on immediate gains, it is also associated with high risks and thus the analysis of this ratio is very important when considering the future sustainability of dividends paying stocks. [2]
Company Analysis: 10 Best Dividend Stocks
Below is the breakdown of 10 Dividend Aristocrats, including payout ratios, dividend increase, frequency, reinvestment options, tax treatment, and dividend sustainability based on the payout ratio.
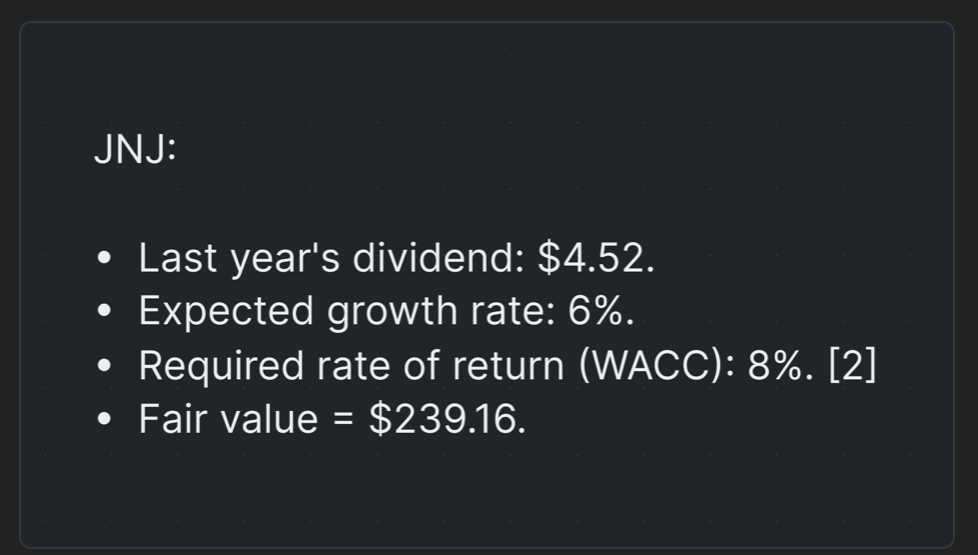
Johnson & Johnson (JNJ)
- Payout Ratio: Johnson & Johnson has a payout ratio of approximately 54%. [3]
- Dividend Increase: JNJ’s dividend has grown for the last 61 years and in the last three years, it has grown at an average of 6%. [1]
- Dividend Frequency: Johnson & Johnson pays dividends quarterly. [3]
- Dividend Reinvestment Plan (DRIP): JNJ has a DRIP program which enables investors to use their dividends to purchase stock.
- Tax Implications: Dividends received are normally treated as qualified dividends, which are accorded a lower tax treatment to U. S. investors.
- Dividend Safety: The payout ratio is excellent, and the company has a history of growing dividends which makes the JNJ dividend profile very safe.
Fair Value Calculation
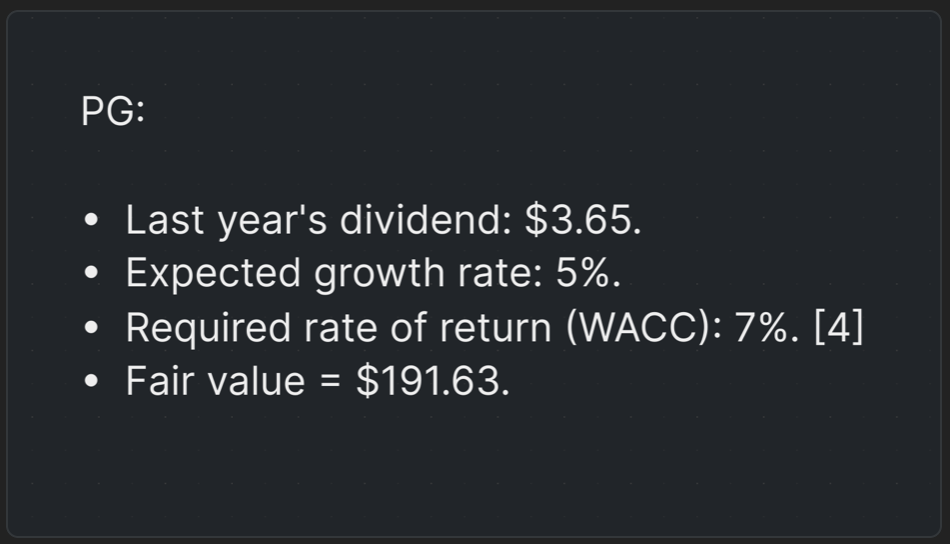
Procter & Gamble Co. (PG)
- Payout Ratio: Procter & Gamble has a payout ratio of 62%. [4]
- Dividend Increase: PG has a 67-year history of increasing dividends, with a 3-year average increase of 5%.
- Dividend Frequency: Dividends are paid quarterly.
- Dividend Reinvestment Plan: Available, allowing investors to purchase additional shares using dividends.
- Tax Implications: Qualified dividends taxed at a reduced rate for U.S. investors.
- Dividend Safety: With a manageable payout ratio, PG’s dividend is considered safe.
Fair Value Calculation
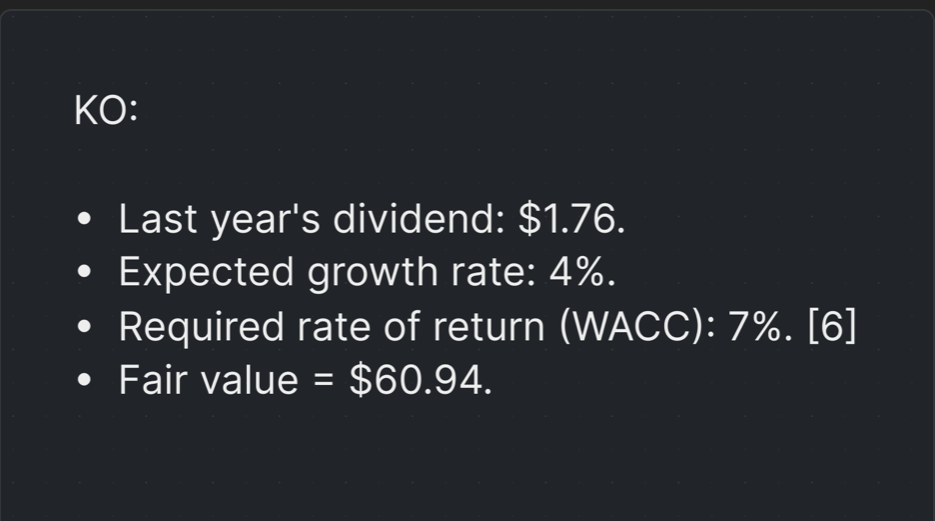
Coca-Cola (KO)
- Payout Ratio: Coca-Cola’s payout ratio stands at 73%. [5]
- Dividend Increase: KO has increased its dividend for 61 years, with a 3-year average increase of 4%.
- Dividend Frequency: Quarterly payments.
- Dividend Reinvestment Plan: KO offers a DRIP.
- Tax Implications: Dividends are taxed as qualified dividends for U.S. investors.
- Dividend Safety: While the payout ratio is higher, Coca-Cola’s strong cash flow supports dividend safety.
Fair Value Calculation
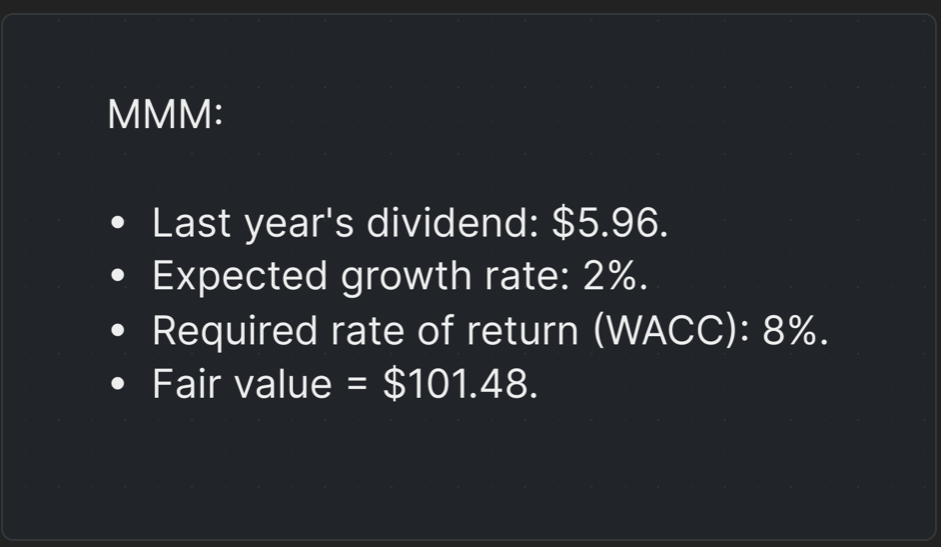
3M Co. (MMM)
- Payout Ratio: 3M has a payout ratio of 58%. [7]
- Dividend Increase: 3M has increased its dividend for 64 consecutive years, with a 3-year average increase of 2%.
- Dividend Frequency: Dividends are paid quarterly.
- Dividend Reinvestment Plan: Available.
- Tax Implications: Dividends are taxed as qualified dividends.
- Dividend Safety: The moderate payout ratio and conservative management make 3M’s dividend safe.
Fair Value Calculation
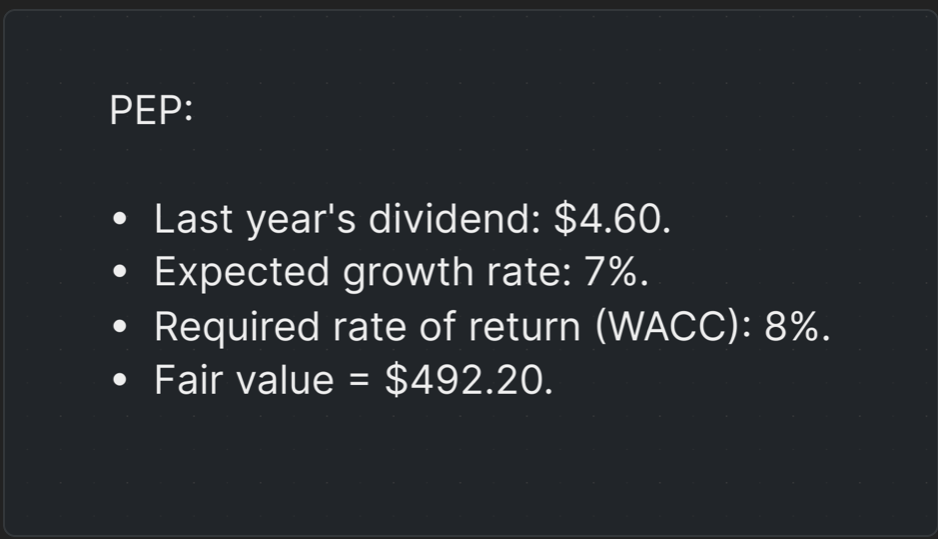
PepsiCo Inc. (PEP)
- Payout Ratio: PepsiCo has a payout ratio of 68%. [8]
- Dividend Increase: PEP has a 51-year history of increasing dividends, with an average increase of 7% over the last three years.
- Dividend Frequency: Quarterly.
- Dividend Reinvestment Plan: Available.
- Tax Implications: Qualified dividends are subject to a lower tax rate.
- Dividend Safety: PepsiCo’s payout ratio and consistent growth make its dividend safe.
Fair Value Calculation
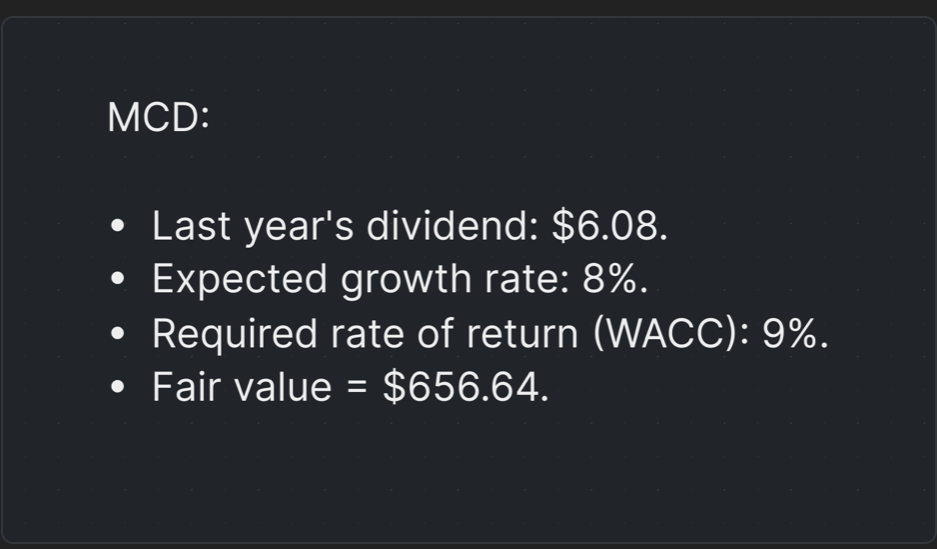
McDonald’s Corp. (MCD)
- Payout Ratio: McDonald’s payout ratio is around 63%. [9]
- Dividend Increase: MCD has increased dividends for 47 consecutive years, with a 3-year average increase of 8%.
- Dividend Frequency: Quarterly payments.
- Dividend Reinvestment Plan: Available.
- Tax Implications: Dividends are taxed as qualified dividends.
- Dividend Safety: With a strong brand and consistent earnings, MCD’s dividend is considered safe.
Fair Value Calculation
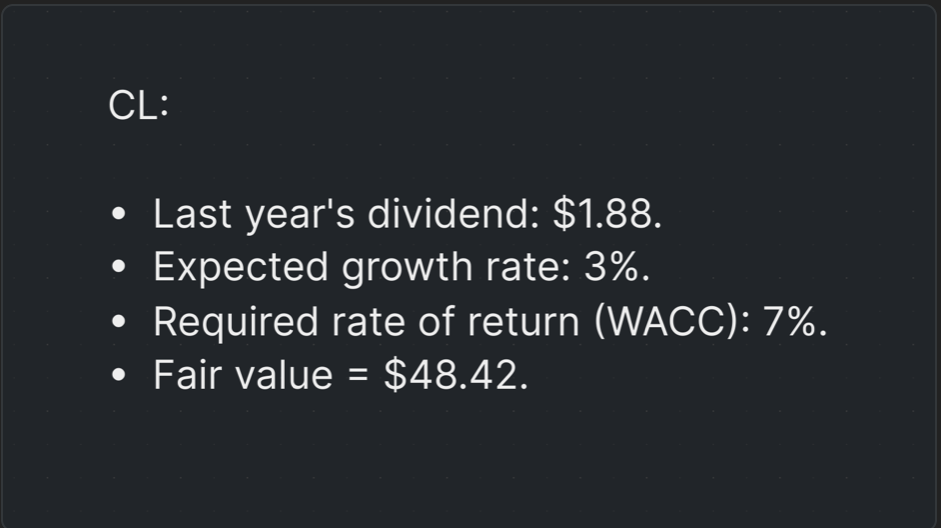
Colgate-Palmolive (CL)
- Payout Ratio: Colgate-Palmolive has a payout ratio of 60%. [10]
- Dividend Increase: CL has increased dividends for 60 consecutive years, with an average increase of 3% over the last three years.
- Dividend Frequency: Quarterly.
- Dividend Reinvestment Plan: Available.
- Tax Implications: Qualified dividends are taxed at a lower rate.
- Dividend Safety: A solid payout ratio ensures the safety of CL’s dividend.
Fair Value Calculation
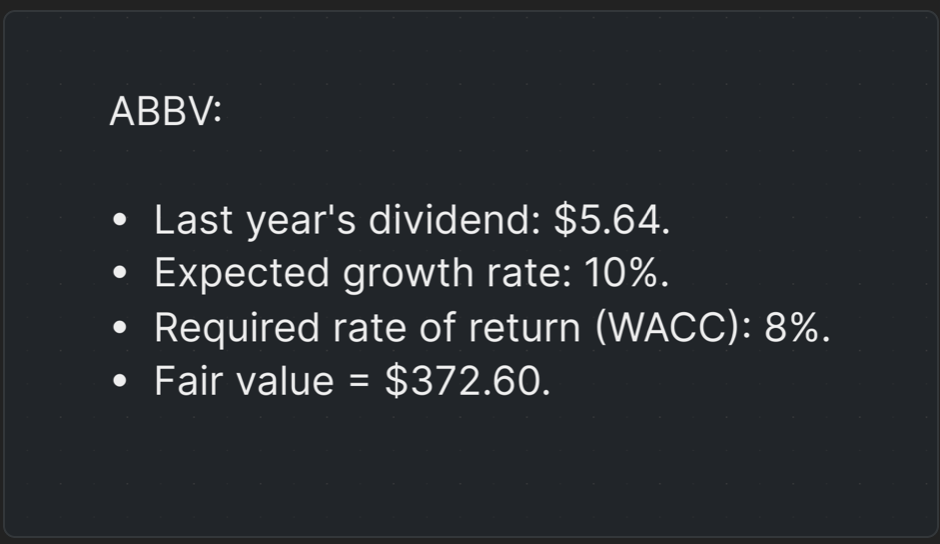
AbbVie Inc. (ABBV)
- Payout Ratio: AbbVie’s payout ratio is around 42%. [11]
- Dividend Increase: ABBV has increased dividends for 49 consecutive years, with a 3-year average increase of 10%.
- Dividend Frequency: Quarterly payments.
- Dividend Reinvestment Plan: Available.
- Tax Implications: Dividends are taxed as qualified dividends.
- Dividend Safety: AbbVie’s relatively low payout ratio suggests that its dividend is safe and has room for growth.
Fair Value Calculation
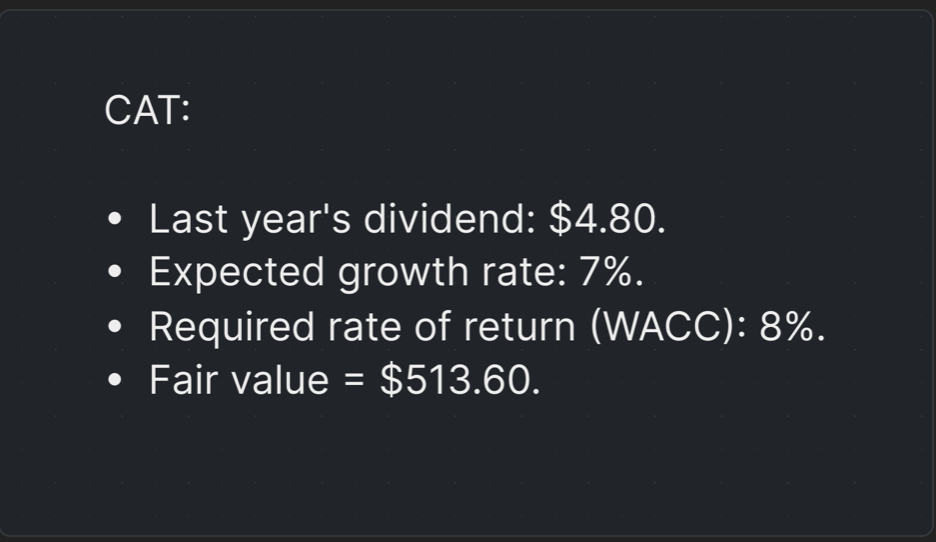
Caterpillar Inc. (CAT)
- Payout Ratio: Caterpillar has a payout ratio of 40%. [12]
- Dividend Increase: CAT has increased dividends for 29 consecutive years, with a 3-year average increase of 7%.
- Dividend Frequency: Quarterly.
- Dividend Reinvestment Plan: Available.
- Tax Implications: Qualified dividends are taxed at a lower rate.
- Dividend Safety: The low payout ratio indicates that CAT’s dividend is safe.
Fair Value Calculation
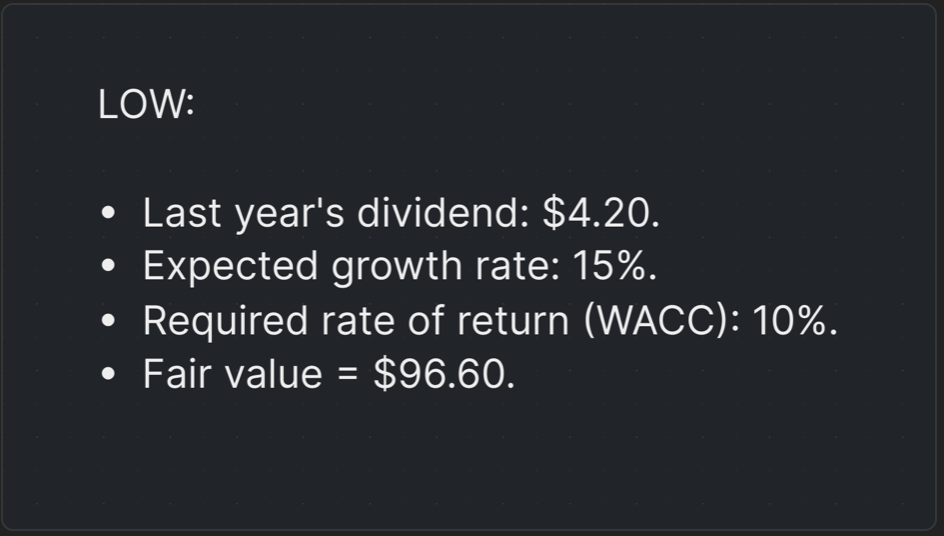
Lowe’s Companies Inc. (LOW)
- Payout Ratio: Lowe’s has a payout ratio of 30%. [13]
- Dividend Increase: LOW has increased dividends for 60 consecutive years, with a 3-year average increase of 15%.
- Dividend Frequency: Quarterly.
- Dividend Reinvestment Plan: Available.
- Tax Implications: Dividends are taxed as qualified dividends.
- Dividend Safety: With a very low payout ratio and strong earnings growth, Lowe’s dividend is highly safe, with significant room for further increases.
Fair Value Calculation
Conclusion
All the above mentioned 10 Dividend Aristocrats exhibit good financial health and are dedicated to growing their dividends in the long run. The payout ratios vary from conservative to moderate signaling the ability of these firms to sustain or even increase the dividend payment despite the prevailing economic conditions in the market. Many of these companies are associated with Dividend Reinvestment Plans (DRIPs), which enable shareholders to reinvest the dividends into more stocks within the same firm without the need to pay brokerage fees.
