
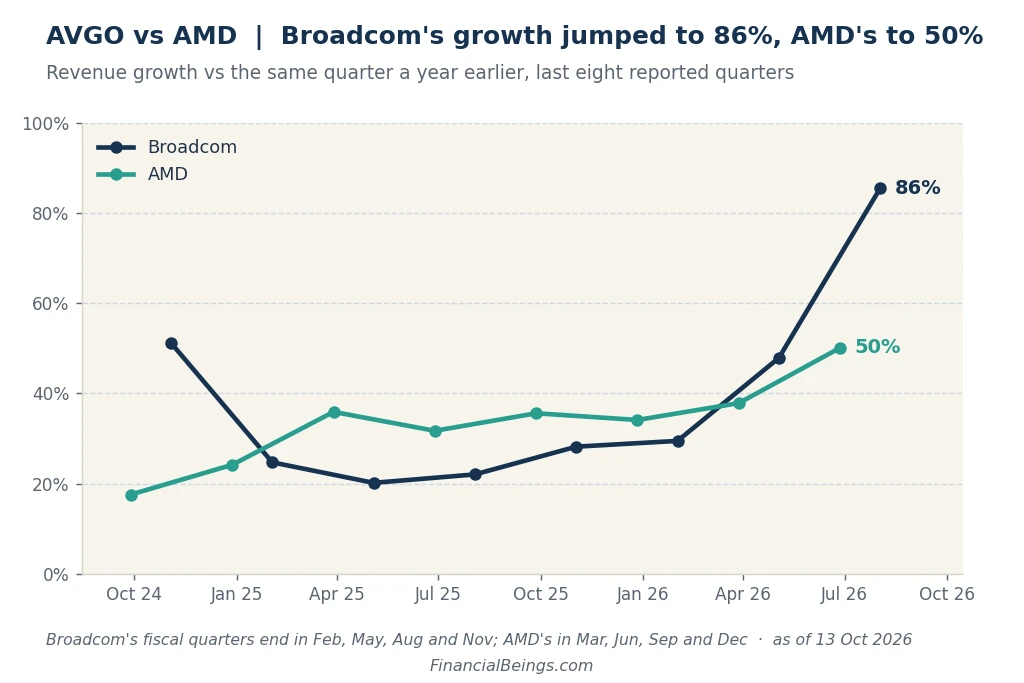
Quick answer: The AVGO vs AMD stock debate is a discussion of the faster-growing, higher-margin company, and the only one of the two that pays a dividend, Broadcom (AVGO). Its revenue grew by 86 percent last quarter compared with a 50 percent increase for AMD. However, the share price of AMD has soared, so it now expects more growth in the future. It is up to you to see which works best for you, based on whether AMD delivers.
Many investors think that AI chips are the future, and two names come up again and again.
Broadcom has faster growth and higher profits on each sale and pays a dividend. Then check the share prices, and something goes wrong.
AMD’s share price is up 182.7% this year. Broadcom’s is up 3.2%. The question to be answered with the AVGO vs AMD Stock 2026 is that gap.
AVGO vs AMD Stock at a Glance
Broadcom leads on growth, margin, and income. AMD leads on share-price momentum.
| Metric (13 Oct 2026 close) | Broadcom (AVGO) | AMD |
| Share price / market value | $357.31 / $1,705.7bn | $605.53 / $988.5bn |
| Latest-quarter revenue, growth | $29.6bn, +86% (May–Aug 2026) | $11.5bn, +50% (Apr–Jun 2026) |
| AI / Data Center revenue (company-reported) | $16.7bn, +221% | $6.7bn, +107% |
| Trailing-twelve-month revenue, growth | $89.1bn, +49% | $41.3bn, +40% |
| Return on operating assets | 31.2% | 9.4% |
| Value of the business ÷ operating profit | 43.1× | 180.9× |
| Dividend yield | About 0.73% | None |
| Share-price change, 31 Dec 2025 to 13 Oct 2026 | +3.2% | +182.7% |
The value (market value) is the share price multiplied by the number of shares. The value of the business is the net debt plus the equity value.
In one sentence, the AVGO vs AMD Stock 2026 decision: Broadcom is the much stronger business, while the AMD stock has more hope, and it’s priced accordingly.
Which Company Is Growing Faster?
Broadcom is growing faster on all metrics, and its next quarter guidance suggests it’s growing approximately twice as fast as AMD.
Latest Quarter: Broadcom Fiscal Q3 vs AMD Q2 2026
The quarter ended 2 Aug, which includes the revenue from May to August 2026: Revenue rose to $29.6bn, up 86%, and AI chip revenue increased 221% to $16.7bn (Broadcom earnings release, 2 Sep 2026).
AMD’s quarter covered April to June 2026, ending 27 Jun: revenue reached $11.5bn, up 50%, with Data Center revenue up 107% to $6.7bn (AMD 8-K, 4 Aug 2026).
Next-Quarter Guidance
Guidance is a company’s own forecast for its next quarter.
| Next-quarter guidance (company-reported) | Broadcom (2 Sep 2026) | AMD (4 Aug 2026) |
| Revenue | About $34.8bn | About $13bn ± $0.3bn |
| Growth vs a year earlier | About +93% | About +41% |
| AI revenue | About $21.7bn | Not given |
Trailing-Twelve-Month Growth
“Trailing twelve months” is the sum of the last four quarters reported. On that basis, Broadcom grew 49% to $89.1bn, and AMD grew 40% to $41.3bn.
Why Has AMD Stock Beaten Broadcom?
The market is paying ahead for AMD’s future gains, and has marked Broadcom down over worries about its few customers and how they pay for chips.
How Far Each Stock Has Moved
| Share price | Broadcom | AMD |
| Change, 31 Dec 2025 to 13 Oct 2026 | +3.2% | +182.7% |
| Below its highest price in our data | −20.0% (vs $446.77, May 2026) | −4.0% (vs $630.63, 27 Sep 2026) |
What Pulled Broadcom Down
On 7 Oct 2026, The Wall Street Journal reported planned talks for Broadcom to line up about $50bn of financing for OpenAI chips. The talks had not yet started, but its stock price fell on 8 Oct.
Earlier, Bloomberg (2 Oct 2026) had reported Broadcom’s part in a $60bn chip-lease package for Anthropic. A Q4 forecast slightly below analysts’ estimates added to the nerves.
What the Market Is Paying For at AMD
AMD is forecasting that Data Center sales will more than double in 2027, with Instinct AI chips and Helios server racks contributing to the growth in this area (AMD Q2 call, 4 Aug 2026). That hope comes at a cost: The value of AMD’s business is 180.9 times its operating profit over the last twelve months, compared to 43.1 times for Broadcom.
What Growth Does Each Share Price Assume?
Today’s price requires Broadcom’s operating profit to increase by 7.7% annually, and AMD’s by 9.4% annually, for an extended period of time, to provide a 10% annual return to investors. This is the assumed growth rate.
The normal growth rate is approximately 4%. Broadcom’s implied growth is approximately 1.9 times that rate, and AMD’s is approximately 2.4 times. This is the essence of AVGO vs AMD Stock 2026.
Operating Returns: Profit Margin × Asset Turnover
Core business profits are operating profits. Margin is the number of cents earned from each dollar of sales that become operating profit, after tax.
How many dollars of sales come from each dollar spent on operating assets is called asset turnover. Calculate the product, and you’ll find a figure that provides a snapshot of how hard the business’s money is working: the return on operating assets.
| Trailing twelve months | Broadcom | AMD |
| After-tax operating margin | 45.1% | 13.1% |
| Asset turnover | 0.692 | 0.715 |
| Return on operating assets | 31.2% | 9.4% |
| Operating profit above the 10% cost of capital | +$27.3bn | −$0.4bn |
| Value of the business ÷ net operating assets | 12.5× | 16.7× |
| Required return | 10% | 10% |
| Implied long-run growth | 7.7% | 9.4% |
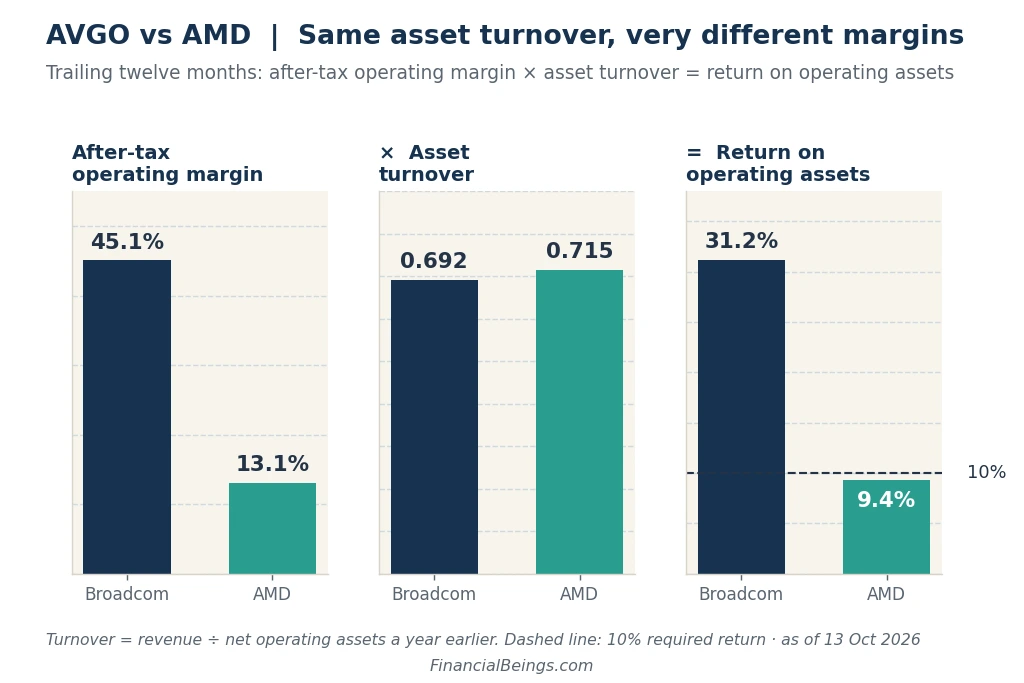
They both work their assets about the same; the difference is margin. Goodwill and the premium it paid for VMware make up part of Broadcom’s assets.
Operating figures are used due to the fact that a higher net income was reported ($2.3bn) than the operating income ($2.0bn) for AMD’s Q2, as reported on 4 Aug 2026 in the 8-K.
This is the pivotal moment that turned AMD’s situation around. It has made its first operating profit above the cost of capital ($0.34bn) after 16 straight quarters below it. The annualised return on operating assets was 12.5%.
Today’s price assumes that quarter becomes normal.
Broadcom got its moment. It generated the highest annualised return on operating assets of 40.2% in the latest quarter (up from 29.2% in the previous quarter), due to revenue growth of 86% compared to a modest increase in net operating assets of 7.2%.
The Growth Each Price Implies
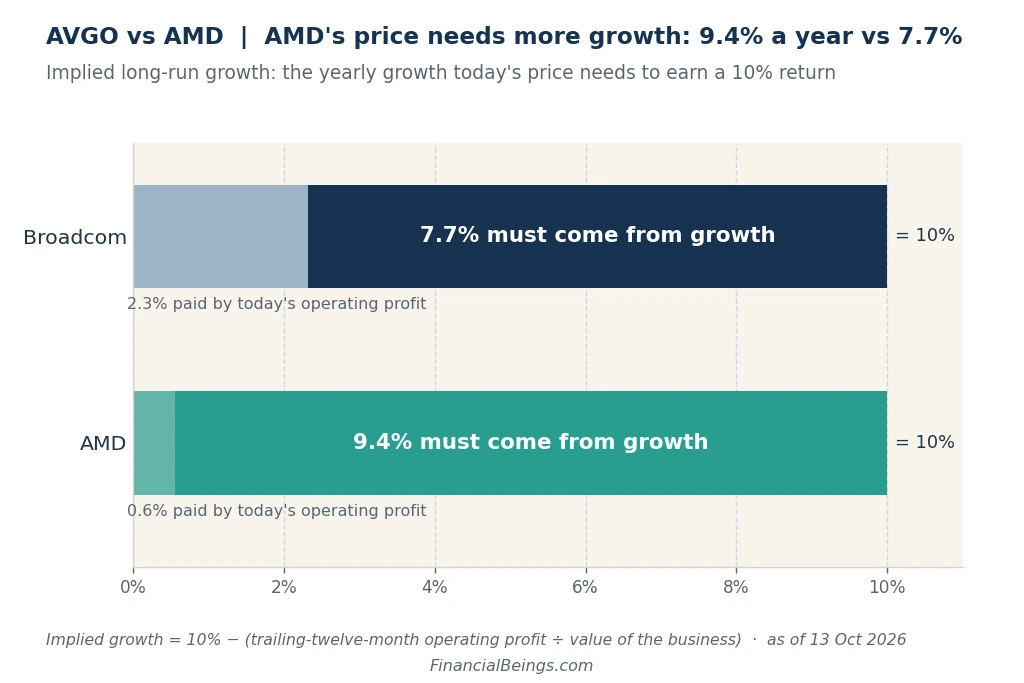
The lines have moved apart. Broadcom’s implied growth was cut from 9.0% in Nov 2024 to 7.7% today, the lowest since Oct 2023. AMD’s climbed from 8.6% in Mar 2026 to 9.4%, its highest since Jun 2024.
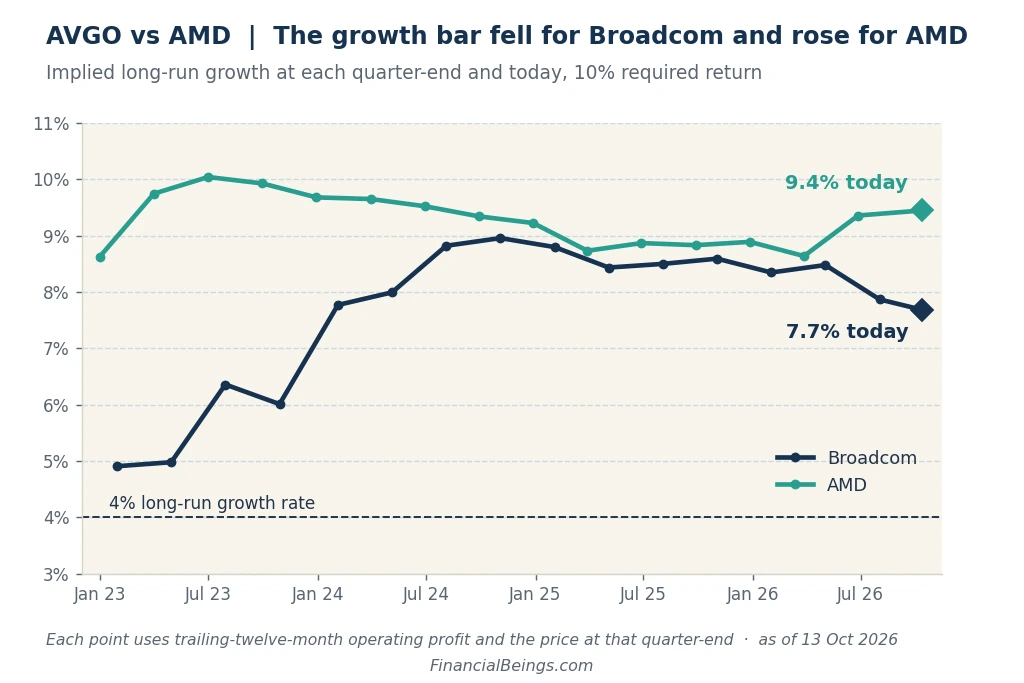
If AMD keeps earning above the 10% bar, its price makes sense. If returns slip back, the price asks a lot.
Why We Start From Today’s Returns, Not Forecasts
We start from the current value of the earnings of each business, before asking what growth the price must sustain and steer clear of creating a lot of price guesswork.
How we calculated these numbers
| Formula | Broadcom (AVGO) | AMD |
| 1. Value of the business = share price × shares + net debt | $357.31 × 4,741m + $38.4bn = $1,732.4bn | $605.53 × 1,630m − $8.7bn net cash = $978.3bn |
| 2. Return on operating assets = after-tax operating margin × asset turnover | 45.1% × 0.692 = 31.2% | 13.1% × 0.715 = 9.4% |
| 3. Implied growth = 10% − (operating profit ÷ value of the business) | 10% − ($40.163bn ÷ $1,732.4bn = 2.3%) = 7.7% | 10% − ($5.408bn ÷ $978.3bn = 0.6%) = 9.4% |
Shares are the fiscal-year-end count, and net debt comes from each company’s latest balance sheet.
Custom AI Chips vs GPUs: Where Does the Risk Sit?
Broadcom makes custom chips for a few big customers, a different model from the GPUs Nvidia sells (see Nvidia vs Broadcom). However, AMD is offering the same GPUs and CPUs to everyone, competing head-to-head with Nvidia.
Broadcom: Custom Accelerators for a Few Large Customers
The risk first: Broadcom has six customers for its custom AI chips, called XPUs, which made up 73% of AI revenue last quarter (Broadcom earnings call, 2 Sep 2026). If one of them were lost, it would be painful.
The case for it: Management expects to generate revenue of around $115bn from AI in fiscal 2027, while VMware contributes steady revenue. For a longer view, read our Broadcom stock forecast to 2030.
AMD: Merchant GPUs and CPUs Against Nvidia
The risk first: Nvidia remains at the top, and the existence of export rules in the United States restricts the use of AMD’s MI308 chip in China.
The case for it: reach. Its Instinct GPUs, EPYC CPUs, and Helios racks are available for any customer. For how AMD stacks up in mobile and edge chips, see AMD vs Qualcomm.
Customer Concentration and Financing Exposure
Concentration is when the majority of revenue comes from a small number of customers. Broadcom’s financing arrangements for AI labs’ chips are a financing risk, not an operations risk.
Dividend, Cash Flow and Balance Sheet
Only Broadcom pays a dividend, and it also carries far more debt.
| Broadcom | AMD | |
| Quarterly dividend (declared 2 Sep 2026) | $0.65 | None |
| Dividend yield ($2.60 ÷ $357.31) | About 0.73% | None |
| FQ3 free cash flow | $13.7bn, 46% of revenue | Not covered |
| Latest balance sheet | $38.4bn net debt (2 Aug 2026) | $8.7bn net cash (27 Jun 2026) |
Free cash flow is the amount of cash that is available after running the business and investing in the business. While Broadcom has plenty of room to cover its dividend, its debt position has less margin of error than AMD’s net cash position.
AVGO or AMD: Which One Fits Your Goals?
It depends on which future you believe in. Here are conditions, not a recommendation.
If You Want Income and Stability
Broadcom has a dividend yield, high margins, and lower growth requirements. Trade-offs: debt and a few large customers.
If You Want Maximum AI Growth Exposure
AMD sells to more customers and has just crossed the 10% bar. But its price already assumes 9.4% growth per year.
If You Already Own Nvidia
AMD competes with Nvidia’s GPUs, so maybe the two will go in tandem (see our Nvidia vs AMD comparison. The other path for Broadcom into AI spending is its custom chips.
Conservative, Base and Growth Cases for Each Stock
| Broadcom | AMD | |
| Conservative case | Profit growth slows toward 4%; today’s price looks stretched | Profit growth slows toward 4%; today’s price looks very stretched |
| Base case | Delivers 7.7% a year for a very long time | Delivers 9.4% a year for a very long time |
| Growth case | Returns stay near the record 40.2% quarter | Quarters above the 10% bar become normal |
What might alter the situation? Broadcom’s fiscal Q4 results are due in December, while AMD’s Q3 results come on 3 Nov 2026.
AVGO vs AMD Stock FAQs
Is AVGO a Better Stock Than AMD?
It all depends on the aim you are looking to achieve. Based on the business, Broadcom is the stronger company in AVGO vs AMD Stock 2026. AMD’s price is more exposed if growth slows, as it implies more growth.
Which Company Has More AI Revenue?
Broadcom: $16.7bn in revenue from AI chips, compared to $6.7bn from AMD for its Data Center business, which includes CPUs for servers.
Which Stock Is Riskier, AVGO or AMD?
Broadcom is down 20.0% from its highest price in our data, and AMD is down 4.0%. AMD’s price, on the other hand, needs operating profit to grow 9.4% annually, as opposed to 7.7% for Broadcom.
Is AVGO or AMD Cheaper?
Broadcom. Its business is worth 43.1 times its operating profit, compared to 180.9 times for AMD, and it requires less growth to justify the price: 7.7% a year versus 9.4%. This is the main difference in AVGO vs AMD stock in 2026.
When Do Broadcom and AMD Report Earnings Next?
AMD earnings are reported after the close on 3 Nov 2026. Broadcom is reporting fiscal Q4 in December of 2026; see its investor site for the reported date.
Sources
- Broadcom Q3 FY2026 release (2 Sep 2026)
- AMD Q2 2026 8-K (4 Aug 2026)
- AMD Q3 2026 earnings-date release
- Bloomberg, Anthropic chip financing (2 Oct 2026)
- FinancialBeings valuation model (13 Oct 2026 close)
