Healthcare companies are some of the most certain long-term investments to make since demand for medicines and medical treatments is likely to be constant, irrespective of economic circumstances. Large pharmaceutical firms are usually considered by investors as a sure source of earnings, dividend income, and expansion in the long term.
AbbVie (ABBV) and Johnson and Johnson (JNJ) are two of the most prevailing healthcare firms that are receiving attention from investors. These two firms are multinational; they have tens of billions of dollars of revenue and have high stakes in pharmaceutical research and healthcare innovation.
Nevertheless, there is often a question that investors pose: ABBV vs JNJ stock, which healthcare giant can be a better investment opportunity in 2026?
ABBV vs JNJ Stock: Price-Per-Share Growth Sensitivity
The growth sensitivity model is an estimation of the change in the intrinsic price per share when the growth is varied under various assumptions. This method assists investors in finding out How growth scenarios affect the intrinsic value of these stocks and whether at sustainable growth levels the stocks are safe?
Growth Sensitivity Comparison (Interactive Chart)
JNJ and ABBV Intrinsic Value Sensitivity Model (2026)
How different long-term growth assumptions change JNJ’s and ABBV’s intrinsic value
| Growth (%) | JNJ | ABBV | ||||
|---|---|---|---|---|---|---|
| Intr. Value ($B) | Price / Share | V/P % | Intr. Value ($B) | Price / Share | V/P % | |
V/P > 100% = The stock screens undervalued under that growth assumption. V/P < 100% = The stock screens overvalued; the market price is ahead of the model value. V/P = 100% = The stock is fairly valued at that scenario.
In the updated dataset, both JNJ and ABBV only reach fair value at the top end of the range. JNJ rises to roughly 114.7% V/P at 9.0% growth, while ABBV reaches about 109.9% V/P at the same assumption. Below that level, both names remain overvalued throughout the sensitivity table.
Note: The model now implies a narrow break-even band right around 9% terminal growth for both companies. That still means the current prices require unusually strong long-term persistence relative to the lower-growth scenarios shown here.
| Growth Rate | JNJ Price/Share | ABBV Price/Share | JNJ Value/Price | ABBV Value/Price |
| 2% | $64.54 | $29.21 | 26.5% | 13.0% |
| 4% | $74.78 | $39.55 | 30.7% | 17.6% |
| 6% | $95.25 | $60.24 | 39.1% | 26.9% |
| 7% | $115.72 | $80.93 | 47.5% | 36.1% |
| 8% | $156.66 | $122.31 | 64.3% | 54.5% |
| 9% | $279.49 | $246.45 | 114.7% | 109.9% |
The table demonstrates that there are several valuable things regarding ABBV vs JNJ stock:
First, both companies Johnson & Johnson as well as AbbVie, their intrinsic market value, under sustainable 6% growth rate scenario only covers 39.1% and 26.9% of their current market cap. The price per share of $95 and $60 (allow for rounding) at 6% growth rate for J&J and ABBV shows that intrinsic value per share is very low as compared to their current trading price per share. That puts investors at risk of losing significant value if growth slows down in future.
Second, the companies need growth rates that are relatively large to surpass current market price. The value-to-price ratio exceeds 100% in both companies only in the case of 9% growth.
Lastly, the intrinsic price curve of Johnson and Johnson is increasing more sluggishly in all the growth scenarios, which means that valuation is stronger, whereas the valuation of AbbVie is increasing faster and faster in higher growth rates.
The higher the perpetual growth to justify the current market price, the riskier it is for investors because they are paying a high price per share today in anticipation of future returns.
ABBV vs JNJ Stock: Company Overview
It is important to have a look at the business structure of every company before conducting a financial analysis.
Johnson & Johnson Business Overview
Johnson and Johnson is a multinational healthcare corporation around the globe that has numerous and diverse healthcare divisions, such as pharmaceuticals and medical technologies. The firm comes up with cures to various major therapeutic fields such as oncology, immunology, heart diseases and neuroscience.
Johnson and Johnson makes a profit based on the various healthcare segments as opposed to the reliance on one group of medicines due to its diversified product portfolio. This diversification will make the financial performance stable and eliminate business risk.
Besides, Johnson and Johnson has a vigorous research and development investment that enables the company to keep inventing new medicines and diversifying its healthcare product range (Yahoo Finance).
The competing stability and specialization are one reason why JNJ vs AbbV stock comparisons seem to be a contest to many investors because of this diversified business model.
AbbVie Business Overview
AbbVie is a major pharmaceutical company that deals mainly with the creation of innovative medicines within fields like immunology, cancer, neuroscience and aesthetics.
AbbVie, in contrast to Johnson and Johnson, is not diversified, as its focus is only on the pharmaceutical revenue instead of diversified healthcare segments. This differentiation enables the firm to make great margins and cash flow whenever its drugs do well.
Nevertheless, it also implies that the financial performance of AbbVie is a bit more vulnerable to the product cycles and the risks of patent expiration.
Due to this organization, the ABBV and JNJ comparative stock analysis tends to display a distinction between diversified healthcare functions (JNJ) and specialized pharmaceutical growth (ABBV).
Revenue, EBITDA, and Free Cash Flow Comparison
Growth in Revenue and cash flow generation would give an idea of how effective the respective companies have transformed their business practices into financial performance.
Johnson & Johnson Revenue and Cash Flow Trends
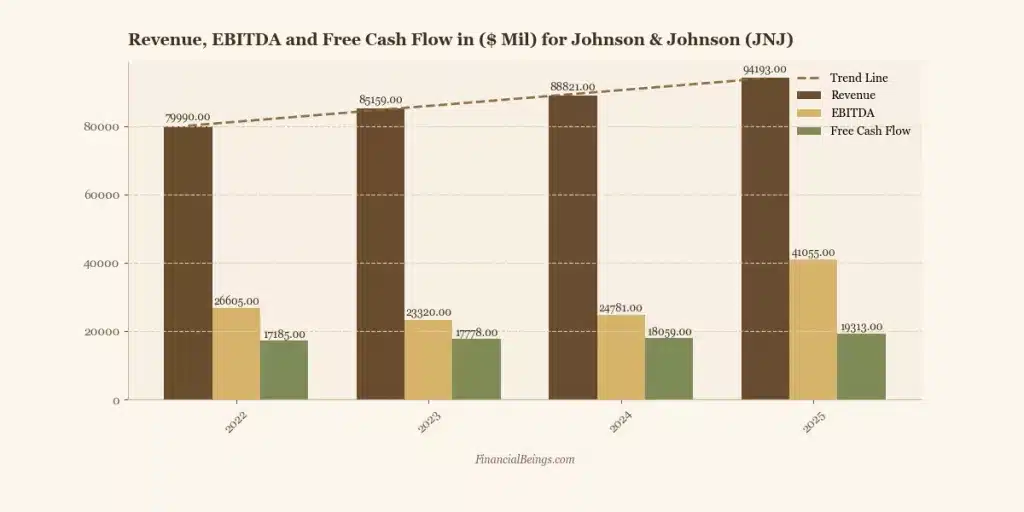
Figure 1: Revenue, EBITDA, and Free Cash Flow for Johnson & Johnson (2022–2025)
| Year | Revenue ($ Mil) | EBITDA ($ Mil) | Free Cash Flow ($ Mil) |
| 2022 | 79,990 | 26,605 | 17,185 |
| 2023 | 85,159 | 23,320 | 17,778 |
| 2024 | 88,821 | 24,781 | 18,059 |
| 2025 | 94,193 | 41,055 | 19,313 |
There is steady increase in revenues of Johnson and Johnson over the four years. The revenue grew in 2022 through to 2025, with an increase of $79,990 million to $94,193 million, and this shows a consistent growth of the healthcare business of the company.
The gain in free cash flow over the years, though, not drastic but consistent makes the company a stable generator of cash after adjusting for capital expenditures. This stead expansion helps in dividend distributions, research expenditure and long-term capital distribution.
The best change of all is reflected in EBITDA that shot to $41,055 million in 2025 as compared to $24,781 million in 2024. This implies that there is a drastic increase in operating profitability.
AbbVie Revenue and Cash Flow Trends
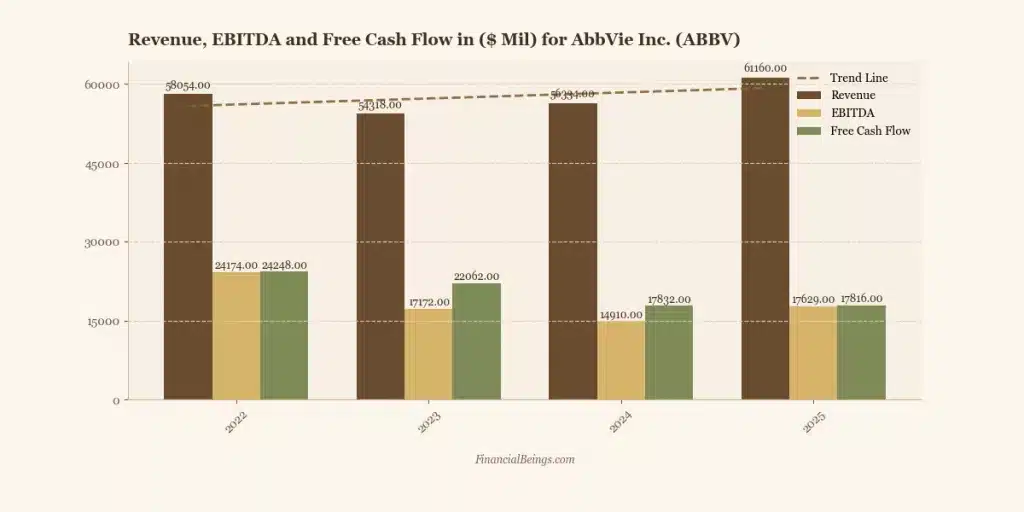
Figure 2: Revenue, EBITDA, and Free Cash Flow for AbbVie (2022–2025)
| Year | Revenue ($ Mil) | EBITDA ($ Mil) | Free Cash Flow ($ Mil) |
| 2022 | 58,054 | 24,174 | 24,248 |
| 2023 | 54,318 | 17,172 | 22,062 |
| 2024 | 56,334 | 14,910 | 17,832 |
| 2025 | 61,160 | 17,629 | 17,816 |
AbbVie has a higher variability in its financial performance compared to Johnson & Johnson. The revenue fell from $58,054 million to $54,318 million, for years 2022 and 2023 respectively, and then returned to $61,160 million in 2025.
The strong free cash flow was maintained during the period; however, it fell to an amount of $17,816 million in 2025 as compared to $24,248 million in 2022.
Though this has been decreasing, AbbVie has relatively high free cash flow with regard to its revenue size, and this acts as evidence of an efficient pharmaceutical business.
Johnson and Johnson has proven to be more stable than AbbVie, thus making it more volatile.
Profitability Comparison: Gross, Operating, and Net Margins
The profitability margin is a metric that is used to measure how efficient a company is in terms of converting revenues to profits.
Johnson & Johnson Profitability Profile
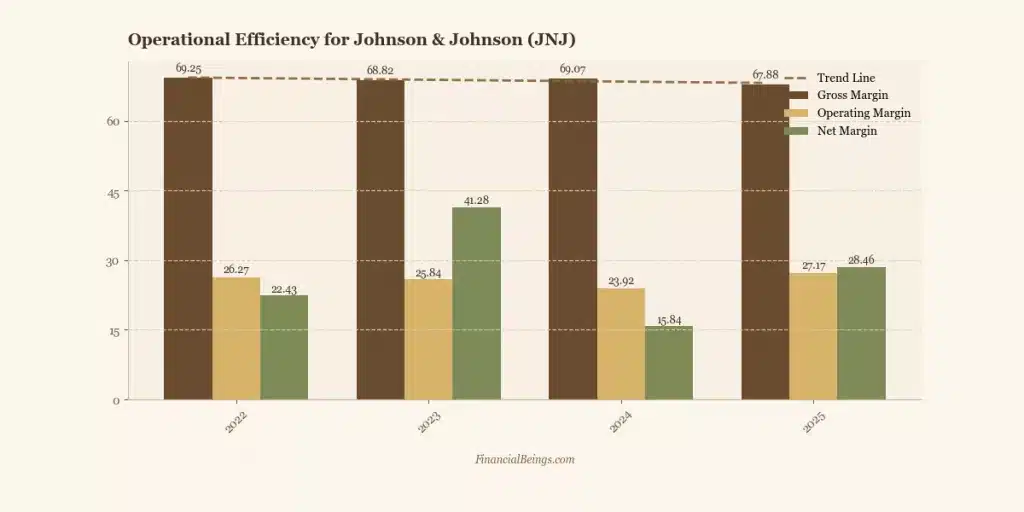
Figure 3: Operational Efficiency for Johnson & Johnson
| Year | Gross Margin | Operating Margin | Net Margin |
| 2022 | 69.25% | 26.27% | 22.43% |
| 2023 | 68.82% | 25.84% | 41.28% |
| 2024 | 69.07% | 23.92% | 15.84% |
| 2025 | 67.88% | 27.17% | 28.46% |
Johnson and Johnson have gross margins which are very steady, ranging between 67 per cent and 69 per cent. These are very high margins that point to the high pricing power of its pharmaceutical and medical products.
The company has operating margins that are above 23%, which is an indication of effective management of costs in the operations of the company.
The changes in the net margin fluctuate due to changes made in accounting, but the company continues to record high levels of profitability overall.
AbbVie Profitability Profile
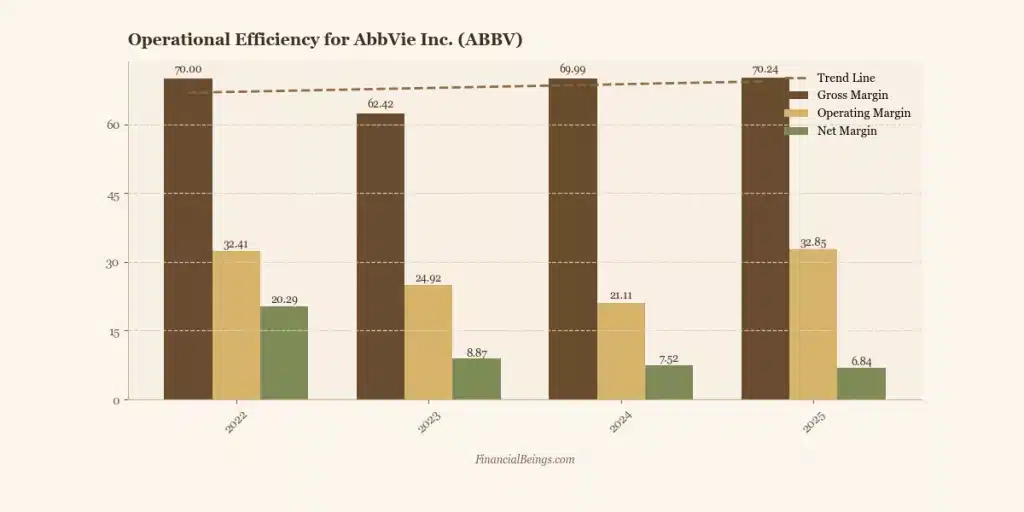
Figure 4: Operational Efficiency for AbbVie
| Year | Gross Margin | Operating Margin | Net Margin |
| 2022 | 70.00% | 32.41% | 20.29% |
| 2023 | 62.42% | 24.92% | 8.87% |
| 2024 | 69.99% | 21.11% | 7.52% |
| 2025 | 70.24% | 32.85% | 6.84% |
AbbVie has a slightly higher gross margin than Johnson & Johnson, which amounts to 70.24 percent in 2025.
Nevertheless, the net margins worsened considerably in the period, as they dropped to 20.29 percent in 2022 and 6.84 percent in 2025.
This loss indicates the increase in operational costs or changes in Product revenue mix.
Dividend Comparison: ABBV vs JNJ Income Strength
One of the primary reasons why investors study ABBV vs JNJ stock is the dividend income.
Johnson & Johnson Dividend Growth and Sustainability
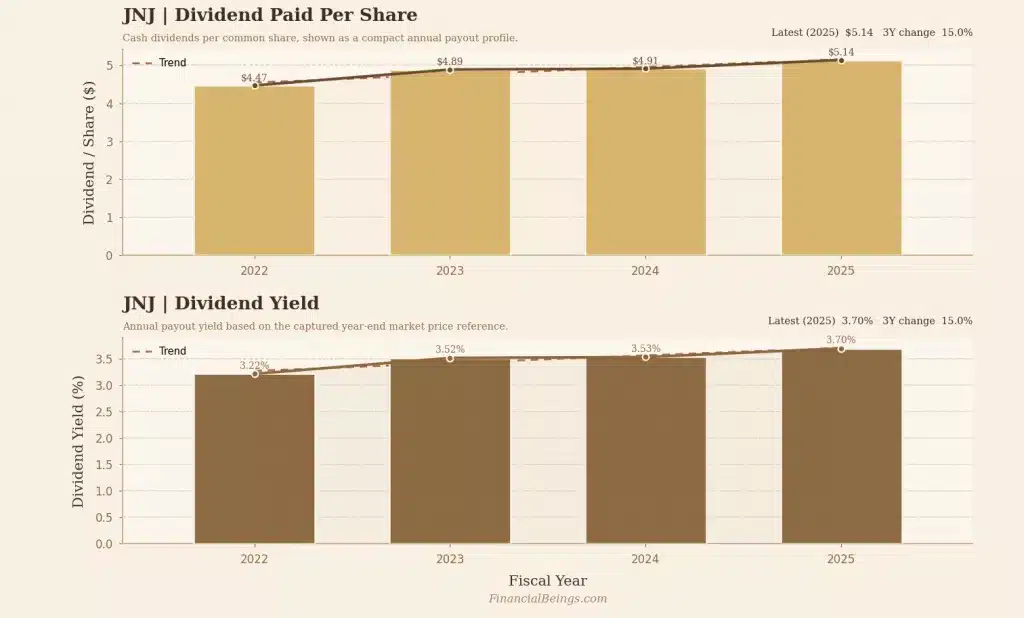
Figure 5: Johnson & Johnson Dividend Per Share and Dividend Yield
| Year | Dividend/Share | Dividend Yield |
| 2022 | $4.47 | 3.22% |
| 2023 | $4.89 | 3.52% |
| 2024 | $4.91 | 3.53% |
| 2025 | $5.14 | 3.70% |
Johnson and Johnson has a consistent dividend increase. The dividend per share rose by 0.7 per cent as of 2025 up to $5.14, compared to $4.47 in 2022.
The dividend yield has also picked up slowly from 3.22% to 3.70%.
AbbVie Dividend Yield and Income Outlook
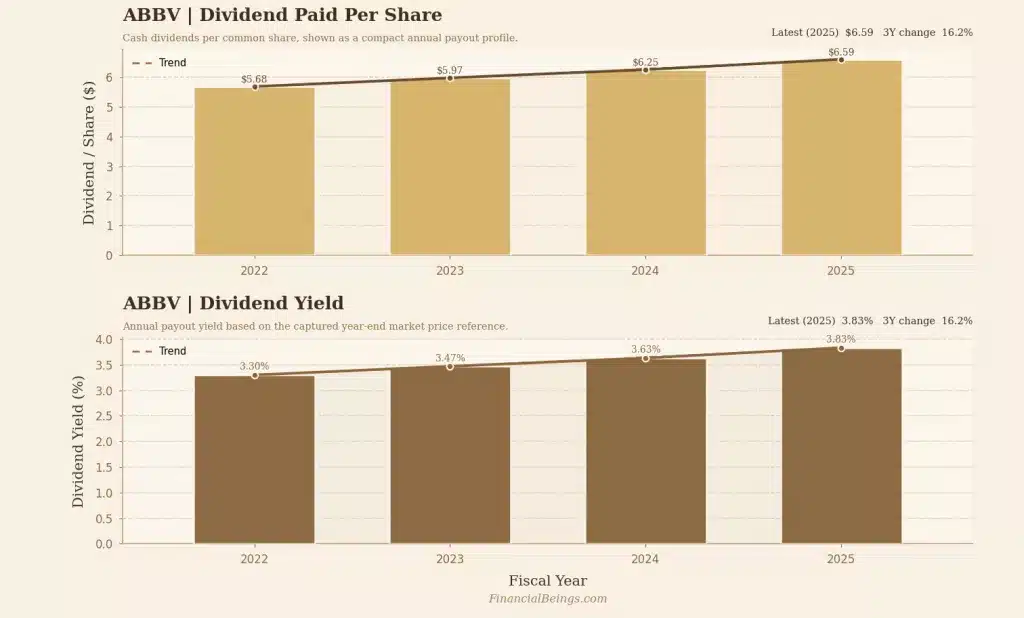
Figure 6: AbbVie Dividend Per Share and Dividend Yield
| Year | Dividend/Share | Dividend Yield |
| 2022 | $5.68 | 3.30% |
| 2023 | $5.97 | 3.47% |
| 2024 | $6.25 | 3.63% |
| 2025 | $6.59 | 3.83% |
AbbVie also pays dividends at a higher rate than Johnson and Johnson. Dividend rates went up to $6.59 in 2025 compared to $5.68 per share in 2022.
In 2025, the dividend yield stood at 3.83%, which is a little higher than Johnson and Johnson.
Valuation Comparison: ABBV vs JNJ Stock
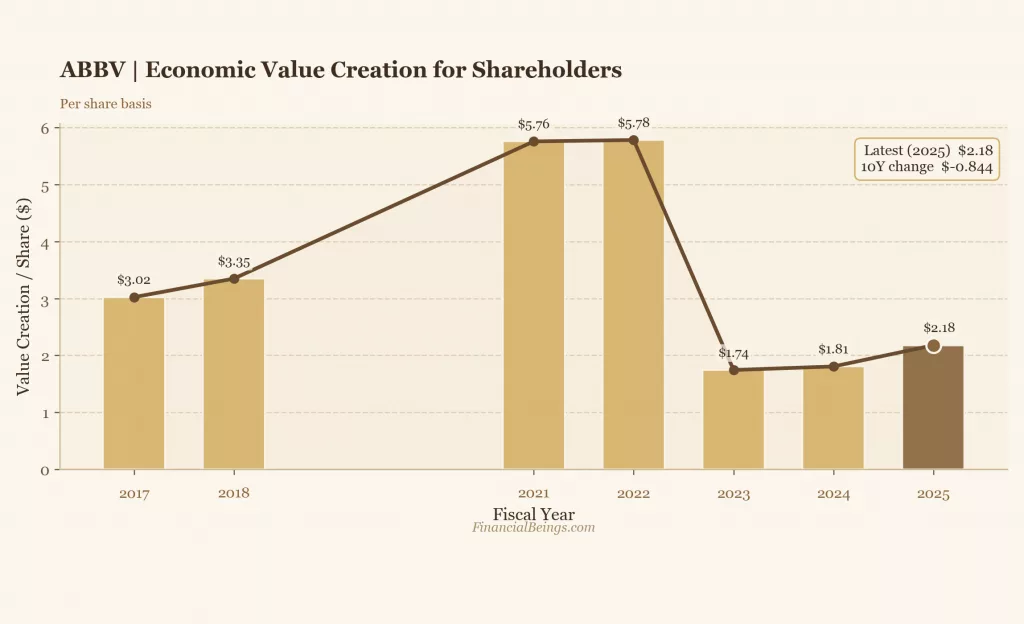
Figure 7: Economic Value Creation per Share – AbbVie
The economic value creation of AbbVie after adjusting for cost of capital went down to $2.18 in 2025, compared to a $5.78 in 2022, which represents a declining value creation trajectory for investors.
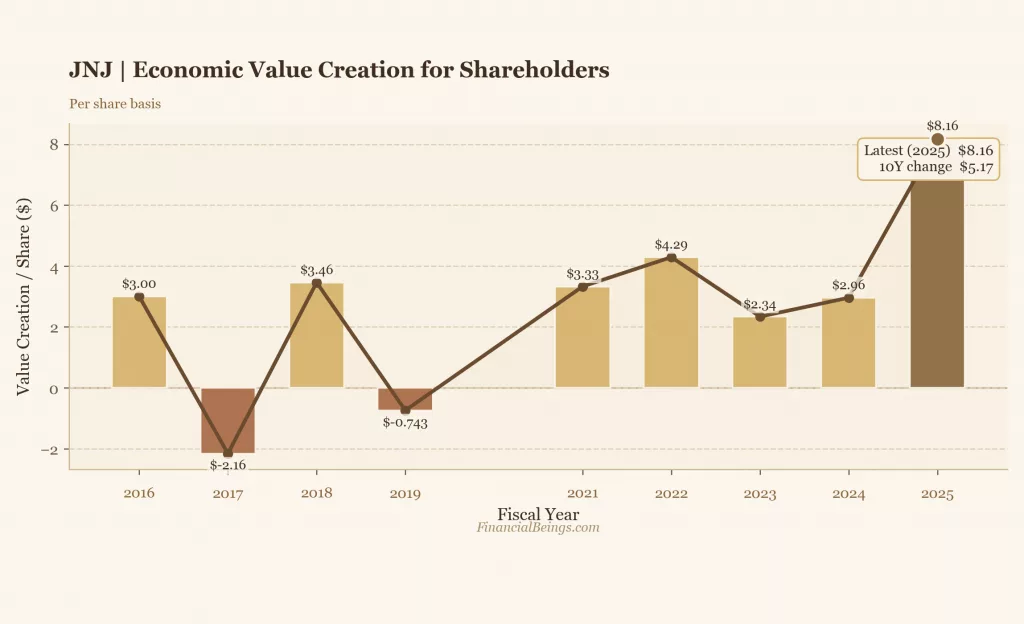
Figure 8: Economic Value Creation per Share – Johnson & Johnson
Johnson and Johnson enhanced value creation to $8.16 per share in 2025, which is higher than AbbVie and a good sign for investors.
Portolio Recommendations
Growth Portfolio
The investors of high growth, high risk portfolios may have positions in both of these stocks if they believe that a very high perpetual growth rate of 9% is attainable in the future for both the companies.
Balanced Portfolio
The investors should be careful as they may seem these companies as a good income source but do not over-expose your positions, rather keep the positions small and wait for a good entry point where the V/P reaches above 80% even at 4%-6% range as it will offer them ample margin of safety.
Conservative Portfolio
It is usually not safe for investors who are interested in preserving the capital because both stocks have aggressive growth rates currently shown by their share prices. This makes both of these companies highly volatile and prone to eroding significant market value in case the growth slows down.
RNOA Sustainability
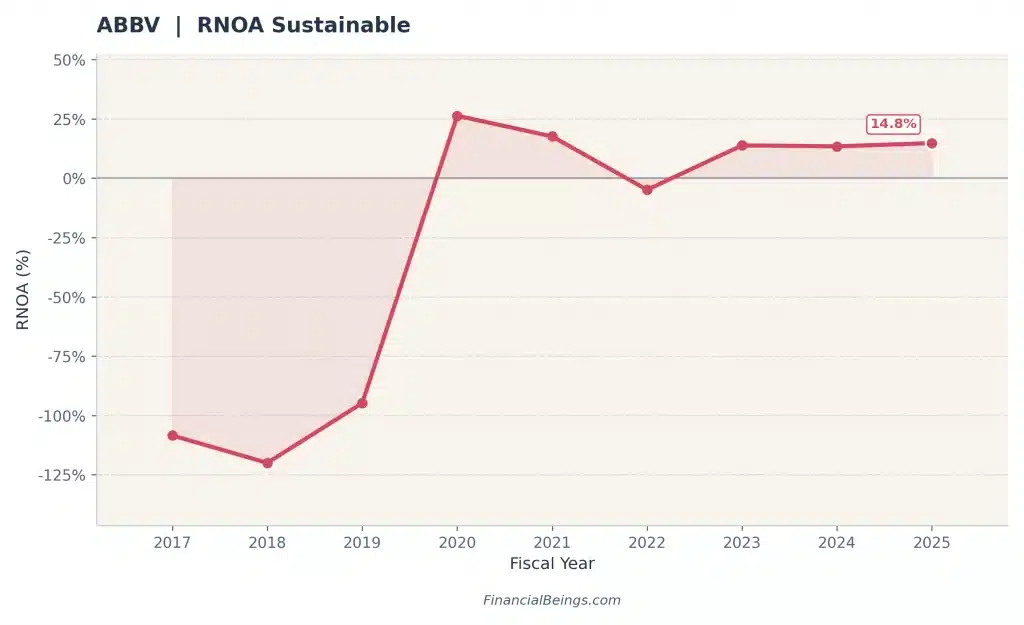
Figure 9: AbbVie Sustainable RNOA
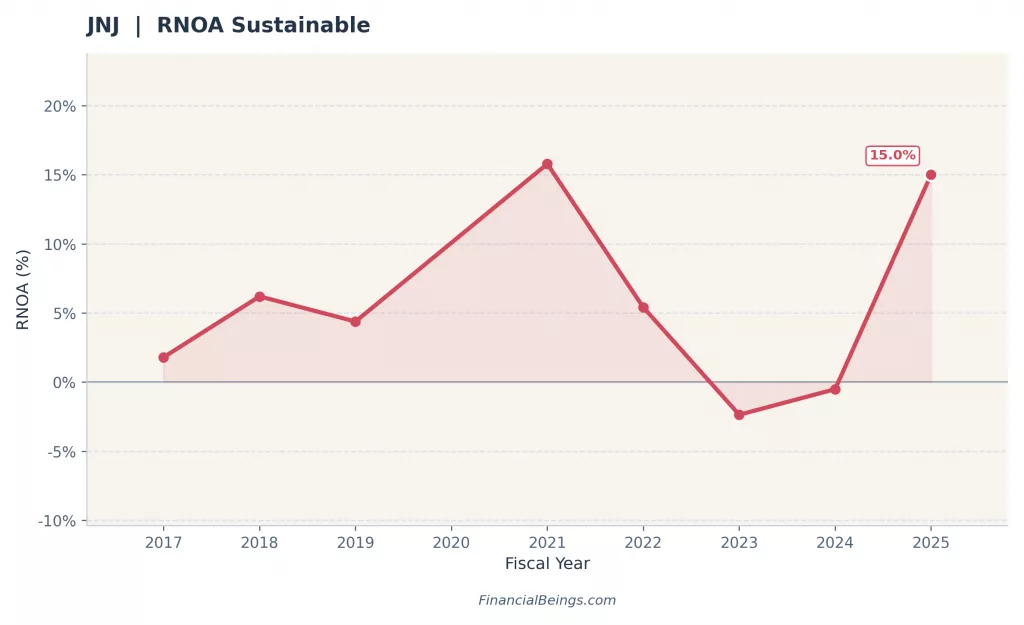
Figure 10: Johnson & Johnson Sustainable RNOA
| Fiscal Year | AbbVie RNOA (%) | Johnson & Johnson RNOA (%) |
| 2017 | -110% | 2% |
| 2018 | -120% | 6% |
| 2019 | -95% | 4% |
| 2020 | 26% | 10% |
| 2021 | 18% | 16% |
| 2022 | -5% | 5% |
| 2023 | 14% | -2% |
| 2024 | 13% | -1% |
| 2025 | 14.8% | 15.0% |
- AbbVie suffered significant negative RNOA values at the beginning of the period, with the highest of approximately -120% in 2018, and later in 2020, the value was better at approximately 26%.
- AbbVie stabilized its operational returns to 13-15% per cent in the period between 2023 and 2025 after fluctuating.
- Johnson and Johnson has a more stable performance in terms of RNOA, which has stayed largely positive over time.
- In 2021, JNJ hit approximately 16% and then dropped temporarily in 2023, 2024, and finally returned to 15.0% in 2025.
- The sustainable RNOA levels of both companies are quite similar in 2025, as AbbVie is 14.8% and JNJ is 15.0%, which shows that both companies have similar operating efficiency.
Key Risks Investors Should Understand
Johnson & Johnson Risks
Johnson and Johnson is a company that is involved in a complex healthcare environment that presents the company with a number of risks. Among the risks, legal and regulatory risks should be considered, because healthcare companies should operate and act according to the strict medical and pharmaceutical regulations.
The other risk is the competition within the medical technology and pharmaceutical market. Due to the emerging healthcare technologies, businesses should invest constantly in research and development to remain relevant in the market.
The fluctuations in the RNOA in the year 2023 and 2024, when there was a momentary negative in the returns, also indicate that the operational efficiency can be influenced by industry pressures or internal restructuring. Even though the company has recovered in 2025, investors should realize that healthcare businesses are prone to volatility of operations.
AbbVie Risks
AbbVie is exposed to various risks unlike Johnson and Johnson. Expiration of patents is one of the biggest risks to the company, as it can lessen the level of revenue in the case when other companies introduce generic substitutes.
Revenue concentration is another issue of importance. A few successful companies frequently serve as the basis of pharmaceutical firms, and, therefore, fluctuations in the demand of products or rivalry can have a drastic impact on financial results.
This sensitivity is also indicated. AbbVie had very high negative values of RNOA during the previous years, which is a sign of the operational difficulties that the company faced before becoming efficient. Though the company succeeded in stabilizing its RNOA at 14-15% today, the previous volatility implies that the revenues in the pharmaceutical industry might vary based on the performance of the products and market factors.
ABBV vs JNJ Stock: Which Company Has the Stronger Investment Case?
The comparison of AbbVie and Johnson & Johnson provides that the two companies stand in a strong position in the international healthcare market, yet they can be offered to investors as a strength in different ways.
The RNOA of Johnson & Johnson has more stability in the long run. The company was able to achieve positive returns in most of the years, and it regained itself strongly to reach 15% RNOA in 2025. This means that Johnson and Johnson is enjoying the diversified business model comprising pharmaceuticals, medical technology, and healthcare products.
In the case of AbbVie, it demonstrates a good turnaround story. The company has decreased the very negative values of the RNOA in the previous years to positive returns of over 14% in 2025. This gain indicates that AbbVie was able to enhance its profitability and its operating efficiency.
Thus, the investment decision is based on the aim of the investor. Johnson and Johnson can be chosen by investors who want to get more stability and diversity, whereas AbbVie can be chosen by investors who want to get more profitability and turnaround in pharmaceutical companies.
Final Verdict: Is ABBV or JNJ the Better Stock for 2026?
The ABBV vs JNJ stock analysis indicates that the two firms continue to be good long-term healthcare stocks.
Johnson and Johnson has a stable performance in terms of its operations, as indicated by its stable pattern of RNOA and has recovered to 15% by 2025. The diversified healthcare operations allow the company to have no reliance on a single product or source of revenue that can be considered to generate consistent returns in the long-term.
AbbVie has a different investment profile. There were major operation-related issues within the company in the past, although it indicates a noticeable turnaround with the RNOA increasing to 14.8% in 2025. This implies that AbbVie has enhanced its operational performance and profitability.
The current growth rate implied in the current market price of 9% shows that both the stocks are aggressively priced. They are priced with no sufficient margin of safety. If investors are concerned with dividends they may consider Johnson & Johnson over AbbVie but at the cost of high risk, if the growth slows down.
All calculations and valuation estimates are FinancialBeings’ own, based on data sourced from SEC filings of JNJ (10K and 10Q) and ABBV (10K and 10Q), use or reproduction before prior approval is prohibited.
Usama Ali
Usama Ali is the founder of Financial Beings and a self-taught investor who blends classic valuation study with insights from psychology. Inspired by works from Benjamin Graham, Aswath Damodaran, Stephen Penman, Daniel Kahneman, and Morgan Housel, he shares independent, data-driven research to help readers connect money, mind, and happiness.
Disclaimer
The content provided herein is for informational purposes only and should not be construed as financial, investment, or other professional advice. It does not constitute a recommendation or an offer to buy or sell any financial instruments. The company accepts no responsibility for any loss or damage incurred as a result of reliance on the information provided. We strongly encourage consulting with a qualified financial advisor before making any investment decisions.
