

Abbott vs Medtronic stock presents a choice between Abbott’s potential to rebuild operating returns and Medtronic’s lower growth requirement in the historical model. Both businesses report healthy sales growth, but their margins and use of operating capital tell different stories. Abbott can improve if the earnings from its enlarged business catch up with its asset base and acquisition costs ease.
Our view as of October 26, 2026: Abbott remains a credible improvement candidate, supported by its historical returns and identifiable operating levers. Medtronic currently offers the stronger quarterly return and higher dividend yield. Abbott’s investment case depends on converting growth into better margins and asset turnover, with progress measured against the operating capital committed to the business.
The financial model covers Abbott through June 2026 and Medtronic through July 2026. Abbott’s subsequent September earnings release informs the growth discussion. Medtronic’s model figures include MiniMed before its October separation.
ABT vs MDT at a glance as of October 26, 2026
| Measure | Abbott | Medtronic |
| Workbook reference share price | $103.70 | $95.41 |
| Recent underlying sales growth | 7.0% comparable in Q3 | About 7% excluding extra week in Q1 FY27 |
| Model NOPAT implied g using annual inputs | 6.66% | 6.36% |
| Model NOPAT implied g using quarterly inputs | 7.21% | 5.77% |
| Latest sustainable operating profit margin | 11.26% | 16.34% |
| Latest annualised asset turnover | 0.627x | 0.538x |
| Latest annualised sustainable RNOA | 7.05% | 8.79% |
| Trailing sustainable RNOA | 10.57% | 9.22% |
| Annualised dividend per share | $2.52 | $2.88 |
| Dividend yield at reference price | 2.43% | 3.02% |
| P/E on adjusted EPS guidance midpoint | 18.8x FY2026 | 16.0x FY2027 before separation adjustment |
| Business separation | Nutrition planned by end of 2027 | MiniMed completed October 15, 2026 |
Model prices are dated October 23 for Abbott and October 24 for Medtronic. Quarterly returns cover different reporting periods. Medtronic’s legacy earnings, share count and valuation inputs require rebasing for the completed MiniMed separation.
What Growth Is Each Share Price Betting On?
Abbott carries the higher growth requirement in the historical model, particularly with quarterly inputs. Its price can become easier to justify if margins recover and the acquired business earns more on its capital. Medtronic’s modeled operating earnings yield is higher, but the calculation includes its former Diabetes business and needs rebasing after separation.
The Growth Each Price Implies
NOPAT means net operating profit after tax. The model calculates implied growth as the 10% required return less NOPAT divided by enterprise value. Using annual inputs produces 6.66% for Abbott and 6.36% for Medtronic. Using trailing quarterly operating earnings and updated debt produces 7.21% and 5.77%, respectively. Our guide on how to find the growth rate of a stock explains this approach in more detail.
The quarterly figures correspond to operating earnings yields of 2.79% and 4.23%. These implied rates are valuation assumptions, rather than forecasts of sales growth. Abbott’s quarterly calculation also incorporates much more debt following the Exact Sciences acquisition than its annual calculation.
Forward P/E on Company Guidance
Abbott’s $5.50-$5.55 adjusted EPS guidance implies roughly 18.8 times earnings at $103.70. Medtronic’s previously announced $5.94-$6.00 FY2027 range implies about 16.0 times at $95.41. The latter included Diabetes and is a legacy reference, rather than a clean continuing-business multiple. Abbott guidance and Medtronic guidance.
Trailing P/E is less informative when taxes, acquisition charges and changing business ownership distort the earnings denominator.
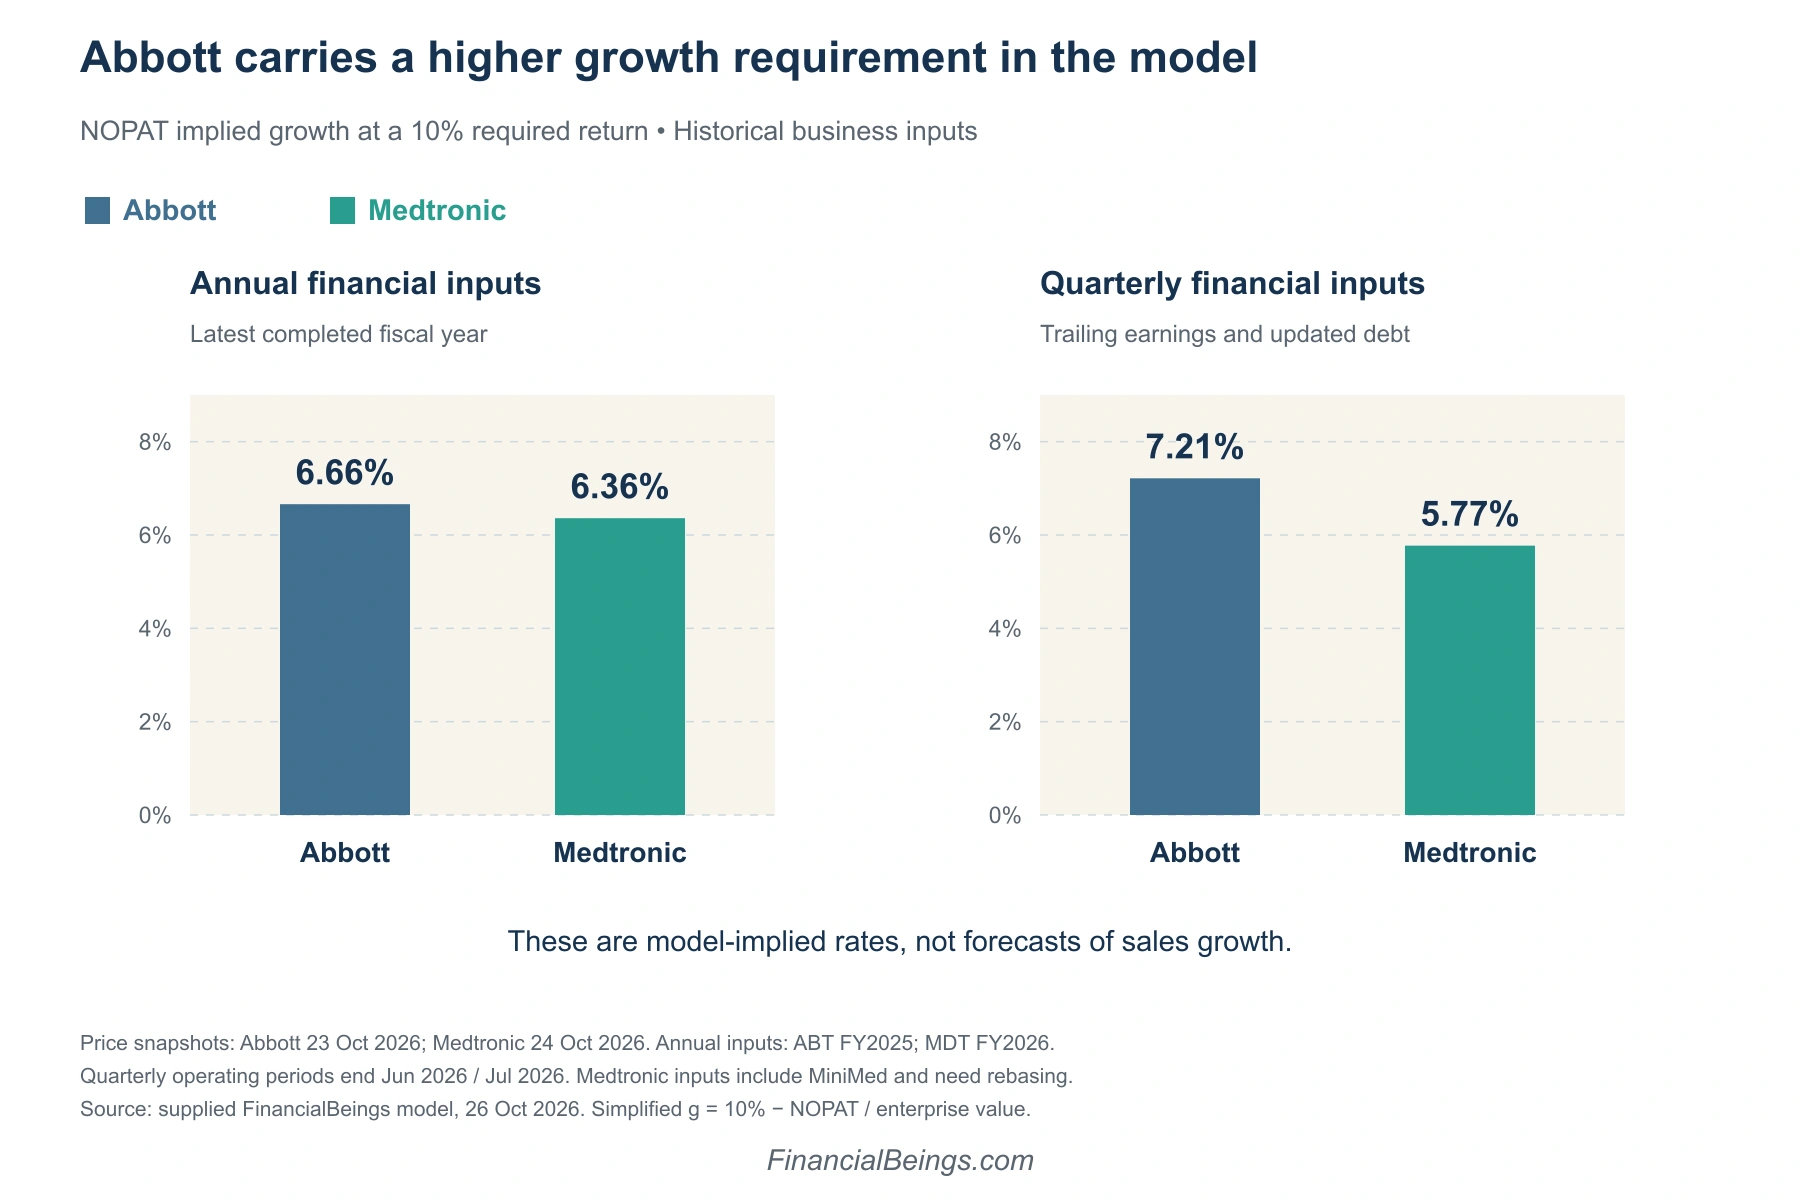
The two calculations use different earnings and debt bases. Medtronic figures retain the historical MiniMed business perimeter.
Which Business Earns Better Returns on Its Assets?
Abbott retains the stronger historical and trailing return, while Medtronic leads in the latest individual quarter. Abbott still generates more sales per dollar of operating capital, but its margin has weakened enough to reverse the quarterly ranking. The useful question is how much of that deterioration Abbott can repair through operating improvement. For another view of Abbott against a healthcare peer, see our Abbott vs AbbVie intrinsic value analysis.
Profit Margin vs Asset Turnover
Return on net operating assets, or RNOA, equals after-tax operating profit margin multiplied by asset turnover. For Abbott FY2025, its 15.04% sustainable margin and 0.803x turnover produced approximately 12.07% RNOA. For Medtronic FY2026, its 15.76% margin and 0.553x turnover produced 8.71%.
The quarterly picture has changed. Abbott’s sustainable margin is 11.26% and annualised turnover is 0.627x, producing 7.05% RNOA. Medtronic’s corresponding figures are 16.34%, 0.538x and 8.79%. Sustainable margins here use sustainable operating income divided by sales, keeping the decomposition consistent.
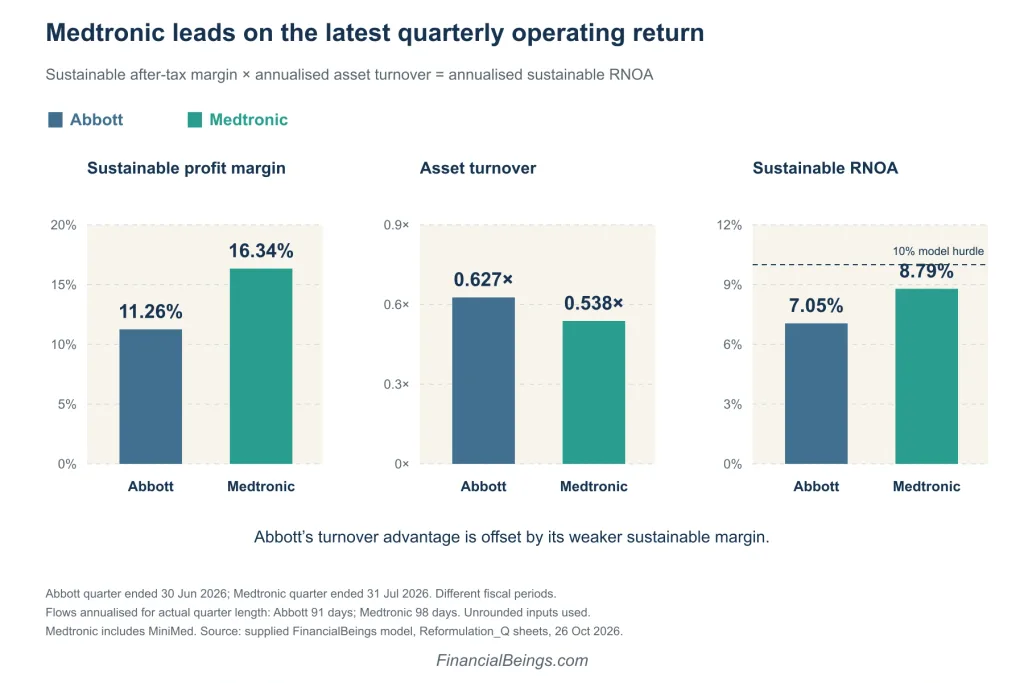
Abbott generates more sales per dollar of operating capital, while Medtronic’s higher sustainable margin produces the stronger latest quarterly return.
How Exact Sciences and MiniMed Change the Picture
Abbott’s operating assets expanded following Exact Sciences. Net operating assets reached $79.97 billion in June, up 37.6% year over year, against sales growth of 13.0%. The acquisition added substantial goodwill and intangible assets. Those assets enter the return calculation before the business has demonstrated its eventual earnings contribution. Abbott Q2 filing.
Trailing sustainable RNOA remains 10.57% for Abbott and 9.22% for Medtronic. Abbott’s trailing calculation uses capital from before the acquisition, so its latest quarterly return provides an important additional measure. Medtronic’s historical return includes the subsequently separated Diabetes business.
Both latest quarterly returns remain below the model’s 10% required return. Trailing sustainable residual operating income is approximately positive $332 million for Abbott and negative $516 million for Medtronic. Abbott therefore has a remaining trailing economic-profit advantage, but its recent capital deployment must generate more earnings to preserve it.
How Can Abbott Improve Its Operating Returns?
Abbott can improve through higher sustainable margins and more sales from its operating asset base. The model identifies expense control and acquisition productivity as the main opportunities. Illustratively, a 13.5% margin and 0.75x turnover would lift RNOA just above 10%, without requiring a return to Abbott’s strongest historical results.
Recover Margins Through Operating Costs
Abbott’s sustainable margin fell from 15.22% to 11.26% year over year. SG&A rose from 27.74% to 31.96% of sales, R&D from 6.51% to 7.08%, and the model’s other operating-cost burden from 2.35% to 4.10%.
The workbook’s gross-margin line, before separately classified intangible amortisation, improved. Abbott’s reported gross margin after amortisation was broadly flat to slightly lower. Integration expenses, legal reserves and acquired-business costs help explain the difference between growing sales and weaker operating earnings. Abbott cost discussion.
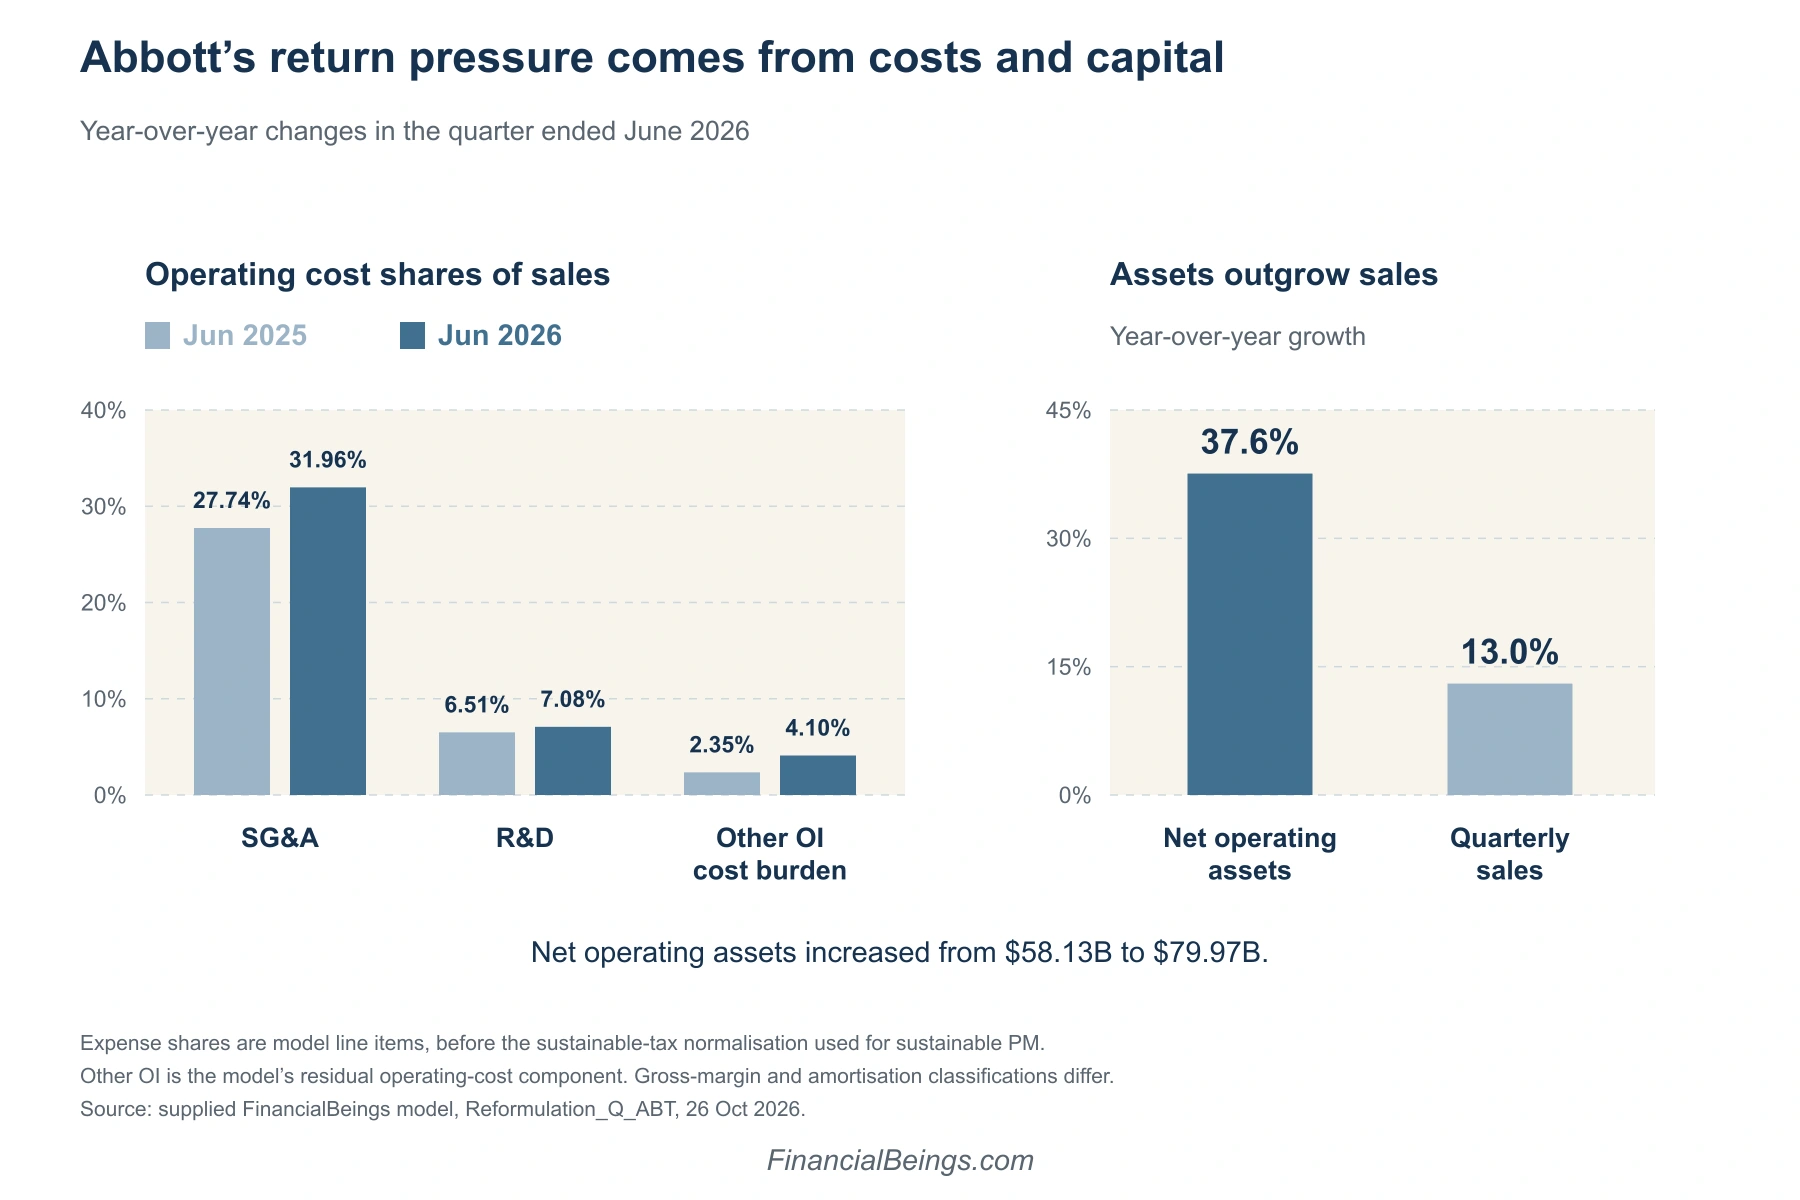
Expense intensity and the enlarged operating asset base explain the pressure on Abbott’s latest quarterly return.
Recovery would mean SG&A growing more slowly than sales as temporary costs ease. Cutting productive research indiscriminately could weaken future growth. The more useful objective is better commercial and administrative efficiency while supporting products that earn attractive returns.
Generate More Revenue From the Enlarged Asset Base
Annualised turnover declined from 0.790x to 0.627x. The largest increase in capital intensity sits in other operating assets. Receivables intensity was broadly stable and inventory intensity improved, which points toward acquisition-related capital rather than a broad working-capital deterioration.
Revenue growth that outpaces further asset investment would improve turnover. Better use of the acquired business, disciplined capital spending and working-capital control can contribute. A goodwill write-down alone would change an accounting denominator without demonstrating improved cash generation.
Illustrative Abbott operating scenarios using the latest quarterly model base
| Scenario | Sustainable margin | Annualised ATO | Annualised RNOA |
| Current quarterly base | 11.26% | 0.627x | 7.05% |
| Margin improvement only | 13.50% | 0.627x | 8.46% |
| Turnover improvement only | 11.26% | 0.750x | 8.44% |
| Combined improvement | 13.50% | 0.750x | 10.13% |
Scenarios are arithmetic illustrations, not forecasts or share-price targets. Calculations use unrounded base values.
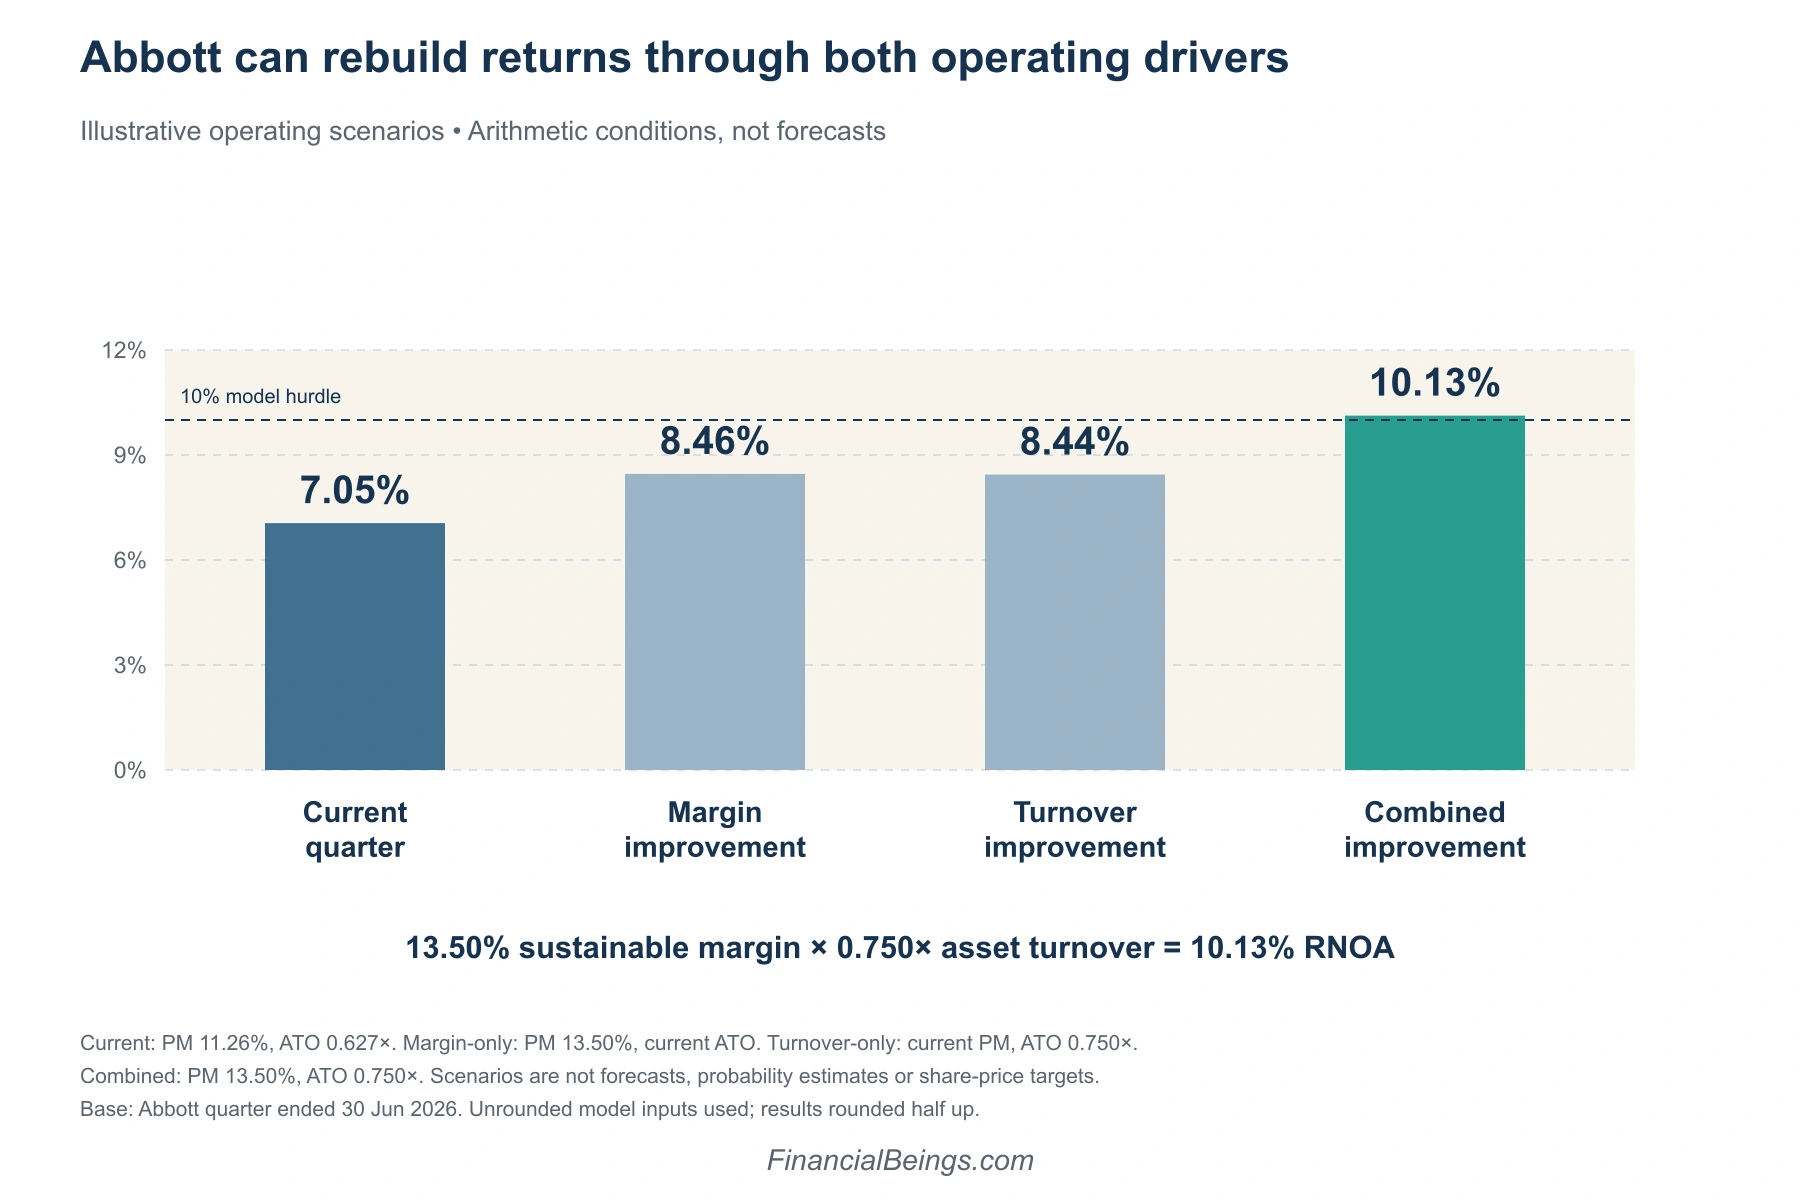
Improving both sustainable margin and asset turnover can cross the model’s 10% hurdle. These scenarios describe conditions, not predictions.
At unchanged turnover, Abbott would need approximately a 15.96% sustainable margin to earn 10% RNOA. At unchanged margin, turnover would need to reach about 0.8885x. Improvement across both drivers offers a less demanding combination than relying entirely on either one.
Measure Progress Against Medtronic
Medtronic’s sustainable margin increased from 14.29% to 16.34% year over year, while turnover edged up from 0.523x to 0.538x. Its RNOA improved from 7.47% to 8.79%, mainly through lower other operating costs and R&D intensity. Abbott’s recovery should similarly appear in operating profit and capital productivity, rather than sales growth alone.
Which Company Is Growing Faster?
The latest published releases suggest broadly similar underlying growth around 7%, despite headline rates above 13%. Abbott’s comparison includes acquisition effects, while Medtronic benefited from an additional fiscal week. The calculations cover different quarters and use different company definitions, so they establish a broad comparison rather than an exact like-for-like ranking.
Abbott 14.5% Reported and 7% Comparable
Abbott’s September-quarter sales reached $13.013 billion, up 14.5% reported and 7.0% comparable. Its comparable measure includes Exact Sciences in both periods and adjusts for currency and specified agreement revenue. Adjusted EPS rose 9.2% to $1.42, while GAAP EPS fell 43.6% to $0.53. The model’s detailed returns remain based on the June 10-Q. Abbott Q3 results.
Medtronic 13.7% Organic and About 7% Without the Extra Week
Medtronic reported $9.756 billion of July-quarter revenue and 13.7% organic growth. Its organic reconciliation shows $9.652 billion against $8.489 billion a year earlier. Subtracting management’s estimated $570 million extra-week benefit from the current-period amount gives approximately 7.0% growth. This is an estimate using rounded disclosures. The model’s annualised quarterly ratios already adjust for the longer period. Medtronic Q1 results.
How Do the Two Break-Ups Change What You Own?
The transactions change the assets and earnings shareholders own, with different mechanics. Abbott plans to distribute shares in a separate Nutrition company. Medtronic completed an exchange offer for MiniMed shares. Each transaction requires investors to reconsider continuing earnings, debt and share counts before treating historical valuation ratios as measures of the remaining business.
Medtronic’s MiniMed Split-Off Completed October 15, 2026
Medtronic exchanged its remaining MiniMed stake for approximately 55.0 million Medtronic shares and retained no MiniMed equity. Investors whose tendered shares were accepted received MiniMed shares; investors who retained MDT shares continue to own Medtronic. This was an elective exchange, rather than a proportional distribution to every shareholder. Separation filing. MiniMed now operates as a standalone diabetes-device company, a market we also examine in our Dexcom stock analysis.
Abbott’s Nutrition Spin-Off Expected by End of 2027
Abbott intends to distribute Nutrition company shares to its shareholders. Management expects the remaining Abbott to have faster growth and an expanded margin profile. The return benefit depends on the capital, earnings and separation costs assigned to each company; removing revenue alone cannot establish an improvement. Completion remains subject to approvals and other conditions. Abbott separation announcement.
Which Pays the Better Dividend Abbott or Medtronic?
Medtronic offers the higher indicated yield at the model’s reference prices, while Abbott has the longer current record of annual increases. Both distributions should be assessed alongside earnings and cash generation. Abbott’s planned separation concerns the combined dividend from two companies, and Medtronic’s continuing dividend capacity must reflect the business remaining after MiniMed.
Yield and Coverage Today
Abbott’s $0.63 quarterly dividend annualises to $2.52, or 2.43% at $103.70. Medtronic’s $0.72 annualises to $2.88, or 3.02% at $95.41. Against adjusted EPS guidance midpoints, payout ratios are roughly 46% and 48%, respectively. These are adjusted-earnings comparisons; Medtronic’s guidance reference predates the separation. Abbott dividend history and Medtronic dividend announcement.
Is Medtronic a Dividend King?
Medtronic announced its 49th consecutive annual dividend increase in June 2026. It has not yet reached the conventional 50-year Dividend King threshold. Abbott reports 54 consecutive years of increases. For other companies with long payout records, see our list of the best dividend stocks to buy.
Abbott’s Dividend After the Nutrition Spin-Off
Abbott expects the combined dividends from Abbott and the new Nutrition company to equal Abbott’s dividend at separation. This expectation concerns the total from both holdings, rather than an unchanged payment from Abbott alone. Individual policies will depend on the companies’ final structures.
Abbott vs Medtronic Stock Risks and Which One Fits Which Investor
Abbott suits investors willing to assess an operating recovery over several reporting periods. Medtronic offers higher indicated income, while its lower modeled growth requirement uses historical business inputs. Both cases need updated continuing-business figures. The strongest evidence would be improving returns above the required return, supported by earnings growth that exceeds the additional capital needed. For a comparison involving another major medtech competitor, see our AbbVie vs Johnson & Johnson stock analysis.
Key Risks Side by Side
| Abbott | Medtronic |
| Exact Sciences earnings may take longer to support the capital invested. | Post-separation earnings and cash generation may differ from legacy figures. |
| Integration costs and legal expenditure may delay margin recovery. | Latest and trailing sustainable returns remain below the model’s 10% hurdle. |
| Nutrition separation costs and capital allocation may offset expected benefits. | Competitive pressure and investment needs may absorb operating gains. |
Our Verdict
Abbott can improve, and the model shows what improvement requires. We would look for sustainable margins moving toward 13%-14%, turnover recovering toward 0.75x, and better cash generation. Those are monitoring benchmarks, not promised outcomes. Until that progress becomes visible, Medtronic retains the stronger latest quarterly return, while Abbott offers the more explicit recovery case.
Frequently Asked Questions
Abbott’s improvement case rests on measurable changes in margins and capital productivity. Medtronic’s higher indicated yield provides a different starting point, while its model includes MiniMed. The questions below distinguish that historical operating comparison from dividend labels and separation mechanics, which can otherwise make the two stocks appear more directly comparable than they are.
Can Abbott improve its returns?
Yes, if operating costs ease and sales grow faster than its enlarged asset base. Illustratively, a 13.5% sustainable margin and 0.75x turnover produce 10.13% RNOA. That scenario requires execution.
Is Abbott or Medtronic the better stock to buy?
Abbott offers a conditional return-recovery case. Medtronic offers higher indicated income. Its lower model-implied growth requirement uses historical business inputs, so price, operating progress and post-separation financials should guide the investment decision.
Which pays a higher dividend Abbott or Medtronic?
Medtronic’s indicated annual dividend is $2.88 per share versus Abbott’s $2.52, producing yields of 3.02% and 2.43% at the reference prices.
Is Medtronic a Dividend King?
Not yet. Its June 2026 increase marked 49 consecutive years. The conventional threshold is 50 years.
What happens to Abbott’s dividend after the Nutrition spin-off?
Abbott expects the two companies’ combined dividends to equal Abbott’s dividend at separation. The split between the individual payments has not been established by that commitment.
Who is Medtronic’s biggest competitor?
Abbott and Boston Scientific compete in overlapping cardiac markets. The closest rival varies by product, so naming one biggest competitor across all of Medtronic would oversimplify the comparison. Cardiac-market competitors.
Methodology: Operating calculations use the Financial Beings valuation model dated October 26, 2026 uses sustainable operating income and lagged net operating assets. Quarterly flows are annualised for actual period length. The 10% hurdle is an analytical assumption. Model sustainable earnings differ from management’s adjusted EPS. Operating returns are distinct from shareholder returns.