
Qualcomm is the stronger fit for investors seeking operating profitability and income. AMD offers faster exposure to AI compute growth, but its valuation requires more improvement. At a 10% required return, the workbook’s current NOPAT implied growth is 9.65% for AMD and 7.32% for Qualcomm. These are conditional valuation readings, not forecasts.
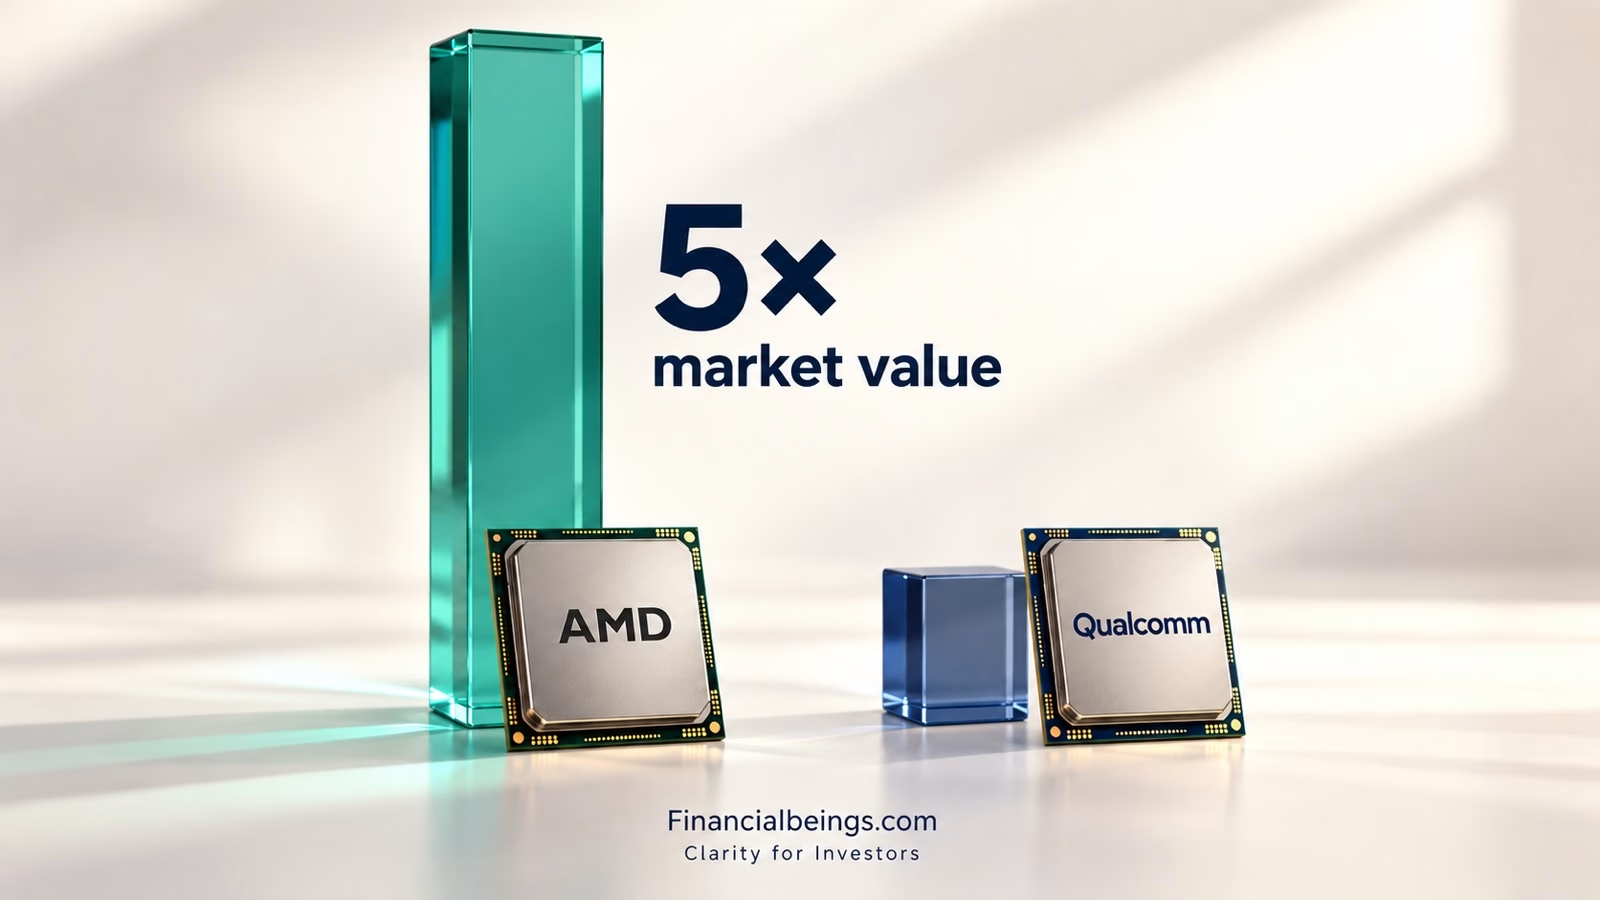
AMD generated $41.3 billion of trailing revenue against Qualcomm’s $44.1 billion. Yet its $1.03 trillion market value was 5.24 times Qualcomm’s $197.45 billion. For an investor comparing AMD vs Qualcomm stock, the question is whether future operating profits can justify that difference. This comparison concerns the shares rather than Ryzen versus Snapdragon laptop chips.
AMD vs Qualcomm Stock at a glance
| Measure | AMD | Qualcomm |
| Share price | $633.91 | $184.87 |
| Market capitalisation | $1,034.84B | $197.45B |
| Trailing revenue | $41.305B | $44.069B |
| Trailing sustainable after-tax operating profit | $5.250B | $9.167B |
| Trailing sustainable RNOA | 9.1% | 28.0% |
| Current NOPAT implied g at a 10% hurdle | 9.65% | 7.32% |
| Quarterly dividend | None | $0.92 |
| One-year price change excluding dividends | +285.0% | +9.3% |
Market inputs saved in the 3 October 2026 model; trailing operating results end in June 2026. Implied g uses fiscal 2025 NOPAT.
What profit each price requires
AMD needs much stronger future economics in the scenarios below. We hold fiscal 2025 average operating capital and net debt fixed, assume continuing growth of 4% in excess operating income, and solve for the starting after-tax profit that supports the current enterprise value.
At a 10% required return, AMD’s profit anchor is approximately $63.9 billion, about 12.2 times its latest trailing sustainable profit. Qualcomm’s is $13.3 billion, about 1.45 times its trailing profit and roughly 20% above its fiscal 2025 sustainable profit.
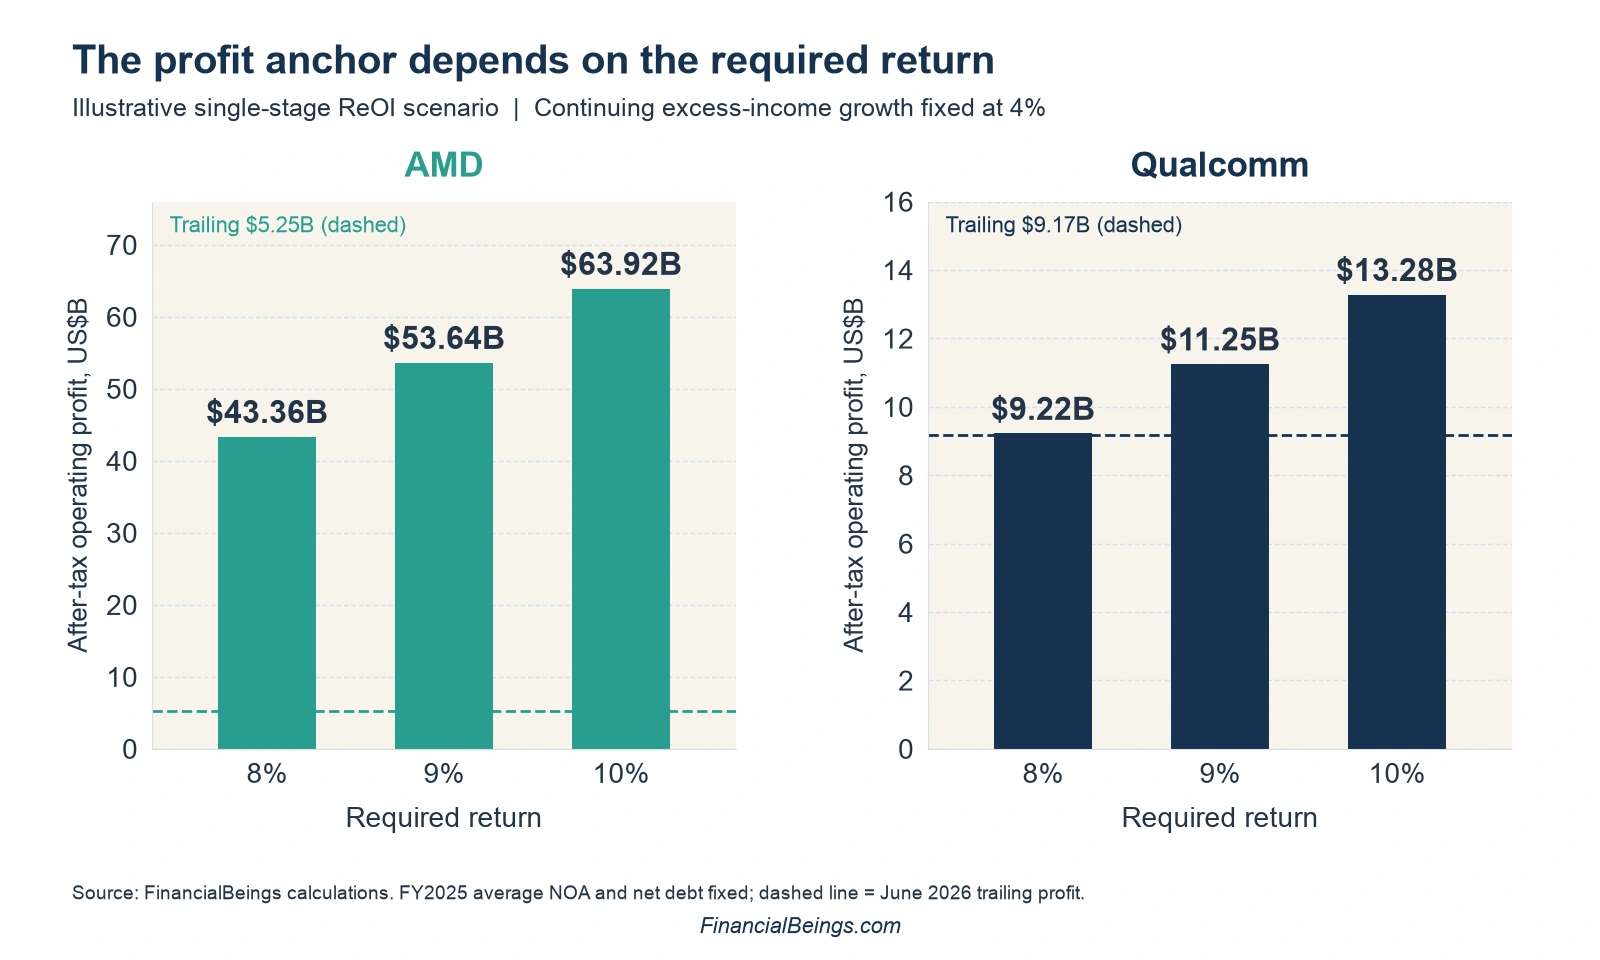
Figure 1. These are conditional starting profit anchors, not forecasts of when the companies reach them. The two panels use different dollar scales.
| Profit measure or scenario | AMD | Qualcomm |
| Latest trailing sustainable profit | $5.25B | $9.17B |
| 8% required return | $43.36B | $9.22B |
| 9% required return | $53.64B | $11.25B |
| 10% required return | $63.92B | $13.28B |
Figure 1 data. Scenario growth is 4% in ReOI; fiscal 2025 average NOA and net debt are held fixed.
The required return matters substantially. At 8%, AMD’s anchor falls to $43.4 billion, while Qualcomm’s falls to $9.2 billion, close to its latest trailing profit. A 10% hurdle is our chosen assumption, rather than a guaranteed investor return or an automatic margin of safety.
This simplified calculation does not forecast when either company reaches the profit anchor. It does not model an initial growth phase, future reinvestment or dilution. The 4% assumption applies to continuing excess-income growth; it does not mean the company earns a fixed profit forever after reaching the target.
Why AMD is worth five times Qualcomm
Markets value expected earnings, so similar revenue need not produce similar equity values. Markets value expected earnings, so similar revenue need not produce similar equity values. AMD’s price reflects a much larger anticipated expansion in profitable AI computing, a pattern we also examine by comparing AMD’s growth premium with Nvidia’s. Qualcomm begins with higher sustainable operating profit, but its latest results show deterioration. Qualcomm begins with higher sustainable operating profit, but its latest results show deterioration.
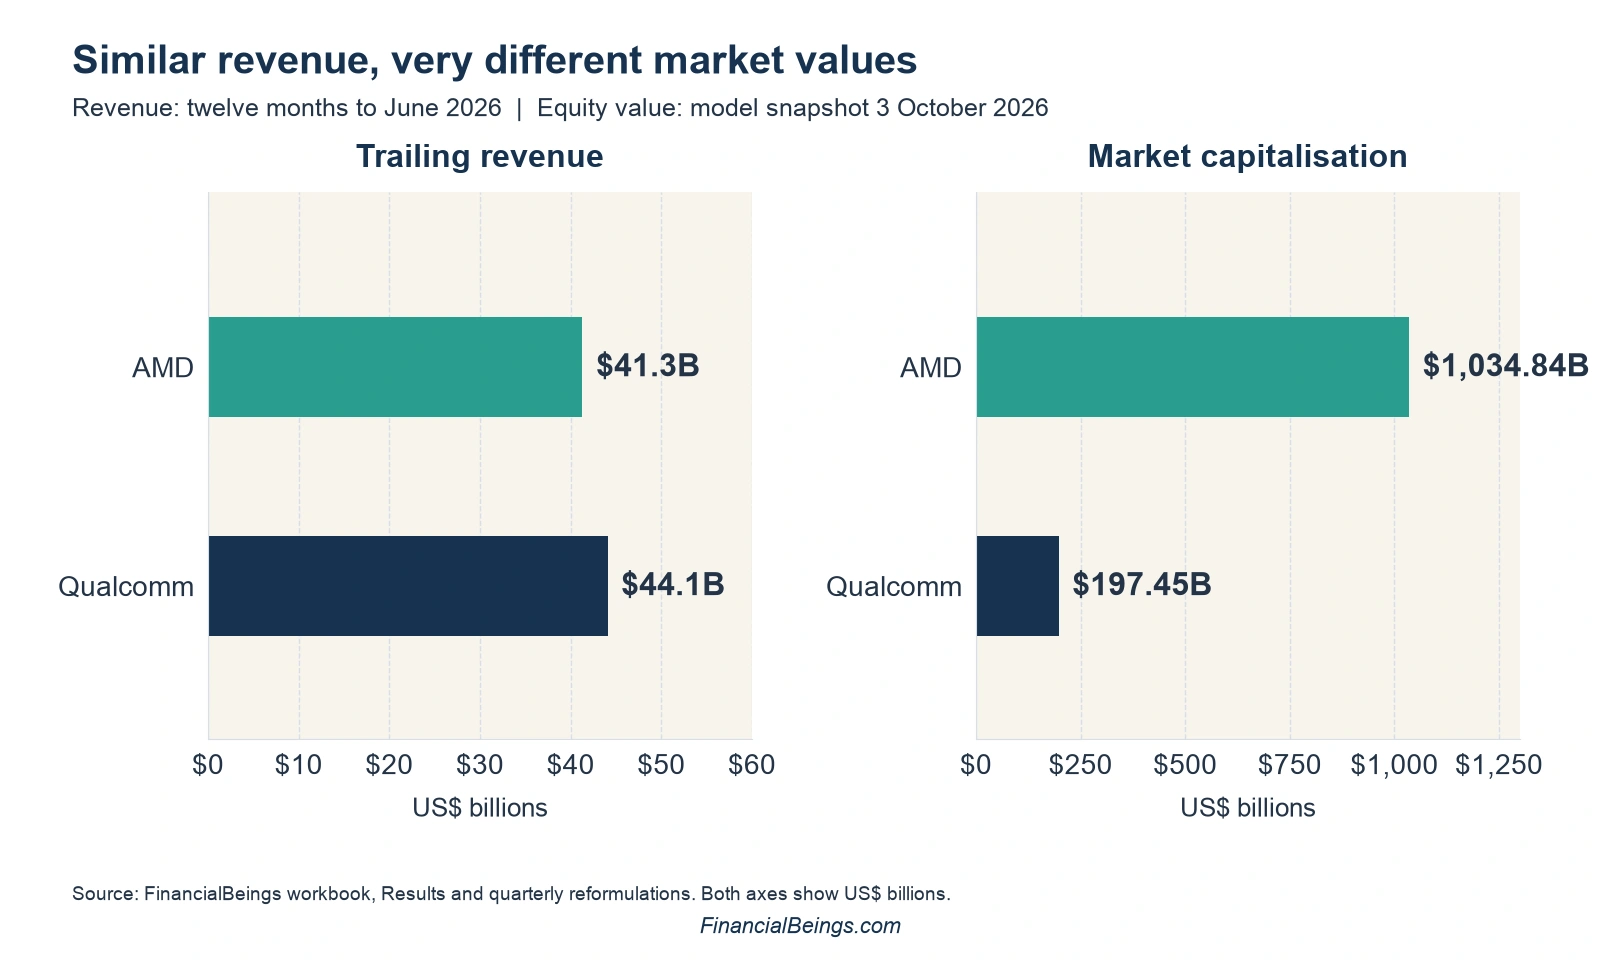
Figure 2. Revenue and market capitalisation measure different things. Market values come from the saved model snapshot.
| Company | June 2026 trailing revenue | Current market capitalisation |
| AMD | $41.305B | $1,034.84B |
| Qualcomm | $44.069B | $197.45B |
Figure 2 data. Sources: FinancialBeings quarterly reformulations and market inputs saved in the model.
The revenue lead may also change. AMD’s September-quarter revenue guidance is $13.0 billion, plus or minus $0.3 billion. Qualcomm’s guidance is $9.7–$10.5 billion. At the midpoints, rolling off each company’s own prior-year quarter gives trailing revenue of $45.059 billion for AMD and $42.898 billion for Qualcomm.
If AMD delivers $13.0 billion, Qualcomm would need approximately $12.261 billion in that quarter to match AMD’s trailing revenue. Merely exceeding Qualcomm’s prior-year $11.271 billion would not be enough. Guidance indicates a possible crossover; actual results will determine it.
Which company earns stronger operating returns
Qualcomm currently earns more sustainable profit and a higher return on net operating assets. AMD’s return is improving, while Qualcomm’s is falling. Return on net operating assets, or RNOA, combines after-tax operating margin with sales generated per dollar of operating capital.
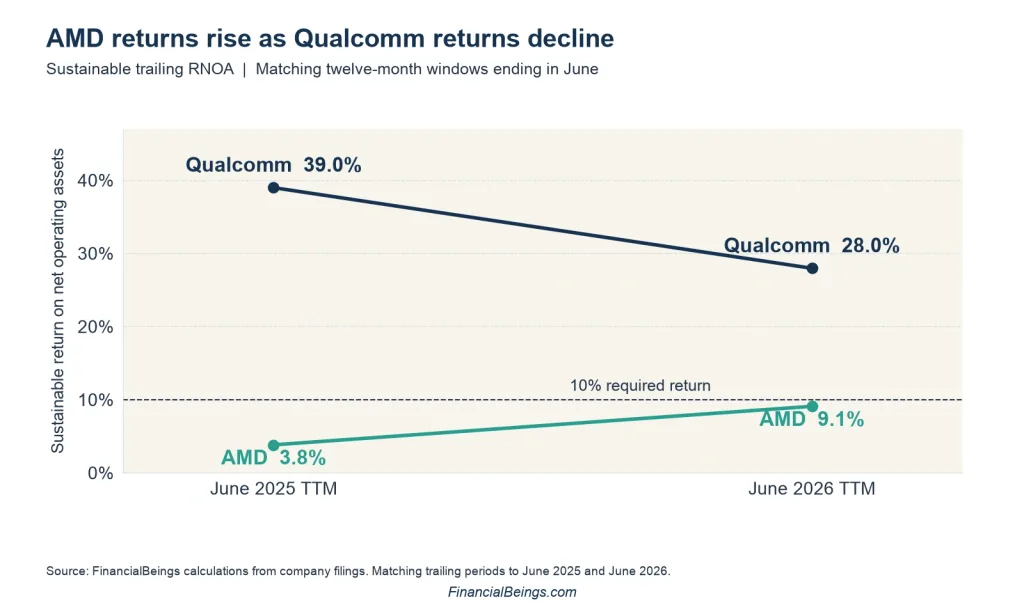
Figure 3. Sustainable RNOA includes the operating-capital base used by the FinancialBeings model, including acquired capital.
| Operating measure | AMD | Qualcomm |
| June 2025 trailing sustainable RNOA | 3.8% | 39.0% |
| June 2026 trailing sustainable RNOA | 9.1% | 28.0% |
| June 2026 trailing sustainable after-tax margin | 12.7% | 20.8% |
| June 2026 trailing operating-asset turnover | 0.71× | 1.34× |
Figure 3 data and return drivers. RNOA equals sustainable margin multiplied by turnover on the same capital basis.
AMD’s acquired goodwill and intangibles make its capital base large. Acquisition-related intangible amortisation also reduces reported profit. Keeping acquired capital in the denominator helps assess whether acquisitions earn their cost; excluding it answers a different question about tangible-asset productivity.
Sustainable RNOA consistently relates sustainable after-tax operating profit to the model’s operating-capital base. Acquired capital can change through amortisation, impairment, acquisitions and operating balances.
What Current NOPAT Implied g measures
Current NOPAT Implied g is the growth implied by the current market valuation under the workbook’s NOPAT method. NOPAT means net operating profit after tax. After-tax operating income and NOPAT describe the same economic concept, but the workbook calculates several versions using different tax and accounting treatments. For a broader introduction to growth rates, see how to estimate a stock’s growth rate.
The formula is g = required return − NOPAT ÷ current enterprise value. Enterprise value is market capitalisation plus net debt. At a 10% required return, the saved inputs reproduce 9.65% for AMD and 7.32% for Qualcomm.
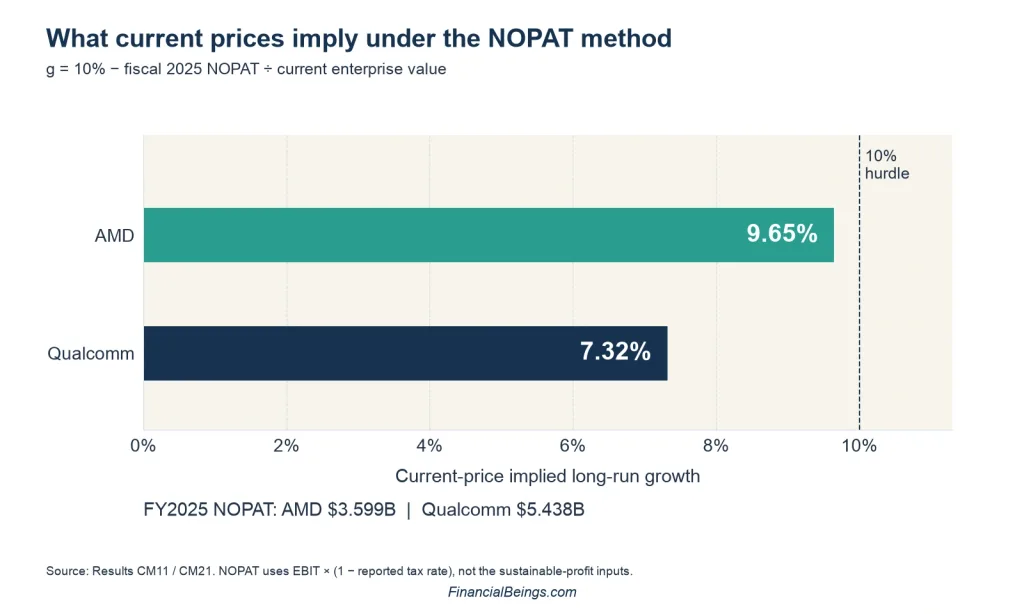
Figure 4. Current refers to market valuation. The earnings anchors are fiscal 2025, with reported tax rates of 2.47% for AMD and 56% for Qualcomm.
| NOPAT-method input or result | AMD | Qualcomm |
| Fiscal 2025 NOPAT input | $3.599B | $5.438B |
| Current enterprise value | $1,028.294B | $202.938B |
| Required return | 10% | 10% |
| Current NOPAT implied g | 9.65% | 7.32% |
Figure 4 data. Source: the workbook NOPAT module and Results Current NOPAT Implied g.
Here, “current” refers to the market valuation. The profit input is fiscal 2025 EBIT multiplied by one minus the reported effective tax rate: 2.47% for AMD and 56% for Qualcomm. It is not the sustainable trailing profit used in the operating-return comparison.
| Fiscal 2025 field in the model | AMD | Qualcomm |
| Operating Income after Tax | $3.820B | $5.090B |
| Sustainable OI After Tax | $3.013B | $11.064B |
| NOPAT used for Current NOPAT Implied g | $3.599B | $5.438B |
Same fiscal-year period, different tax and accounting treatments. These figures are separate from the June 2026 trailing results.
The tax distinction is material. Qualcomm’s June 2026 10-Q explains the $5.7 billion deferred-tax valuation allowance established in fiscal 2025 and released in the March 2026 quarter. These events affect reported tax rates and earnings. The sustainable-profit calculation uses a different tax treatment.
The NOPAT growth comparison therefore needs its tax basis beside it. It is neither the company’s observed year-over-year growth nor an analyst forecast. Growth in excess operating income is another measure because it deducts a required return on operating capital. The two growth methods should be labelled separately.
What drives growth and where the risks lie
AMD’s June-quarter Data Center revenue reached $6.718 billion, up 107%, or about 58% of total revenue. Its earnings release points to EPYC processors, Instinct accelerators, ROCm software and the Helios ramp. The investment case depends on converting demand into durable profit while managing competition, customer concentration and export restrictions.
Qualcomm’s handset revenue fell 20% to $5.086 billion. Automotive rose 61% to $1.588 billion and IoT rose 9% to $1.830 billion. Licensing supplies another revenue stream. Management expects non-handset growth to accelerate from 24% in fiscal 2026 to more than 60% in fiscal 2027; that remains an expectation.
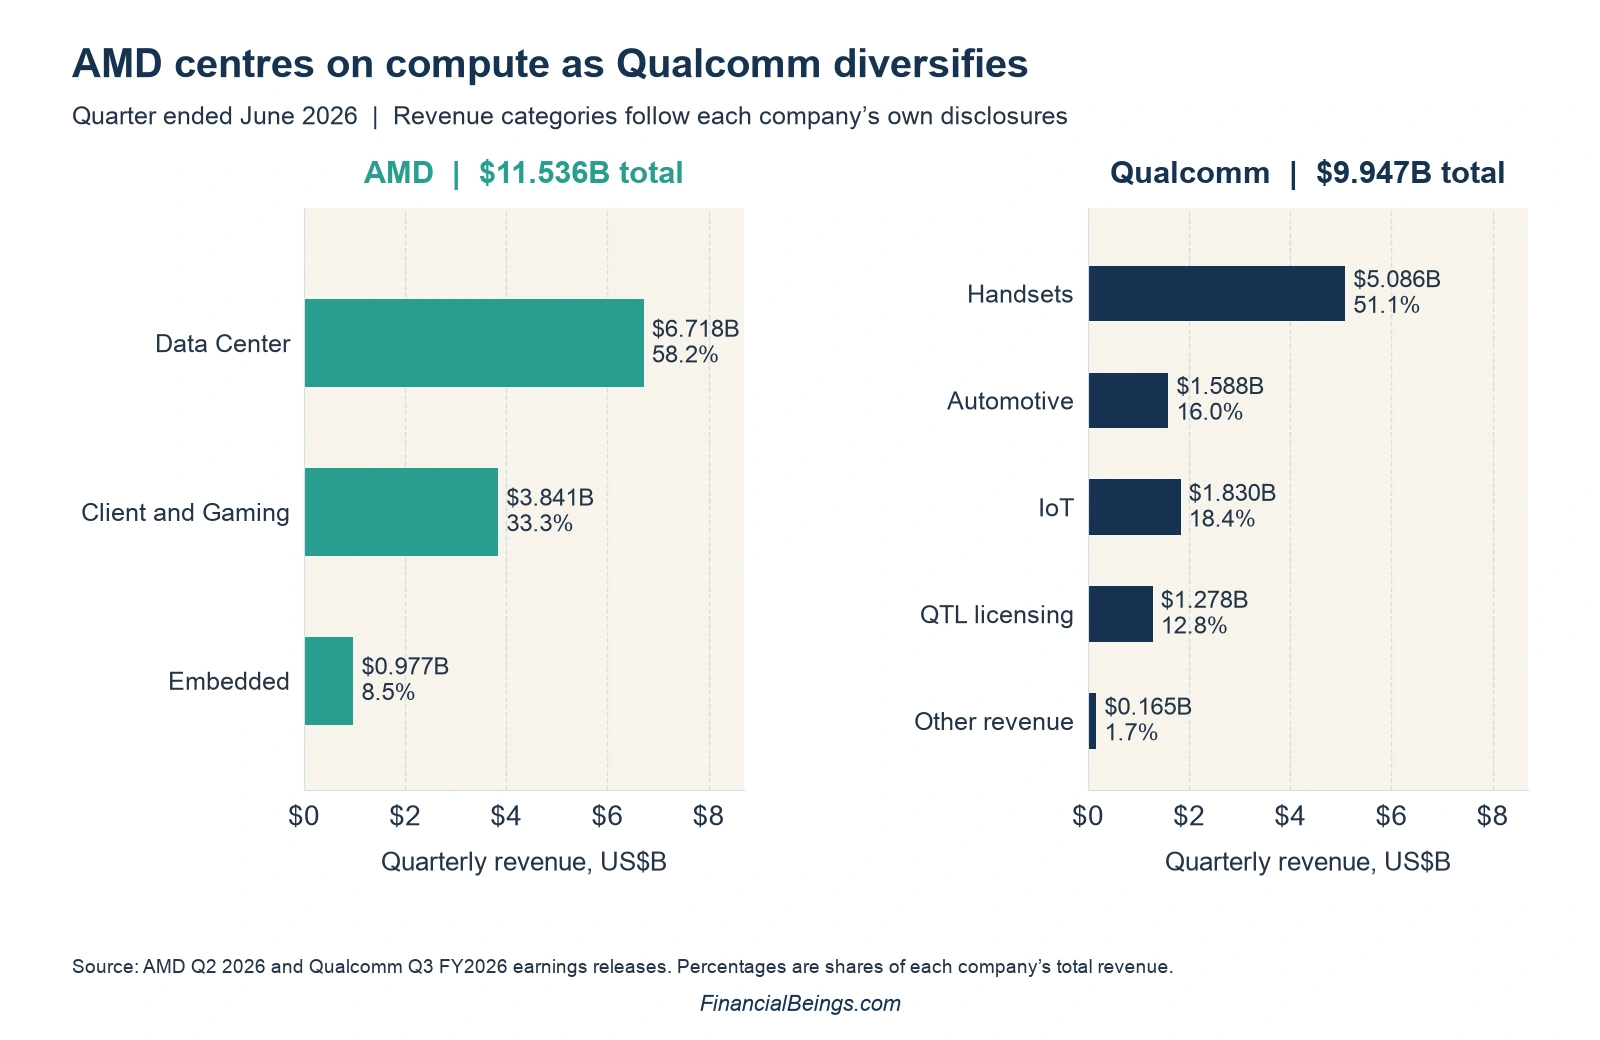
Figure 5. AMD segments and Qualcomm product/licensing categories differ. Other Qualcomm revenue is the residual needed to reconcile consolidated sales.
| Company | Revenue category | June-quarter revenue | Share of company revenue |
| AMD | Data Center | $6.718B | 58.2% |
| AMD | Client and Gaming | $3.841B | 33.3% |
| AMD | Embedded | $0.977B | 8.5% |
| Qualcomm | Handsets | $5.086B | 51.1% |
| Qualcomm | Automotive | $1.588B | 16.0% |
| Qualcomm | IoT | $1.830B | 18.4% |
| Qualcomm | QTL licensing | $1.278B | 12.8% |
| Qualcomm | Other revenue | $0.165B | 1.7% |
Figure 5 data. AMD Q2 2026 and Qualcomm Q3 FY2026 releases. Qualcomm other revenue is consolidated revenue less QCT and QTL revenue.
Qualcomm’s 10-Q identifies memory constraints and customer inventory adjustments as current handset pressures. Apple’s increasing use of its own modems is a separate continuing risk. China exposure, customer concentration and the cost of diversification also matter. The automotive and IoT expansion must translate into enough profit to offset handset weakness.
Dividends and stock returns
Qualcomm’s $0.92 quarterly dividend annualises to $3.68 per share, approximately a 2.0% yield at $184.87. It also repurchased $1.4 billion of shares in the June quarter, according to its release. AMD pays no dividend; its cash-flow statement reports $221 million of common-stock repurchases in the first half of 2026.
The model’s saved Yahoo Finance price observations show AMD rising about 285% and Qualcomm about 9% over one year. These are price changes excluding dividends, rather than total returns. For other income-focused ideas, see dividend stocks we consider worth buying.
Which stock fits which investor
Qualcomm offers the clearer income case and currently stronger operating profitability. Its valuation still depends on profit stabilising as the business diversifies. A lower market value does not eliminate handset, tax or execution risk.
AMD suits investors with strong conviction in sustained AI compute expansion and tolerance for demanding valuation assumptions. Watch whether sales growth improves capital turnover and whether sustainable operating returns keep rising. In the stated scenarios, AMD requires substantially more profit improvement than Qualcomm.
The next operating results are the natural refresh point: AMD’s Q3 2026 and Qualcomm’s Q4 fiscal 2026. Check the companies’ investor-relations announcements for confirmed reporting dates rather than relying on an assumed calendar date.
Frequently asked questions
Is AMD or Qualcomm stock the better buy?
Qualcomm better fits an income-focused investor seeking stronger current operating returns. AMD offers greater AI compute growth exposure with more demanding valuation assumptions. Profit trends and the price paid remain central to either case.
Why can AMD and Qualcomm earnings multiples mislead?
AMD’s acquisition-related intangible amortisation depresses reported earnings. Qualcomm’s large tax charge and subsequent reversal distort reported earnings across periods. P/E comparisons need consistent dates, profit definitions and tax treatment.
Does AMD or Qualcomm pay a dividend?
Qualcomm pays $0.92 per quarter, equivalent to about 2.0% annualised at the model’s $184.87 price. AMD pays no dividend. Dividend yield changes with price, and future payouts depend on subsequent declarations.
Which company has more revenue?
Qualcomm leads on the twelve months to June 2026, at $44.069 billion versus AMD’s $41.305 billion. The next-quarter guidance midpoints imply AMD could take the trailing-revenue lead, subject to actual results.
What does current NOPAT implied growth mean
It is the long-run growth rate consistent with the current enterprise value under the workbook’s NOPAT formula. The saved rates are 9.65% for AMD and 7.32% for Qualcomm at a 10% required return, using fiscal 2025 earnings.
Sources and related research
Primary references are AMD’s Q2 2026 results, Qualcomm’s Q3 fiscal 2026 results and Qualcomm’s June 2026 10-Q. FinancialBeings model calculations are dated 3 October 2026.
For related semiconductor comparisons, see our AMD versus Broadcom analysis and Broadcom versus Qualcomm analysis.
