If you have ever been burned by a stock that looked cheap and then cratered, you already understand Cenovus Energy. Here is what its returns really say — and what the tidy ratio tables everyone else publishes quietly leave out.
| The short answer. Cenovus Energy’s trailing-twelve-month return on assets (ROA) is about 7%, and its return on equity (ROE) is about 14%. In plain words: for every $1 of assets, Cenovus earns roughly 7 cents; for every $1 shareholders have put in, about 14 cents. Those are solid, above-peer returns — but they rise and fall with the price of oil. |
That single line is where most articles stop. A number, no meaning. This one keeps going — because the interesting part of Cenovus is not the number, it is the engine underneath it.
Over the next few minutes we will break that engine apart the way a large asset manager would: split ROE into its three working parts (a DuPont analysis), strip out the noise of debt to find the true operating return (RNOA), walk the ten-year history so the swings make sense, line Cenovus Energy ROA and ROE up against its peers, and ask what the newly closed MEG Energy deal does to all of it. We will name the risks before we make the case. Let’s begin.
Cenovus Energy ROA and ROE at a glance
Here are the headline profitability figures, all on a trailing-twelve-month (TTM) basis from our internal DuPont model. Think of this as the dashboard; the rest of the article is the engine bay.
| Metric (TTM) | Value |
| Return on Assets (ROA) | 7.16% |
| Return on Equity (ROE) | 14.27% |
| Net profit margin (return on sales) | 8.79% |
| Asset turnover | 0.81x |
| Financial leverage | 1.99x |
| Return on invested capital (ROIC, first-party) | 12.1% |
| Operating margin | 10.8% |
| Trailing / Forward P/E | 14.7x / 10.4x |
| Price / Book | 2.11x |
| EV / EBITDA | 5.24x |
Table A — Cenovus current profitability ratios (TTM, except ROIC). Source: FinancialBeings internal DuPont and ReOI models, 17 June 2026. ROIC is computed first-party as NOPAT (operating income after tax) ÷ net operating assets = 12.1% on beginning operating capital (the sustainable RNOA in Visual 1), ≈10.9% on average capital; it equals return on capital because net operating assets = net debt + equity. A third-party provider’s looser ‘return on capital’ reads ~13.2% TTM.
One quick sense-check before we go further: 8.79% margin × 0.81 turnover × 1.99 leverage ≈ 14.2% ROE, and 8.79% × 0.81 ≈ 7.1% ROA. The identity ties out. Nothing here is smoke and mirrors.
What are ROA and ROE? (a 60-second primer)
Return on assets answers a simple question: how much profit does the company squeeze out of everything it owns? The formula is net income ÷ total assets. A 7% ROA means every dollar of pipelines, refineries and oil-sands leases throws off about seven cents of profit a year.
Return on equity asks a narrower question: how much profit lands in the owners’ pocket, per dollar they actually invested? The formula is net income ÷ shareholders’ equity. Cenovus’s ~14% ROE is double its ROA.
Why the gap? One word: leverage. ROE includes the boost from borrowed money; ROA does not. When a company funds part of its asset base with debt, shareholders’ equity is smaller than total assets — so the same profit divided by that smaller base produces a bigger percentage. That gap between 7% and 14% is the story of the next section.
Breaking down Cenovus’s ROE: a DuPont analysis
DuPont analysis is the trick professional analysts use to stop treating ROE as one number and start seeing it as three. ROE is the product of three levers:
| ROE = Net margin × Asset turnover × Financial leverage 14.2% ≈ 8.8% × 0.81 × 1.99 |
Read left to right, that tells you exactly where Cenovus’s return comes from — and where its risk lives:
- Net margin (8.8%) — the profit kept from each dollar of sales. This is the commodity lever. When oil and refining margins are fat, it swells; when they collapse, it can go negative. This is the single biggest source of Cenovus’s volatility.
- Asset turnover (0.81x) — how hard the asset base works. Oil-sands and refining assets are enormously capital-intensive, so turnover below 1.0x is normal and structural. It moves slowly.
- Financial leverage (1.99x) — the equity multiplier, equal to average total assets ÷ shareholders’ equity (it is also exactly ROE ÷ ROA). At roughly 2x it is moderate. Note this is the DuPont equity multiplier — every dollar of assets per dollar of equity — not net-debt-to-equity, which is far lower at about 0.36x. Cenovus’s leverage has fallen sharply from the strained, high-debt years right after the 2021 Husky merger.
The takeaway is the kind of thing that protects you from a bad trade: almost all of Cenovus’s ROE volatility comes from margin — the oil price — not from financial engineering. The leverage is steady. The commodity is not. If you are betting on Cenovus, you are betting on crude, whether you admit it or not.
Cenovus’s ROA: how hard it sweats its assets
Strip leverage away and you are left with ROA — net margin × asset turnover, or roughly 8.8% × 0.81 ≈ 7%. This is the cleaner read on the underlying business, because it does not flatter the picture with borrowed money.
Seven percent might sound modest, but for an integrated oil producer carrying tens of billions of dollars of long-life assets, it is respectable. Oil sands cost a fortune to build and then run for decades; the trade-off for that heavy upfront capital is durable production once the plants are paying for themselves. A 7% ROA on that kind of asset base is the business doing its job.
It also frames what ‘normal’ looks like. On a full-year-2025 basis Cenovus’s ROA was 6.07%; the TTM figure of 7.16% is a touch higher because it captures the most recent, stronger quarters and uses slightly different balance-sheet averaging.
Both sit comfortably inside the company’s mid-cycle range. For investors looking at how major oil companies perform across different price cycles, you can also read our ConocoPhillips outlook and forecast analysis, which explores whether COP can outperform as oil prices cool.
Ten years of returns: what drove the swings
A single year of ROE tells you almost nothing about an oil company. The ten-year arc tells you everything. Here is Cenovus’s record — and notice how violently the numbers move.
| Fiscal Year | ROA % | ROE % | RNOA (sust.) % | PM % | ATO |
| 2017 | 5.37 | 20.33 | 19.36 | 15.53 | 1.25 |
| 2018 | -8.72 | -14.16 | -8.18 | -11.69 | 0.70 |
| 2019 | 3.04 | 6.49 | 6.11 | 7.42 | 0.82 |
| 2020 | -6.91 | -12.08 | -6.92 | -14.49 | 0.48 |
| 2021 | 1.95 | 6.33 | 7.44 | 4.05 | 1.84 |
| 2022 | 12.87 | 28.65 | 20.29 | 11.18 | 1.81 |
| 2023 | 7.47 | 14.97 | 12.82 | 8.48 | 1.51 |
| 2024 | 5.96 | 10.83 | 9.61 | 6.67 | 1.44 |
| 2025 | 6.07 | 13.57 | 12.12 | 8.81 | 1.38 |
Table B — Cenovus 10-year profitability trend (fiscal year). Source: FinancialBeings internal ReOI/DuPont model.
The story in three beats:
- 2018 and 2020 — the red years. Asset write-downs in 2018 and the COVID-driven oil price crash in 2020 pushed returns into deep negative territory. ROE hit roughly −14% and −12%. This is the part of the cycle that hurts.
- 2022 — the windfall. As post-pandemic energy prices spiked, ROE peaked near 29%. Anyone extrapolating that number forward was setting themselves up for disappointment.
- 2023–2025 — the normalization. As prices cooled, returns settled back into the low-to-mid teens — 15%, then 11%, then 13.6% ROE. This is closer to the real Cenovus.
Here is the honesty signal, the thing a sell-side note might skip: Cenovus’s true operating profit (residual operating income) has dipped in four of the last nine years. These returns are genuinely cyclical. That is not a flaw to hide — it is the nature of the business, and pretending otherwise is how investors get hurt.
Beyond the textbook: Cenovus’s RNOA (the cleaner read)
This is where FinancialBeings goes where the data widgets cannot. ROE and ROA both mix two very different things together: how good the business is at operating, and how it is financed. To see the real operating engine, you separate them. The tool for that is RNOA — Return on Net Operating Assets.
RNOA is operating income after tax divided by net operating assets (the operating assets a company uses, minus the operating liabilities like payables that effectively fund themselves). It answers the purest question of all: ignoring how the company borrows, how good is the actual business?
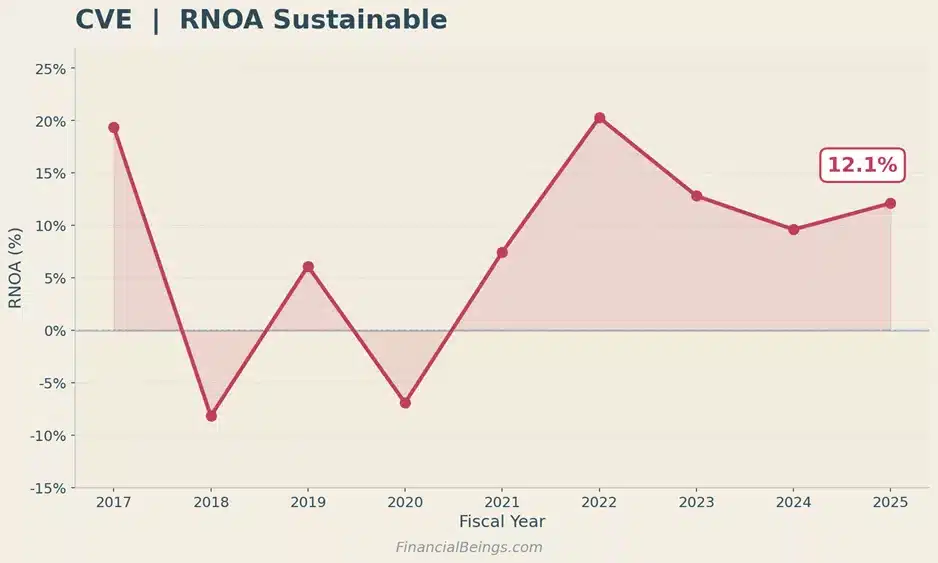
Visual 1 — Cenovus sustainable RNOA by fiscal year. Ends at 12.1% in 2025.
Cenovus’s sustainable RNOA for 2025 is about 12.1% — meaningfully higher than its reported ~7% ROA. Why higher? Because RNOA measures profit against net operating assets. Cenovus carries about $44.3B of operating assets; subtract roughly $12.8B of operating liabilities (payables and the like, which effectively fund themselves) and you are left with net operating assets of about $31.5B. That leaner, sharper base is what operating profit has to earn against — and a smaller denominator lifts the return above the ~7% ROA.
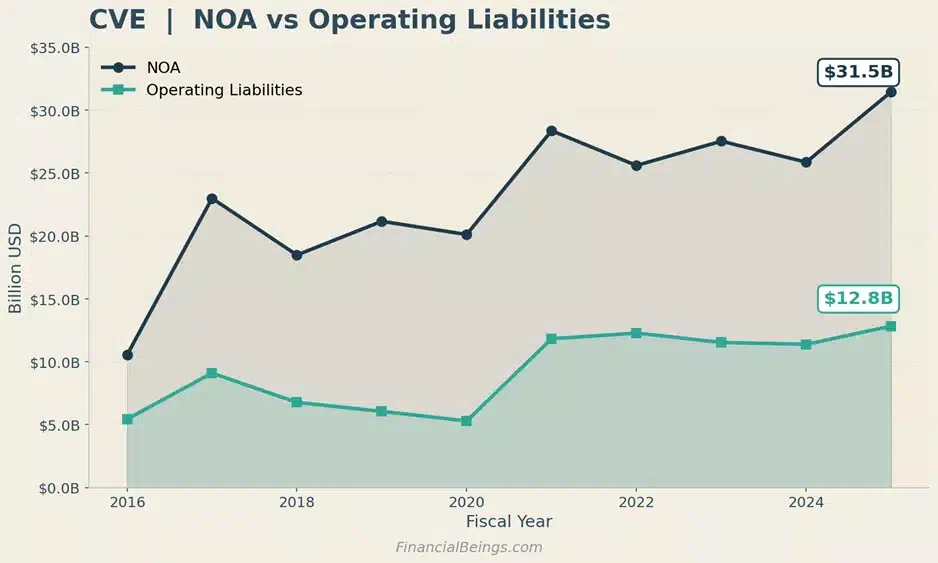
Visual 2 — Cenovus net operating assets ($31.5B) versus operating liabilities ($12.8B), 2016–2025.
That 12.1% breaks down, just like ROE did, into an operating profit margin of about 8.8% multiplied by an operating asset turnover of about 1.38 — and 8.8% × 1.38 ≈ 12.1%. The math ties out again.
This RNOA is, in fact, Cenovus’s true return on invested capital. Because net operating assets equal net debt plus equity by construction (about $8.4B + $23.1B ≈ $31.5B), NOPAT ÷ net operating assets is ROIC computed strictly and first-party — roughly 12.1% on beginning operating capital and about 10.9% on average capital. It is the cleanest ‘return on the money actually deployed in the business’ figure in this report, which is why we lead with it rather than a third-party ‘return on capital’ number that runs about a point higher on an undisclosed capital base.
| The punchline. Cenovus’s ROE (~14%) is higher than its RNOA (~12%). That gap is the signature of leverage that is working for shareholders. The company earns about 12% on its operations (RNOA) while its after-tax net borrowing cost is about 6.3% — a positive operating spread of about 5.8 points (12.1% − 6.3%). Borrowed money is amplifying good operating returns, not papering over bad ones. |
That is a genuinely favorable setup — but it only works while the operating spread stays positive. In 2018 and 2020, when RNOA went negative, that same leverage worked in reverse and deepened the losses. Leverage is a multiplier in both directions. Respect it.
How Cenovus compares to its peers
Returns only mean something next to the competition. Here is Cenovus against the two U.S. supermajors (ExxonMobil, Chevron) and its two closest Canadian peers (Suncor, Imperial Oil), all on a TTM basis. For a broader energy sector comparison, see our XOM vs CVX vs COP stock analysis, where we compare three of North America’s largest oil companies across valuation, profitability, and return metrics.
| Metric (TTM) | CVE | XOM | CVX | SU | IMO |
| Return on equity | 14.3% | 9.7% | 5.8% | 13.8% | 12.8% |
| Return on capital (ROC, provider) | 13.2% | 13.8% | 10.4% | 15.1% | 16.2% |
| Net margin | 8.8% | 7.8% | 5.9% | 11.6% | 6.4% |
| Asset turnover | 0.81x | 0.70x | 0.56x | 0.59x | 1.00x |
| Financial leverage | 1.99x | 1.78x | 1.74x | 2.03x | 2.00x |
Table C — Peer profitability comparison (TTM). Source: FinancialBeings internal DuPont model. The return-on-capital row is the data provider’s figure, shown on one consistent basis for all five names; Cenovus’s stricter first-party ROIC is ~12.1% (see the RNOA section). Peer-group averages: ROE 11.3%, ROC 13.7%, net margin 8.1%.
On return on equity, Cenovus tops the table. It’s ~14.3% beats both supermajors comfortably — Exxon sits near 9.7%, Chevron near 5.8% — and edges out Suncor (13.8%) and Imperial (12.8%). For a headline ‘who earns the most for shareholders’ contest, Cenovus wins. Investors interested in a deeper Exxon vs Chevron comparison can see how the two oil majors stack up on profitability, valuation, and long-term return potential. Cenovus also edges out Suncor (13.8%) and Imperial (12.8%).
But here is the part the templated comparison pages get wrong, and it matters: a high ROE is not the same as the best business. Look one row up at return on capital — the unlevered measure of how well each company turns capital into profit. On that line, Cenovus’s ~13.2% actually trails Imperial (16.2%), Suncor (15.1%) and even Exxon (13.8%); it only clears Chevron. And on our stricter first-party ROIC (~12.1%), the gap to the two Canadian leaders is wider still.
Read together, the two rows tell the honest story. Cenovus leads on ROE largely because it pairs a balanced margin-and-turnover profile with about 2x leverage — not because its underlying capital is the most productive in the group. Suncor and Imperial run similar leverage and earn more on their capital; they simply convert less of it into headline ROE. So if you are choosing on raw operating quality rather than equity optics, the Canadian peers have a real claim.
The standard caveat applies to everyone here: integrated-oil returns are commodity-driven, and this ranking will reshuffle with the next move in crude and with each company’s particular refining and downstream mix.
The risk our model keeps flagging
Strong returns can coexist with a real vulnerability, and Cenovus is a clean example. Our balance-sheet safety screen passes Cenovus on most checks — net debt is modest versus market value, leverage is normal, the operating spread is healthy — but it fails on one line every single year, and that drags the overall rating to FAIL.
| Safety check | 2023 | 2024 | 2025 |
| Net debt position | PASS | PASS | PASS |
| Net borrowing cost | PASS | BORDERLINE | BORDERLINE |
| Operating spread | PASS | BORDERLINE | PASS |
| Book leverage | PASS | PASS | PASS |
| Market leverage | PASS | PASS | PASS |
| Liquidity buffer | FAIL | FAIL | FAIL |
| Operating return | PASS | PASS | PASS |
| Overall | FAIL | FAIL | FAIL |
Safety screen — Cenovus, present plus prior two years. The Liquidity Buffer flag is the binding constraint.
The flag is liquidity. Cenovus holds cash equal to only about a fifth of its interest-bearing debt — well below the cushion our screen wants to see. In plain terms, the company runs lean on cash. When oil is high and cash is gushing in, that is efficient capital allocation. In a sharp, sustained downturn, a thin cash buffer is exactly the kind of thing that turns a bad year into a dangerous one. It is the same cyclicality from the ten-year chart, viewed from the balance sheet. Worth watching; not yet alarming.
What the MEG Energy acquisition means for future returns
On 13 November 2025, Cenovus closed its acquisition of MEG Energy — and it will reshape every ratio in this article over the next few years.
The deal: roughly $3.44B in cash to MEG shareholders, about 143.9 million new Cenovus shares issued, and roughly $0.8B of net debt assumed (plus around $0.75B of open-market share purchases). For the profitability ratios, the mechanics cut two ways:
- Near-term drag. More assets and more equity land in the denominators of ROA and ROE before the full earnings power shows up in the numerator. Mechanically, that can dilute reported returns in the first prints.
- Multi-year offset. Management guides to about $150M a year of synergies in 2026–2027, rising to $400M-plus annually from 2028, on top of the added oil-sands volumes. If those land, they rebuild the return profile from the bottom up.
For context on the starting point: Cenovus reported Q4 2025 net earnings of $934M (down from $1.3B the prior quarter), and full-year 2025 set a record for upstream production. The real question is not the 2025 scoreboard — it is whether the 2026 and 2027 prints show synergies arriving faster than the dilution. That is the single most important thing to watch on these energy stocks.
The FinancialBeings Valuation Lens (10% hurdle rate)
Strong returns are only half the story. The other half is what you pay for them — and that is the piece no ratio table will ever give you. Our lens takes Cenovus’s operating engine and asks a single, demanding question: at a 10% required return, what is the business worth across a range of long-term growth outcomes?
One plain-English idea drives the table:
| Value-to-Price (V/P) — our ‘VAR profile’. Estimated intrinsic value as a percentage of today’s market price. Above 100% means the shares look cheap (worth more than the price); below 100% means they look expensive. It is simply intrinsic value ÷ market cap. |
Here is the surface at a 10% hurdle, for long-term residual-operating-income (ReOI) growth from 2% up to 8.5%. Each row asks the same question: if Cenovus grows residual operating income at that rate, what are the shares worth?
| LT growth % | Intrinsic value ($B) | Value / share ($) | V/P % |
| 2% | 38.3 | 16.06 | 61 |
| 3% | 39.3 | 16.59 | 63 |
| 4% | 40.6 | 17.29 | 66 |
| 5% | 42.4 | 18.27 | 69 |
| 6% | 45.2 | 19.74 | 75 |
| 7% | 49.8 | 22.19 | 84 |
| 7.5% | 53.4 | 24.15 | 92 |
| 8% | 58.9 | 27.09 | 103 |
| 8.5% | 68.0 | 32.00 | 122 |
FinancialBeings Valuation Lens — CVE intrinsic-value surface at a 10% hurdle rate. Source: FinancialBeings ReOI model, 17 June 2026. Current price ~$26.25 (NYSE, USD, 17 Jun 2026 close); market cap ~$49.0B. Value-to-Price (V/P) is intrinsic value as a percentage of the current price — above 100% is cheap, below 100% is expensive.
Read the V/P column top to bottom and the message is clear. At a 10% required return, Cenovus only screens as fairly valued once you assume roughly 8% perpetual growth in residual operating income — that is where V/P crosses 100%, between the 7.5% and 8% rows. Assume anything less and the shares look expensive on this lens.
That matters, because the market is already implying about 7.9% long-term ReOI growth at this hurdle — a demanding assumption that sits near the very top of the range we model. Step down to a more moderate 5% growth and the shares are worth only about 69 cents on the dollar — a Value-to-Price near 69%.
| The bottom line at 10%. To justify today’s ~$26.25 price (NYSE close, 17 Jun 2026) at a 10% required return, the model has to assume roughly 8% perpetual ReOI growth — and the market is implying about 7.9%, right at the top of the range. On anything less, Value-to-Price stays below 100% and the shares look expensive. At a 10% hurdle, you are paying up for growth the company has yet to prove. |
One honest caveat, because the answer hinges entirely on the hurdle you choose: 10% is a deliberately demanding bar. The model’s own track record fits best at an 8% hurdle — and at 8%, this same lens flips Cenovus to clearly undervalued. So treat the 10% view as a conservative stress test, not a verdict: it shows the stock needs either a lower required return or genuine high-single-digit growth to look cheap. That, in a single table, is the valuation case laid bare.
Is Cenovus’s ROE good? The verdict
Yes — with caveats you should hold onto. Cenovus’s ~14% ROE is above its supermajor peers and at the top of its Canadian peer group, and it is backed by a real, positive operating spread rather than financial engineering. That is a quality signal.
But the same returns are deeply cyclical (negative in two of the last eight years), they are amplified by about 2x leverage that cuts both ways, the company runs a thin liquidity buffer, and on raw return on capital it actually trails Suncor and Imperial. ‘Best ROE in the group’ and ‘best business in the group’ are not the same sentence here.
Key takeaways
- Cenovus earns about 7% ROA and 14% ROE (TTM) — solid, above-peer returns for an integrated oil producer.
- A DuPont split (8.8% margin × 0.81 turnover × 1.99 leverage) shows the volatility comes from the oil price, not from financial engineering.
- The cleaner read — RNOA of ~12% versus a ~6% after-tax borrowing cost — confirms leverage is currently adding value, with a positive spread.
- The honest caveats: returns are cyclical, the liquidity buffer is thin, and on return on capital Cenovus trails Suncor and Imperial. The MEG Energy integration is the key 2026–2027 watch-item.
Methodology & editorial notes
Figures are drawn from FinancialBeings’ internal DuPont and residual-operating-income (ReOI) valuation models (data pull 17 June 2026) and reconcile to Cenovus’s public filings. ROA and ROE are computed on a trailing-twelve-month basis; the DuPont identity (margin × turnover × leverage) ties to within rounding.
RNOA uses the standard reformulation that separates operating items from financing items. TTM figures can differ modestly from full-year figures because of period and averaging differences — disclosed throughout.
Return on invested capital is computed first-party as NOPAT (operating income after tax) ÷ net operating assets, which equals net debt plus equity by construction — making ROIC identical to RNOA.
We report it (12.1% on beginning capital, ~10.9% on average) in preference to a third-party ‘return on capital’ figure that reads ~13.2% TTM on an undisclosed, looser capital base.
Financial leverage is the DuPont equity multiplier (average total assets ÷ shareholders’ equity ≈ 2.0x, and equal to ROE ÷ ROA), which is distinct from net-debt-to-equity (~0.36x).
The current price and market capitalisation are the NYSE (USD) quote — about $26.25 per share and ~$49.0B at the 17 June 2026 close (Yahoo Finance) — which reconciles with the model’s live figures ($26.31 / $49.06B), confirming the model is denominated in U.S. dollars.
Frequently Asked Questions
What is Cenovus Energy’s ROE?
About 14% on a trailing-twelve-month basis (as of 17 June 2026), and roughly 13.6% for full-year 2025. ROE measures net income against shareholders’ equity — what the company earns for its owners.
What is Cenovus Energy’s ROA?
About 7% TTM. ROA is net income against total assets, and it sits below ROE because it excludes the boost from leverage. Around 7% is typical for a capital-intensive integrated oil producer.
Is Cenovus’s ROE good?
On a relative basis, yes — it leads the supermajors and its Canadian peers on ROE. But it is cyclical and leverage-assisted, and on return on invested capital Cenovus actually trails Suncor and Imperial Oil.
How is Cenovus’s ROE calculated (DuPont)?
Net margin (8.8%) × asset turnover (0.81) × financial leverage (1.99x) ≈ 14.2%. The DuPont split shows margin — the oil-price lever — is the main driver of the swings.
What’s the difference between Cenovus’s ROA and ROE?
ROE (~14%) is roughly double ROA (~7%) because ROE reflects financial leverage of about 2x, while ROA measures return on the entire asset base regardless of how it is financed.
How does Cenovus’s ROE compare to Suncor and Exxon?
Cenovus’s ROE (~14%) edges Suncor (~13.8%) and comfortably beats ExxonMobil (~9.7%) and Chevron (~5.8%). On return on capital, however, Suncor and Imperial rank ahead of Cenovus.
Why did Cenovus’s ROE turn negative in 2018 and 2020?
Asset impairments in 2018 and the COVID-driven oil-price collapse in 2020 pushed net income negative. With ~2x leverage, those operating losses were amplified at the equity level.
How will the MEG Energy acquisition affect Cenovus’s returns?
Near term, the added assets and equity can dilute ROA and ROE. Over multiple years, targeted synergies ($150M rising to $400M+) and added oil-sands volumes are the intended offset. Watch the 2026–2027 prints.
References
- FinancialBeings (Internal). CVE Valuation Results and DuPont TTM Models — Proprietary ReOI and DuPont decomposition, data pull 17 June 2026.
- Yahoo Finance. Cenovus Energy Inc. (CVE) — Stock Price, Quote, News & History (live price and market capitalisation). View Source
- Cenovus Energy. Fourth-Quarter and Full-Year 2025 Results — News Release (Q4 net earnings, full-year production). View Source
- Cenovus Energy. Cenovus Completes Acquisition of MEG Energy — November 2025 Announcement (deal terms and synergy guidance). View Source
- Cenovus Energy. Investor Relations — Quarterly Reports, MD&A and Financial Statements. View Source
- SEC EDGAR. Cenovus Energy Filings — Form 40-F and 6-K (FY2025). View Source
- Macrotrends. Cenovus Energy — Return on Equity and Return on Assets, 2010–2025 (peer/historical context). View Source
- StockAnalysis. Cenovus Energy (CVE) — Statistics & Valuation (peer ratio context). View Source
