What Is the Intrinsic Value of Nvidia Stock? 2026 Analysis
What is the intrinsic value of Nvidia stock in 2026? This analysis evaluates Nvidia’s revenue growth, margins, and earnings power to estimate fair value and determine whether NVDA may be overvalued or fairly priced.
What Is the Intrinsic Value of Nvidia Stock Today amid AI Boom?
Many investors are now enquiring about the intrinsic value of Nvidia stock, since Nvidia is now one of the most powerful companies in the artificial intelligence business across the world. The GPUs provided by Nvidia operate the data centres, AI training models, high-performance computing, and numerous other advanced technology platforms.
Intrinsic value is the actual economic value of a company in terms of its ability to generate earnings, profitability and its potential to grow in the future as opposed to the mere market price of the stock. Financial indicators, including revenue growth, margins, free cash flow, and returns on capital, are some of the financial indicators that investors use to estimate intrinsic value.
Table 1: Nvidia financial information for the last two quarters
| Metric | Latest Value |
| Revenue | $68,127M |
| EBITDA | $51,283M |
| Free Cash Flow | $34,904M |
| Gross Margin | 75.00% |
| Operating Margin | 65.02% |
| Net Margin | 63.06% |
These figures indicate that Nvidia is already working under extremely high profitability and high cash generation. The intrinsic value estimate of the company is well supported by the high margins and the high rate of revenue growth.
The biggest question for the investors, however, is whether such levels of profitability are sustainable in the long run. To calculate what is the intrinsic value of Nvidia stock, it is thus necessary to further analyze the growth sustainability and the competition.
What is the Intrinsic Value of Nvidia Stock and Why It Matters in 2026
It is relevant to understand what the intrinsic value of Nvidia stock is since the stock prices are likely to fluctuate fairly fast due to the market expectations, whereas the intrinsic value is aimed at concentrating on the actual financial performance and ability of a company to generate earnings in the long term. Nvidia has improved financial results, which indicate a good basis that can justify its valuation. For instance, the growth of revenues grew as much as $44,062M in FY25 Q2 to $68,127M in FY26 Q1, and EBITDA increased as much as it grew by $22,584M to $51,283M indicating accelerated growth in AI infrastructure demand.
The profitability is also very high with a gross margin of 75.00% and the operating margin of 65.02% which implies that the power of the price in the AI chip market is very high. Further, the residual earnings grew to $4.57 per share and its return on net operating assets stood at approximately 206%, indicating that Nvidia is capable of bringing high economic returns.
Intrinsic Value vs Market Price
Intrinsic value is the fair price of a firm in accordance with the future expected earnings. Market price, on the other hand, represents the price which investors are paying today based on future expectations.
Investors would normally analyze what is the intrinsic value of Nvidia stock based on:
- Revenue growth trends
- Profitability margins
- Cash flow generation
- Competitive advantages
- Industry demand outlook
When the market price increases by a considerable margin more than the intrinsic value, investors will experience reduced returns in the long run. Alternatively, when the intrinsic value is greater than the market price, there is a possibility of a margin of safety in the stock.
Why Valuation Discipline Matters in an AI Boom
The artificial intelligence boom has made artificial intelligence companies so much in demand that the investors are buying their shares hands over fists. NVIDIA is currently the hegemon in supplying the architecture and software to all the big companies in the world, and this is the reason why its financial performance has been surging so fast. But, in the times of booms, valuation discipline is imminent because little shift in sentiment due to negative market developments hit the valuation significantly.
What Is the Intrinsic Value of Nvidia Stock Today Based on 2026 Financials?
According to the 2026 financial data, it is proposed that Nvidia is backed up with its intrinsic value due to great profitability and capital efficiency. The margins of the company have increased remarkably, as the gross margin of the company stands to 75.00% and the operating margin stands at 65.02%, which depicts that the company possess good pricing power in the AI chip market. Moreover, Nvidia is producing a high level of economic profit out of its operations, as its net operating assets going back up to approximately 206%, with residual earnings standing at $4.57 per share.
Revenue Growth and AI Infrastructure Demand
One of the most significant measures of long-term value of a company is the revenue growth.
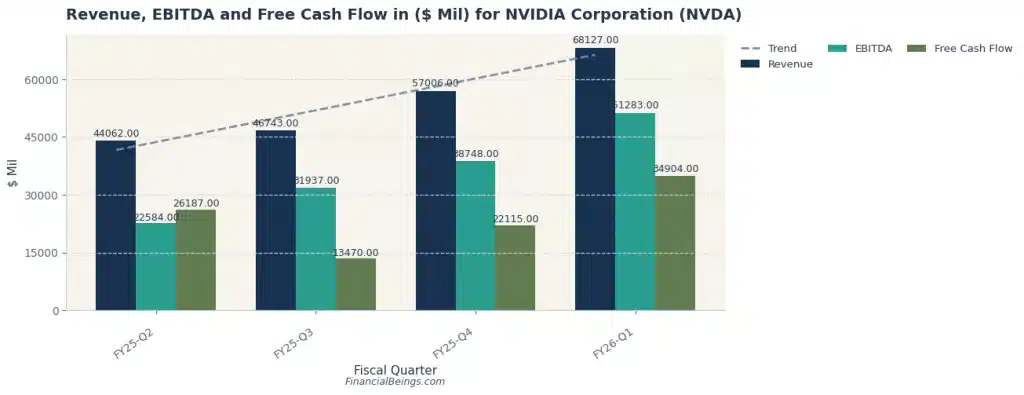
Figure 1: Nvidia Revenue, EBITDA and Free Cash Flow Growth
Table 2: financial growth across several quarters.
| Quarter | Revenue ($M) | EBITDA ($M) | Free Cash Flow ($M) |
| FY25 Q2 | 44,062 | 22,584 | 26,187 |
| FY25 Q3 | 46,743 | 31,937 | 13,470 |
| FY25 Q4 | 57,006 | 38,748 | 22,115 |
| FY26 Q1 | 68,127 | 51,283 | 34,904 |
To begin with, the level of revenue was up by a large margin, with a difference of $44,062M and $68,127M, which points to a high demand for the Nvidia products. This increase is indicative of the growth of AI infrastructure and data centre investments around the world.
Second, the EBITDA grew from $22,584M to $51,283M, indicating that the profitability of Nvidia is also growing at a higher rate than its revenue.
Third, the company had a free cash flow of $34,904M, which shows that it is able to raise a decent amount of cash, which can be reinvested in research and development, as well as in infrastructure.
Operating Margin Sustainability
Profit margins help in understanding the effectiveness of a company to convert revenue to profit.
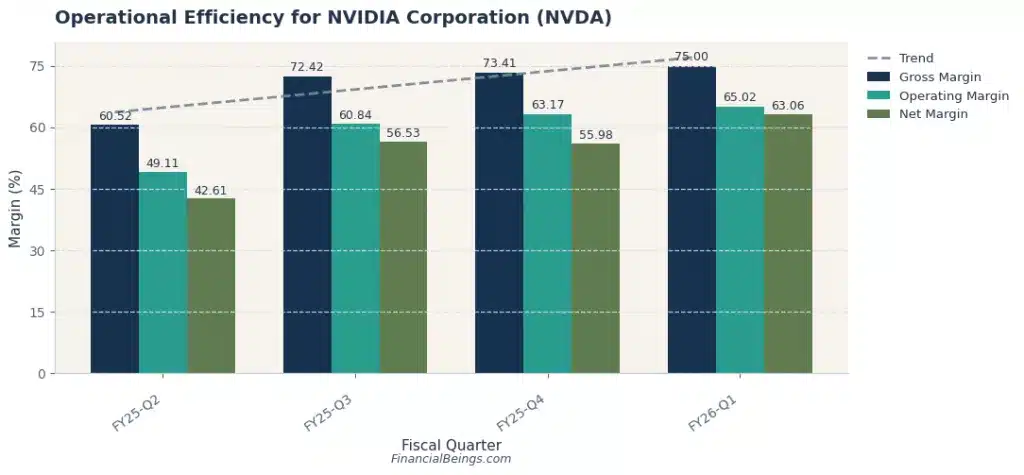
Figure 2: Nvidia Operational Efficiency and Margin Expansion
Table 3: Nvidia Operational Efficiency and Margin Expansion
| Quarter | Gross Margin | Operating Margin | Net Margin |
| FY25 Q2 | 60.52% | 49.11% | 42.61% |
| FY25 Q3 | 72.42% | 60.84% | 56.53% |
| FY25 Q4 | 73.41% | 63.17% | 55.98% |
| FY26 Q1 | 75.00% | 65.02% | 63.06% |
NVIDIA became very profitable over time. It increased gross margin to 75.00% in comparison to 60.52%, which means that the pricing power is strong.
The operating margin improved to 65.02%, very high in terms of large technology companies. The presence of these margins implies that Nvidia is in a highly demanded and low competition market today.
Earnings Power in the Current AI Cycle
Residual earnings per share are another important measure adopted in valuation that shows economic profitability.
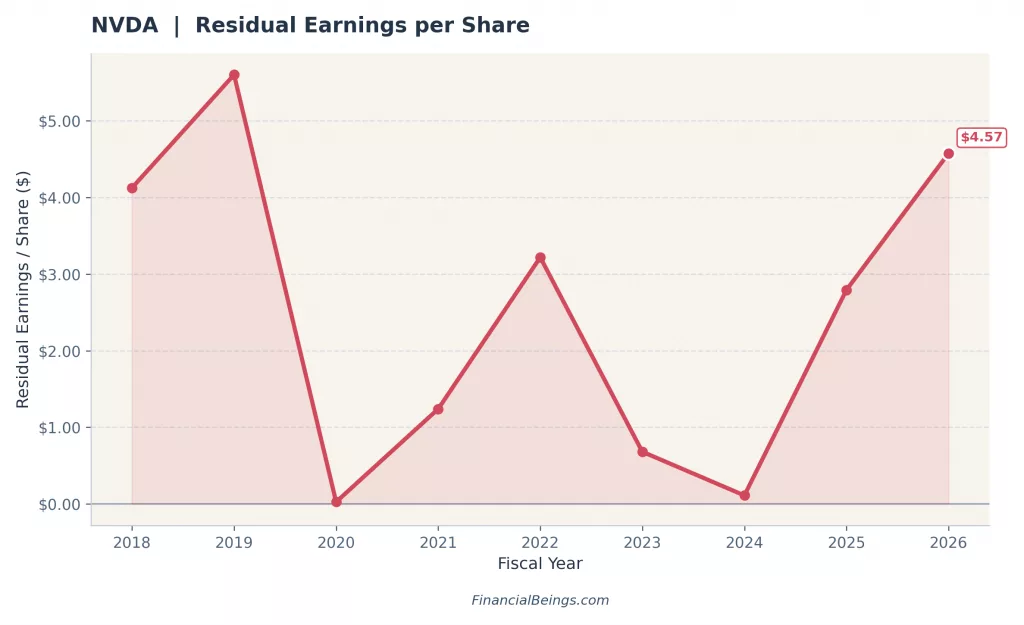
Figure 3: Nvidia Residual Earnings per Share
Table 4: Nvidia Residual Earnings per Share
| Year | Residual Earnings |
| 2018 | $4.1 |
| 2019 | $5.6 |
| 2020 | $0.0 |
| 2021 | $1.2 |
| 2022 | $3.2 |
| 2023 | $0.7 |
| 2024 | $0.1 |
| 2025 | $2.8 |
| 2026 | $4.57 |
The residual earnings got even higher in the year 2026 to a level of $4.57 per share. This is a pointer that Nvidia is making high levels of economic gains and it is covering the cost of capital as well as creating value for the shareholders.
What Is Nvidia Stock Intrinsic Value Compared to Its Current Market Price?
A value intrinsic analysis will be used to assess the estimated economic value of Nvidia against the current market value to establish whether the stock is overvalued or undervalued. According to the growth sensitivity scenario matrix, Nvidia’s intrinsic value lies between $1,117B current value under a -2 % growth and $5,918B current value under 8% growth, with central values (3% and 5% growth) indicating a range of values between $2,677B and $3,833B.
Table 7: Growth Rate and Valuation Outlook
| Growth Rate | Valuation Outlook |
| 0% | Mature semiconductor company |
| 1% | Low growth |
| 2% | Conservative valuation |
| 3% | Stable technology firm |
| 4% | Moderate AI expansion |
| 5% | Strong growth |
| 6% | High AI adoption |
| 7% | Dominant AI platform |
| 8% | Aggressive growth expectations |
Figure 6: Nvidia Intrinsic Value Growth Sensitivity (-2–8%) Scenario Matrix
Financial Beings Valuation Lens (Interactive Chart)
Intrinsic Value for Nvidia Stock Under Different Growth Scenarios
NVIDIA Intrinsic Value Sensitivity Model (2026)
How different long-term growth assumptions change NVDA’s intrinsic value
| Growth (%) | Intr. Value ($B) | Price / Share | V/P % | Exp. Return % |
|---|
V/P > 100% → The stock is undervalued. Intrinsic value exceeds the market price — you are getting more than you are paying for. V/P < 100% → The stock is overvalued. The market price exceeds intrinsic value — the price embeds growth expectations the model hasn’t yet confirmed. V/P = 100% → The stock is fairly valued. Price equals model value at the assumed growth rate.
At 2–6% growth, NVDA’s intrinsic value is well below its current market price — meaning the market is already pricing in something much more ambitious. Only above ~7–7.5% growth does the model suggest the stock is fairly valued or undervalued.
⚠️ Sustaining above 7% long-term growth is historically very difficult — even for exceptional businesses. The S&P 500’s long-run earnings growth averages around 5–6%. For NVDA to justify its current market price, it must outgrow the broader market by 1–2 percentage points indefinitely — a high bar that assumes the AI infrastructure buildout continues to drive extraordinary demand well beyond current visibility. This does not mean it is impossible, but it is a demanding assumption that investors should weigh carefully.
Assuming long-term growth is central to intrinsic value estimation, analysts attempt to check various scenarios through sensitivity analysis. The growth sensitivity matrix indicates that the intrinsic value of Nvidia is between $1,117B to $5,918B in the case of a -2% growth situation and 8% growth situation, respectively, indicating the sensitivity of the valuation to various growth expectations.
Investor letter
If you have read this far, you already think differently about investing.
Get valuation research like this delivered weekly. Hard numbers, clear language, no hype, and no sponsored stock picks.
Conservative Case: 2–3% Long-Term Growth
The conservative case considers the long term growth rate between 2-3% and our analysis indicates the intrinsic value is in the range of 1600 ($66 per share) billion to 1800 ($74 per share) billion. This is the long-term GDP growth rate scenario and if NVDA’s growth contracts the market value will be considerably contracted. Though for a growth company it is highly unlikely.
Under this scenario:
- Revenue growth declines
- Margins gradually decline
- Cash flows plummets
Although this is a conservative scenario, Nvidia already has a solid base to be valued based on its current profitability.
Base Case: Sustainable AI Expansion
The Base case assumes the market condition where NVDA’s market share depletes. Competition from other custom chipmakers like Alphabet and Amazon snatch the market share and Nvidia’s growth scales back to 4-6% range. In this case our analysis indicates the intrinsic market cap to be between 2077 ($86 per share) billion and 3038 ($125 per share) billion, still lower than the current market cap.
High-Growth Case: Continued AI Dominance
As long as Nvidia continues to be technologically ahead in the field of GPUs and AI platforms, the growth will stay high. The growth assumptions for high growth scenario is above 7%, and at above 7% growth rate the investors can gain benefit in terms of higher price per share. The price per share would be in the range between $169 and $249. However, investors must keep in mind that the growth rate above 7.5% would provide share price upside between $200-$249.
The high RNOA of 206% states that Nvidia can produce higher returns even with a smaller operating assets base of $158.1 billion. It indicates that Nvidia does not require to do heavy lifting in production because that is done by TSMC.
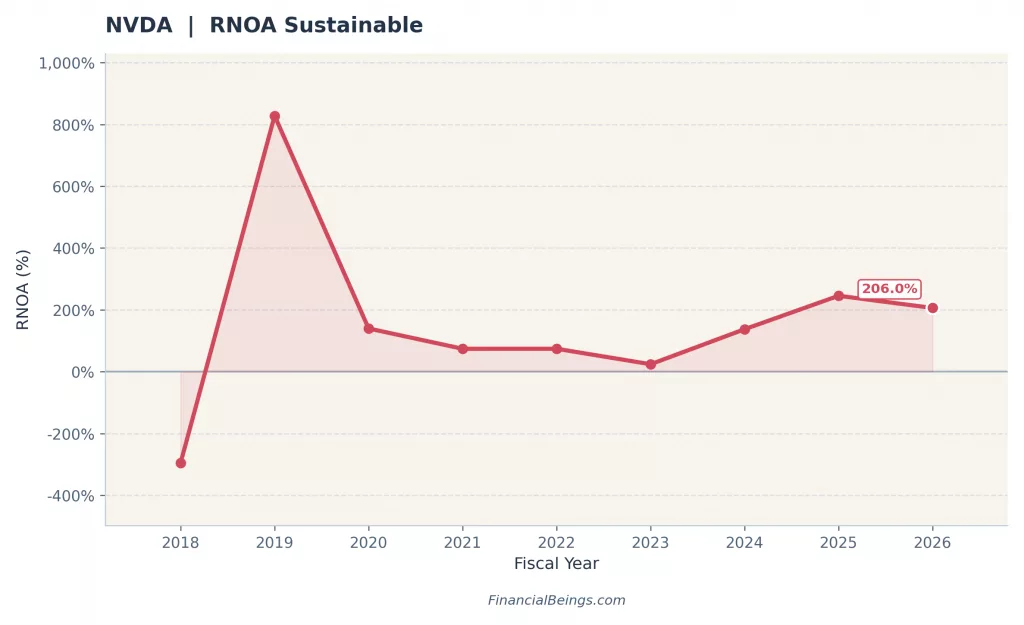
Figure 5: Nvidia Return on Net Operating Assets
Figure 6: Nvidia Return on Net Operating Assets
| Year | RNOA |
| 2023 | ~30% |
| 2024 | ~140% |
| 2025 | ~250% |
| 2026 | ~206% |
A ratio exceeding 200% on the returns on net operating assets is an indication of very efficient utilization of capital. Companies that create such high returns would tend to create a great deal of shareholder value. But growing beyond long-term growth rate of 7% is very difficult for an already $4+ trillion company.
Is Nvidia a Value Trap in 2026?
NVIDIA is highly profitable and a leader in the field of AI, but at the same time, some investors already express their doubts that the company may turn into a value trap in case growth prospects turn out to be overambitious.
How Much Future Growth Is Already Priced In?
According to the scenario matrix, the valuation of Nvidia will be based on the sustained AI growth. Indicatively, intrinsic value increases drastically between 3% growth of some $2,677B and 7% growth of some $4,743B, indicating that even a minor increase or decrease in growth assumptions would have a profound impact on valuation. This implies that the size of the Nvidia market price can already incorporate a high demand for AI in the future (Financial Times, 2026). For a broader perspective on how the market values major AI-driven companies, you can also explore our Meta vs NVDA stock analysis.
Competitive Risks and Margin Compression
Although Nvidia is leading the market currently in AI GPUs, other companies in the semiconductor industry and other big cloud providers may slowly eat into the margins. Gross margin of 75% and operating margin of 65% are high, implying strong pricing power, but with the rise in competition, the margins may reduce with time. Stagnation or decline in profitability would have a direct impact on intrinsic value estimates (Yahoo Finance).
Downside Scenario Analysis
In downside scenarios where the growth is slow or the margins are declining, intrinsic value estimates are quite low. For example, the sensitivity of Nvidia valuation to less favourable growth conditions, the valuation model reveals intrinsic value, falling to $1,117B in the case of a -2% growth scenario. These situations demonstrate that growth sustainability should be analyzed in the assessment of the stock (Financial Times, 2026).
Profile Suitability: Who Should Own Nvidia Stock in 2026?
The various investors can rate Nvidia differently based on risk-taking ability, portfolio strategy and investment horizon.
Growth Portfolio
Investors who are focused on growth can be interested in Nvidia since the company can directly benefit from the growth of the demand for AI infrastructure. The company has the potential to grow in the long term due to strong revenue growth and high efficiency of the capital, including 206% return on net operating assets (Yahoo Finance).
Balanced Portfolio
To the diversified investor, Nvidia can be a strategic technology investment, but not a concentrated investment. Although the business has good growth potential, the diversification will mitigate the risks, should AI expenditure decelerate or the rivalry intensity in the industry rise.
Conservative Portfolio
Conservative investors should be cautious due to the high implied growth in its current market price at around 7-7.2%. That growth is very sensitive to future developments and any slow down in growth would impact the stock value significantly. The dividend-to-free-cash-flow ratio is an average 1.13%, that may interest conservative investors but that would be at the cost of higher volatility. The very low dividend implies that Nvidia is focused on growth investment at the expense of shareholders’ payouts.
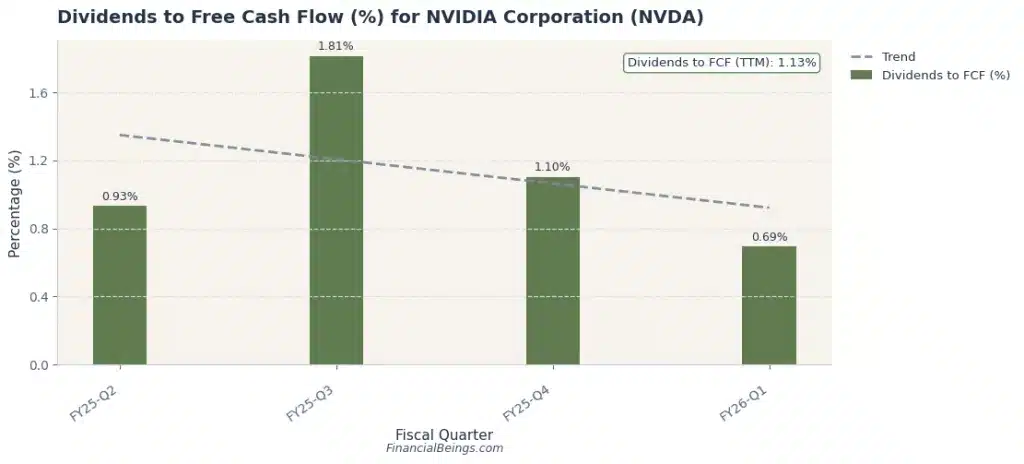
Figure 7: Nvidia Dividends to Free Cash Flow
Table 8: Nvidia Dividends to Free Cash Flow
| Quarter | Dividend / FCF |
| FY25 Q2 | 0.93% |
| FY25 Q3 | 1.81% |
| FY25 Q4 | 1.10% |
| FY26 Q1 | 0.69% |
The dividend will only constitute 1.13% of the free cash flow, showing Nvidia focuses on reinvesting in expansion.
Final Verdict: What Is the Intrinsic Value of Nvidia Stock in 2026?
The valuation analysis indicates that Nvidia has an intrinsic value that ranges significantly across the growth prospects in the long term. Using the scenario matrix, the intrinsic value can be estimated at $1,600B ($86 per share) in a low-growth scenario to about $5,918B ($244 per share) if strong growth AI assumptions are put into perspective. This broad spectrum implies that Nvidia is not fully valued in the market today because of the anticipation of further growth in AI infrastructure. Consequently, this makes the possible value-price correlation, as well as anticipated returns, greatly reliant on the ability of Nvidia to maintain high growth and profitability.
Under these dynamics, Nvidia stock will tend to be included in more growth-oriented investor portfolios who can tolerate valuation sensitivity to get long-term opportunities due to AI.
All calculations and valuation estimates are FinancialBeings’ own, based on data sourced from SEC filings of NVDA (10K and 10Q), use or reproduction before prior approval is prohibited. Some comments are taken from (Financial Times) https://www.ft.com.
