Nvidia vs Google Stock. Discuss the growth drivers, AI leadership, financial momentum and the long-term positioning of the companies that will see which of the companies is stronger in 2026.
Overview
The Nvidia vs Google Stock has turned out to be one of the most crucial debates in the modern investment arena, especially with artificial intelligence being introduced in practically every industry. The two companies are at the centre of this shift, yet they accumulate the AI ecosystem in completely disparate ways.
NVIDIA designs the GPUs, computer networks & accelerated computing hardware on which AI models are executed. Google is, nevertheless, a consumer goods provider of mass scale, enterprise applications and cloud AI infrastructure that billions of people actively interact with every day (Alphabet Inc., 2024; Nvidia Corporation, 2024).
These conflicting roles create two contrasting investment identities. Nvidia is at a higher place in the AI value chain. When enterprises, governments or cloud providers require the ability to train larger models, scale up their data centres or compete in generative AI, their demand will automatically be channeled to hardware sold by Nvidia. This will classify the company as having high-growth potential, with revenues usually unstable and AI expenditure patterns fluctuating.
Google is broader and diversified. It has revenue in its worldwide search engines, YouTube, Android, productivity and cloud customer base. Google is also investing in AI, but it is also tied to long-term, recurring user activity, and not short bursts of infrastructure demand, because of its financial performance.
This is one of the reasons why Google is appealing to the investors in search of stability, continuous compounding and giant markets which transform gradually as time passes.
The comparison of Nvidia stock to that of Google frequently grounds the choice of the investors on two topics:
- Acceleration vs. Stability: Nvidia is able to offer fast growth, and Google is able to offer stability.
- Hardware-based AI vs. Software-based AI: Nvidia sells the compute layer, and Google sells search, workflows to the cloud, advertising and AI-enabled services.
Revenue Growth and Cash Flow Strength
One of the key points of the NVDA vs GOOGL investment analysis is to examine how innovation translates into financial results for both firms.
Alphabet (Google)
Google’s revenue is increasing steadily, from 259 billion USD in 2021 to approximately 350 billion USD in 2024. The EBITDA is also rather high because it will amount to about 136 billion USD in 2024, and free cash flow will be in the range of 73 billion USD.
The trend is one which conforms to the diversified nature of the company in the search, YouTube, Android and Google Cloud (Alphabet Inc., 2024). The sameness shows how much the Google services have become integrated into the daily Internet life to the point that the company has a stable source of recurring revenues.
The advertising periods are not predictable, yet, being widely utilised all over the world, volatility is reduced, and sustainable growth is ensured. Google Cloud is also an addition of greater meaning, which offers services of enterprise AI and infrastructure that broadens the revenue base of the company.
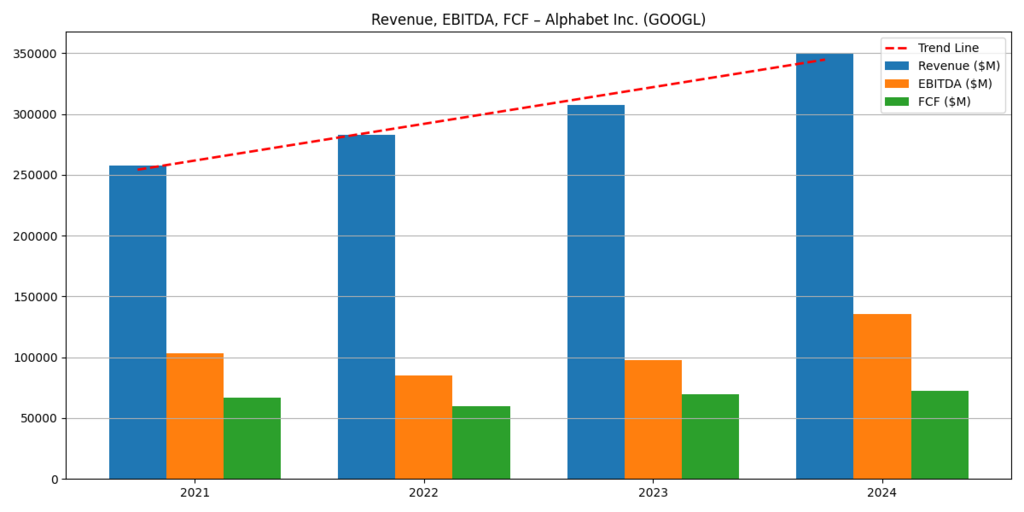
Figure 1. Revenue, EBITDA and Free Cash Flow for Alphabet Inc. (2021–2024).
Nvidia
Nvidia revenue also grows enormously because it is projected to hit an estimate of 27 billion USD in the year 2022 to more than 131 billion USD in the year 2025. It is also increasing at the same rate as EBITDA and free cash flow, a manifestation of the unknown demand for AI compute infrastructure (Nvidia Corporation, 2024). Such an increase rate in many large-cap companies is scarcely witnessed in the past.
The data presented by such a boom highlights the significance that Nvidia GPUs have had in upgrading data centers, cloud expansion workloads, and generative AI workloads.
All major waves of model training or enterprise adoption of AI can be directly traced to hardware requirements, which give Nvidia a rare resource: product and revenue cycles are co-located. This is also a positive sign to investors that Nvidia is reaping the majority of the value during the first phase of the AI buildout.
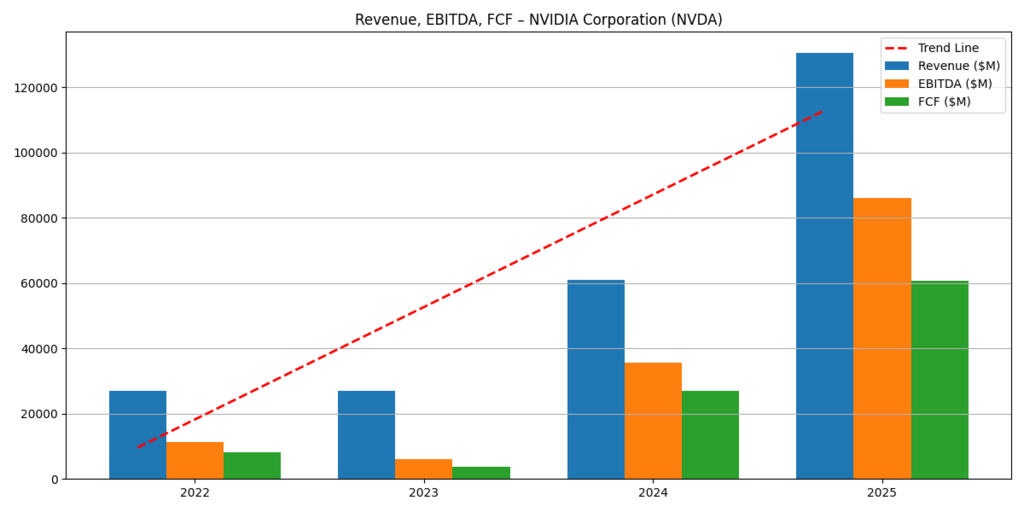
Figure 2. Revenue, EBITDA and Free Cash Flow for Nvidia Corporation (2022–2025)
Google is behaving like a stable compounder. Nvidia is a high-growth cycle organisation. The investors who prefer not to risk as much will stick to the smoother path that Google will take, and the investors who like to take risks will be attracted to the speed provided by Nvidia.
Operating Structure and Balance Sheet Scaling
The wisdom of the successful experience of every company to increase its asset base provides a better insight into whether it is sustainable in the long run.
Alphabet (Google)
The Net Operating Assets have increased many times as compared to 2016 and have been increasing continuously every year as Alphabet acquires additional computing space and cloud presence. There is also an increase in operating liabilities in a stable and proportional manner.
This is a pointer of a business growing its principal assets at a steady rate and at a projected rate as long as it continues to keep its liabilities at a very consistent rate with the long-term investment needs. This positive trend means that Alphabet is developing its infrastructure & there is no surplus operational risk.
The asset growth-liabilities ratio is a measure of the prudence of the financial management, which leads to long-term stability and competitive strength.
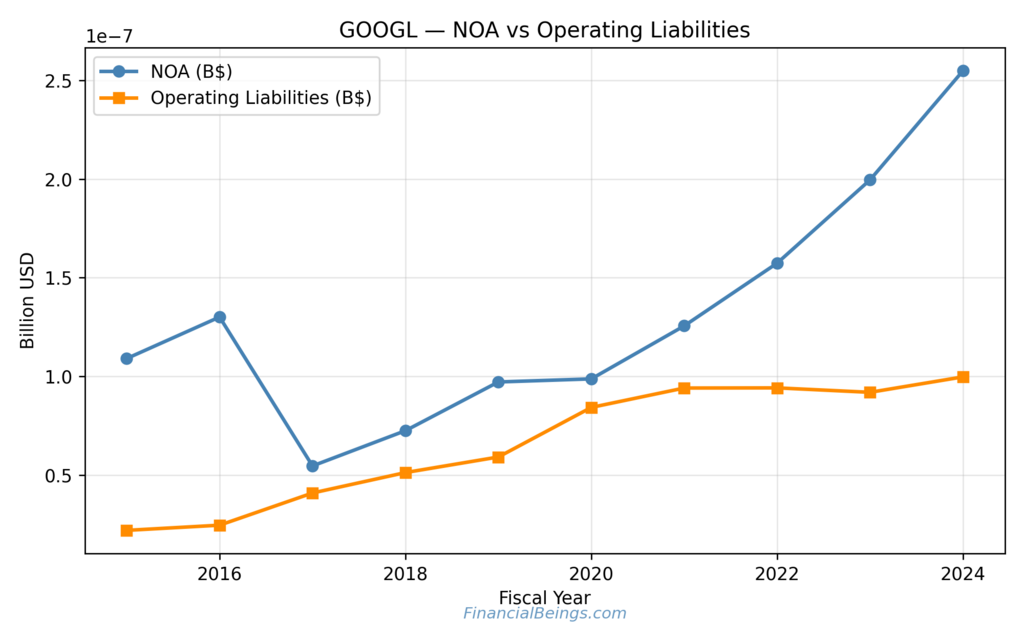
Figure 3. Alphabet Net Operating Assets and Operating Liabilities (2016–2024).
Nvidia
The Net Operating Assets of Nvidia are on the rise with growth between 2019 and 2025, which implies the accelerated pace with which the business would be increasing its production capacity, data centre hardware, and Artificial Intelligence compute solutions. The growth in operating liabilities in the same period is also greater. Taken altogether, the trends reflect a lack of sustainability, aggressive growth of the business to fit the global need in the AI market growth prediction and a strong investment in the supply chains and the research and development. Although the strategy will enable the company to attain high growth potential, it will also come with heightened intensity of operations and sensitivity to future fluctuations in enterprise spending on AI.
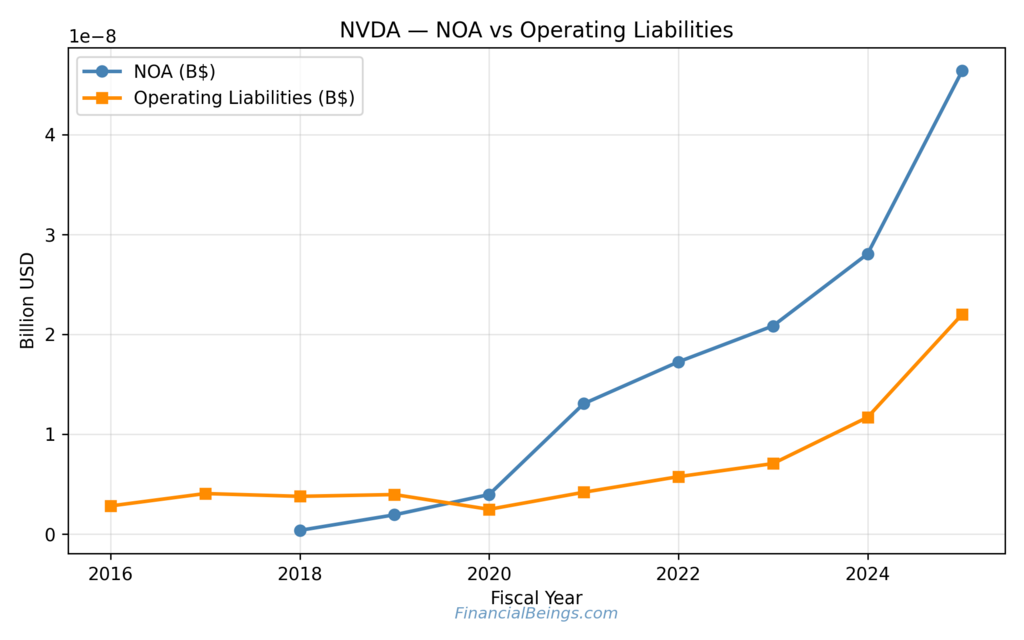
Figure 4. Nvidia Net Operating Assets and Operating Liabilities (2016–2025).
RNOA Performance and Profit Quality
Return on Net Operating Assets (RNOA) provides an idea of the effectiveness of assets in producing operating returns.
Alphabet (Google)
The RNOA of Google is 10 to 65 per cent in the period indicated. Its stability reflects the strength of recurring revenue firms backed by the global user-based interaction. It is one of the paradigms where search and advertising demand and cloud services remain stable enough to ensure the relative stability of returns even during the cycles of the slowdown of the economy. This predictability is one of the reasons that the institutional investors tend to view Google as a predictable long-term compounder. The stable growth of RNOA is also a positive sign that Alphabet can continue to get value out of its current asset base without the necessity of making severe swings in investment.
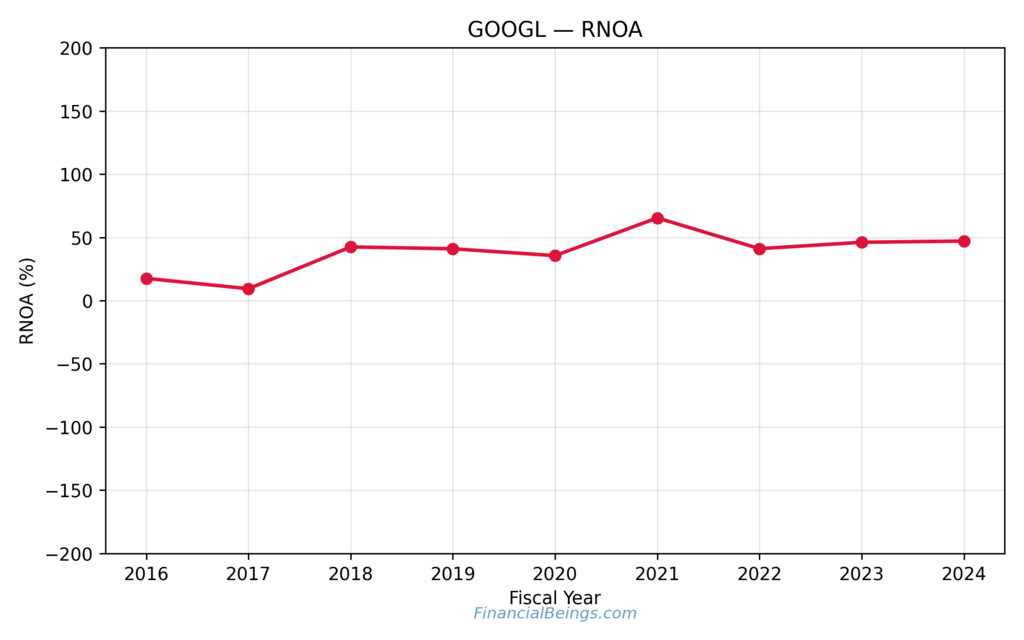
Figure 5. Alphabet RNOA Trend (2016–2024).
Nvidia
RNOA of Nvidia swings wildly with negative figures and then the highest figure of more than 200 per cent, then declines and again goes high to 2024-2025. This volatility is indicative of semiconductor cycles, AI spend waves & tremendous data-center investment swings.
These are the normal trends for businesses involved with fast-moving hardware, where demand can surge, and demand decreases as customers move through upgrade cycles.
The peaks in the drama would also reflect how well Nvidia converts new AI-generated revenue to the operating returns in case the business environment is favourable. As much as swings also result in increased risk, it also confirms the fact that Nvidia is in a situation to derive an enormous amount of value in case there is tremendous growth in AI infrastructure.
Figure 6. Nvidia RNOA Trend (2018–2025)
The investors who put value on smooth compounding may favour Google. NVIDIA tends to have investors with an interest in cyclical swings in exchange for probably higher returns.
Strategic Positioning in the AI Landscape
Alphabet’s AI Ecosystem Growth
Google develops machine intelligence in the ranking of search, YouTube recommendations, cloud computing, Android and productivity. Businesses are introducing AI-aided workflows to this ecosystem of the future, which is growing in size. The scale of the platforms where the company is operating creates long-term cash flow in case of lumpy macro conditions (Alphabet Inc., 2024). This goes in tandem with these topics mentioned in the Google stock forecast 2026 and the Alphabet AI ecosystem growth.
Nvidia and AI Compute Demand
The world is on a trend of building AI training and inference infrastructure, which Nvidia is enjoying. The Nvidia platforms are used in all big AI laboratories and cloud platforms in their GPUs; thus, the firm is at the core of the future of the machine learning workload. This need reflects the Nvidia GPU acceleration impact on it and can be considered a sign of the high interest of investors in the Nvidia stock outlook 2026 (Nvidia Corporation, 2024). This need underscores the accelerated growth highlighted in the Financial Beings Nvidia stock forecast, showing how enterprise AI adoption is translating into substantial revenue surges.
Semiconductor vs Cloud AI
This gap characterises the Semiconductor vs cloud AI competition narrative. Physical AI infrastructure is under the control of Nvidia. Google monetises the applications, workloads and interfaces that it builds on that infrastructure. For a broader perspective on how Nvidia compares with other major chipmakers in the AI-driven market, check out our semiconductor stocks value comparison.
Risk, Valuation Tone and Portfolio Fit
Google is traditionally viewed as a less-volatility compounder, the one with constant free cash flow, predictable revenues and stable platforms worldwide (Alphabet Inc., 2024). Nvidia has greater chances to be valued at higher valuation levels because it is a market in which long AI infrastructure cycles are an option (Nvidia Corporation, 2024).
From a portfolio-construction perspective:
Google Benefits:
- Stable operating returns.
- Diverse sources of revenues.
- Little sensitivity to technology.
Nvidia Benefits:
- Exceptional acceleration of revenue.
- Great positioning of AI hardware.
- Growing free cash flow base.
The two companies could be complemented on a stabiliser/high-growth engine strategy, with Google installed at the stabiliser and Nvidia as the engine.
NVDA vs GOOGL valuation metrics
| Category | Nvidia | |
| Revenue Trend | Slow and steady | Extremely rapid growth |
| Free Cash Flow | High and stable | Rising dramatically |
| RNOA Pattern | Consistent | Volatile with high peaks |
| Operating Style | Controlled scaling | Aggressive expansion |
| Risk Level | Moderate | Higher |
| Long-Term Role | Core stability | High-growth satellite |
| AI Position | Software, cloud, ads | Global AI compute infrastructure |
| 2026 Appeal | Stability with growth | High upside with cycles |
Conclusion
The choice to invest in Nvidia vs Google Stock comparison is in the discretion of the temperament. Google has predictability, recurring cash flow and an expansive AI-based platform. NVIDIA offers an unstable expansion backed by the global need for the acceleration of AI. The two companies play vital roles in the Best AI stocks to buy for 2026, and both are on a good financial trajectory, as indicated by the data.
The investors who would like to receive constant compounding can be better suited to Google. Nvidia might be biased towards individuals who wish to expand their operations in AI infrastructure. Many long-term investors will like to own both, and stability versus the upside potential.
All calculations and valuation estimates are FinancialBeings’ own, based on data sourced from SEC filings MSFT (10K and 10Q) and CRM (10K and 10Q), use or reproduction before prior approval is prohibited.
Frequently Asked Questions (FAQs)
Which is better, Nvidia or Google?
Nvidia and Google will be winning in different aspects, and hence the better choice will be what an investor wants. The company is Nvidia, which is valued at about $4.3 trillion. The accelerated growth is being caused by the high demand for AI chips and data-centre equipment. With the approximate value of $3.9 trillion, Google is more stable and has no single income but from search, advertising and cloud computing products. Stock market Nvidia is able to capture the attention of the investors who are high-momentum oriented, and Google suits the long-term oriented investors.
Who is the biggest competitor for Nvidia?
The biggest competitor that Nvidia (NVDA) has to deal with is Alphabet (GOOGL), which also produces TPUs to be deployed to data centres, gaming and AI tasks. GOOGL has a full stack from TPUs to generative AI to challenge Nvidia. The competition is also increasing as AMD and certain AI-based chip startups are headed in the same direction. In the case of such competitors, Nvidia may face stiff competition in the future.
Usama Ali
Usama Ali is the founder of Financial Beings and a self-taught investor who blends classic valuation study with insights from psychology. Inspired by works from Benjamin Graham, Aswath Damodaran, Stephen Penman, Daniel Kahneman, and Morgan Housel, he shares independent, data-driven research to help readers connect money, mind, and happiness.
Disclaimer
The content provided herein is for informational purposes only and should not be construed as financial, investment, or other professional advice. It does not constitute a recommendation or an offer to buy or sell any financial instruments. The company accepts no responsibility for any loss or damage incurred as a result of reliance on the information provided. We strongly encourage consulting with a qualified financial advisor before making any investment decisions.
