MSFT vs CRM Stock – Determine which tech stocks, Microsoft (MSFT) vs Salesforce (CRM), have a brighter future of expansion over the coming years from 2026 and beyond. The three indicators (valuation risk, earnings power and growth sensitivity) that we have offered will help you make smarter investment decisions.
Overview
The question that investors are going to ask themselves before 2026 is as follows: Is it better to invest more capital in Microsoft or Salesforce? The two companies are in control of enterprise digital budgets, both have a recurrent revenue model founded on subscriptions, and they both have a long-term contract that reduces churn. The two are, however, different in the type of value creation.
Microsoft is a differentiated ecosystem giant. Cloud (Azure), Windows licensing, Office 365 productivity suites, gaming, security tools, and AI integrations in all its stack would be the sources of revenue of the company. This is a combination that will help Microsoft to withstand a crashing market in one of the verticals. The company’s operating model is centred on high generation of free cash flows, low volitality of the margins and the best tech stocks for stable returns to shareholders in terms of dividends and buybacks. Then, MSFT is a long-term growth investing 2026 stock ideal for retirement plans, conservative investors, and those who want to be less volatile in case of economic tightening of economy.
Conventionally, companies with both cash buffers and cross-product relationships experience slower drawdowns during a recession because they can easily replace the whole ecosystem and are still not affected in terms of productivity.
Salesforce is, however, a narrower vertical leader. Its operations depend on the uptake of enterprise CRM, workflow automation, sales cloud, service cloud and expansion on the basis of analytics. The added value to CRM has been pegged on the rapid expansion acquisition foundation in the last 10 years and has since been reciprocated with a new path of value on profitability reorganisation. This makes Salesforce a growth-recovery investment, or one which may prove to pay off to investors with greater upside, if the global IT spending accelerates and budgets on enterprise software are enlarged.
In simple terms:
- Microsoft = Compounding safety, predictability, stability.
- Salesforce = Better upside prospective and high implementation risk.
A long-run stability goal portfolio would overweight Microsoft, but a growth-seeking strategy would overweight Salesforce to exploit a momentum of margin expansion. Many of the institutional funds have a core-satellite model of institutional portfolios with MSFT as the core and CRM as the engine of growth in the satellites. The merger of the two reduces the Microsoft vs Salesforce stock valuation risk analysis, stock performance, and subjects the company to complementary opportunity curves – defensive stability of Microsoft and cycle-sensitive upside of Salesforce.
Revenue Engines and How They Behave
The two engines of the two companies are structured in different ways, yet they all earn their largest revenues in terms of subscription and license fees.
Microsoft spreads its revenue among various pillars: cloud services, office Productivity, operating systems, and other enterprise software. The revenue growth of Microsoft between 2022 and 2025 rises from 198.3B to 281.7B is a very smooth curve; there does not seem to be a point of stalling in between. This type of line is normally an indication of a combination of products at work rather than the load being on one product. Microsoft itself claims that its model is based on the Productivity and Business Processes, Intelligent Cloud, and More Personal Computing, all of which contribute a significant source of revenue and operating income to it (Microsoft Investor Relations, 2024).
The engine of Salesforce is more focused. CRM and other related cloud applications, Sales Cloud Service, Cloud Marketing and Commerce, Platform and Data and Slack make up the bulk of the revenue. The sales grow between 26.6B in 2022 to about 38B in 2025, once again with a uniform slope, with a much smaller base. It is a sign of the strength of subscription agreements in buyer relationship management and the analytics (Salesforce Investor Relations, 2024). However, since Salesforce is more reliant on front-office software for its turnover, it is more prone to sales, hiring and marketing spending. Salesforce vs Microsoft fundamentals:
- The big tech earnings resilience of Microsoft is a giveaway of a multi-engine jet. In case one business slows down, others can be in a position to push up the growth.
- Salesforce has healthy bars, but they are the symbol of one large engine. In cases where CRM budgets are shaky, their impact is directly transferred to the top line.
- This is also among the key determinants for investors in comparison of enterprise software stocks. The risk in MSFT is distributed across more segments as compared to the centralisation of risk in a single and robust niche in CRM.
Revenue Expansion & Earnings Power
At a high compounding rate, Microsoft will enjoy increased revenue of about 281.7B in 2025 without aggressively acquiring customers, considering that this had 198.3B in revenue in 2022. This stability, to some extent, has a meaning due to the presence of Azure, Office 365 and enterprise licensing (Microsoft Investor Relations, 2024), which is automatically renewable and balances the changes in declines.
| 2025 Financial Outlook | Microsoft | Salesforce |
| Revenue | ~281.7B | ~38.0B |
| EBITDA | ~160.2B | ~11.5B |
| Free Cash Flow | ~71.6B | ~12.5B |
| RNOA | ~43% | ~10% |
| Overall Business Risk | Low | Moderate |
However, Salesforce expands between 26.6B and nearly 38B throughout the period (Salesforce Investor Relations, 2024). The quality of the revenue is satisfactory, but it is more dependent on sales cycles, staffing, and spending on the process of digital transformation, which fluctuate more in the conditions of tightening.
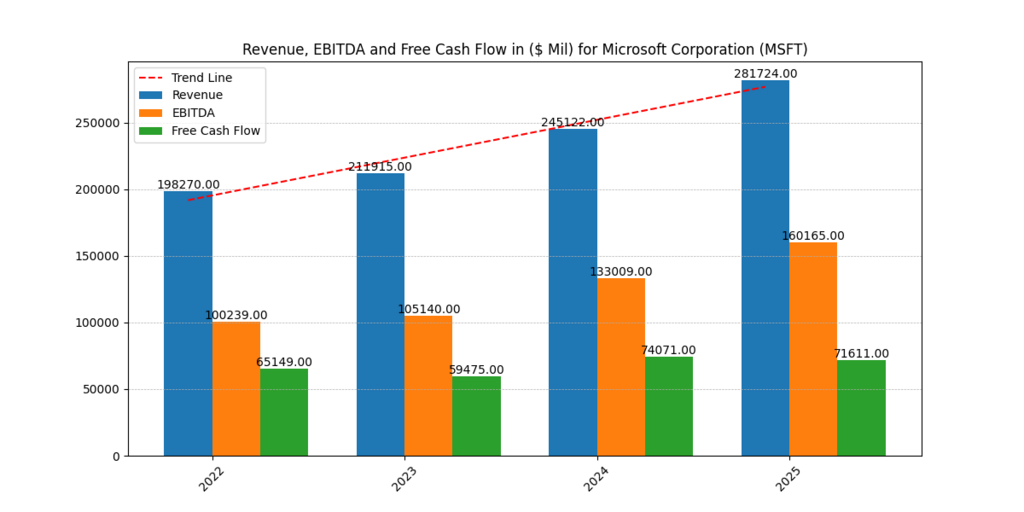
Figure 1: MSFT Revenue, EBITDA & FCF (2022–2025)
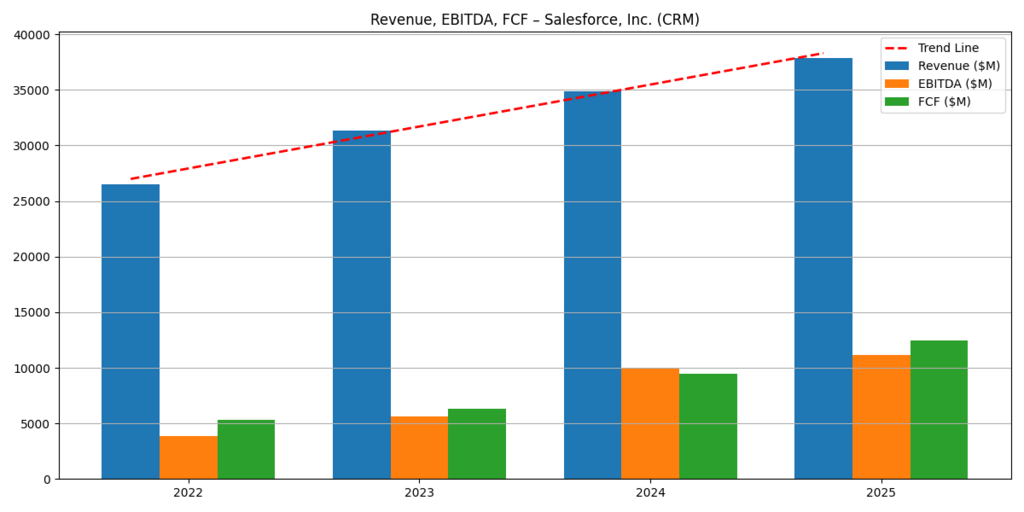
Figure 2: CRM Revenue, EBITDA & FCF (2022–2025)
Free Cash Flow Comfort Gap
High FCF means flexibility. Compared to Salesforce, Microsoft puts over 71B FCF in 2025. CRM has already become better than it was in 2022 due to the cost reorganisation taking effect (Salesforce Earnings Release FY24); however, MSFT stock outlook is 5x more efficient in terms of cash generation.
| FCF Trend | 2022 | 2023 | 2024 | 2025 |
| Microsoft | 65.1B | 59.5B | 74.1B | 71.6B |
| Salesforce | 5.2B | 6.3B | 9.6B | 12.5B |
Security is when the recession is taking place. Microsoft is in a position to maintain dividends, buybacks and research and development spending (Microsoft 10-K, 2024). Salesforce can also do it, but with a lesser number of cushions, and this makes CRM fall under the growth-risk category and MSFT under the wealth preservation category.
RNOA – Operational Return Advantage
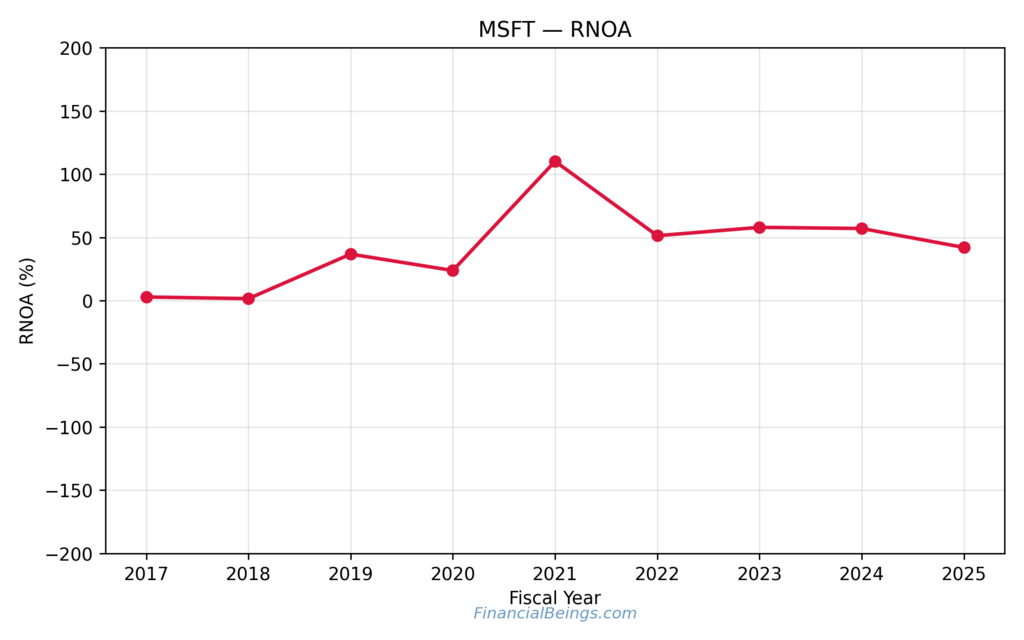
Figure 3: MSFT RNOA (2017-2025)
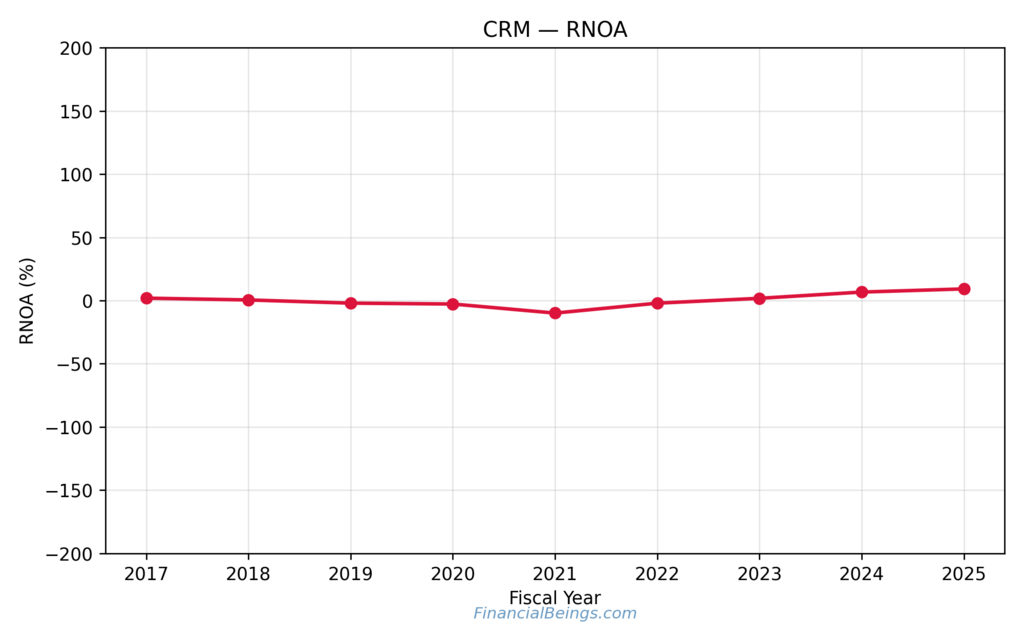
Figure 4: CRM RNOA (2017-2025)
Microsoft has shown 40-60% growth of RNOA between 2022-2025, and occasionally this would leap to a greater figure in case of additional margins on the cloud (Microsoft Investor Relations, 2024). It is a pointer to one thing that money causes Microsoft to change operating assets to make a profit.
Salesforce is projected to be 1 per cent in 2023 and 10 per cent in 2025, i.e. it is improving but not shifting (Salesforce Investor Relations, 2024). It is good for long-term holders; however, it also means that CRM stock growth forecast will be more vulnerable to cuts in the enterprise budget, as it is not yet established.
Balance Sheet & Capital Risk Profile
Microsoft is better situated on the balance sheet, and the quantities of free cash flows are high, and the growth of the NOA is steadily increasing and does not require borrowing to grow the company (Microsoft Investor Relations, 2024). The build of its asset base is also on the rise, and Salesforce seems to increase its operating debts more quickly than Microsoft, which leads to a signal of a slightly higher risk of capital, especially in the case of tightening credit conditions (Salesforce Annual Report, 2024).
The fact that MSFT can finance its own innovation, dividends and buybacks without relying as heavily on debt is indicative that it has a larger margin of safety and that CRM has to rely on the efficiency gains and margin execution to further its growth. In simple terms, the balance sheet risk of Microsoft is minimal, and Salesforce has medium risk, which is rewarding to growth-oriented investors who will join the ride when the volatility strikes.
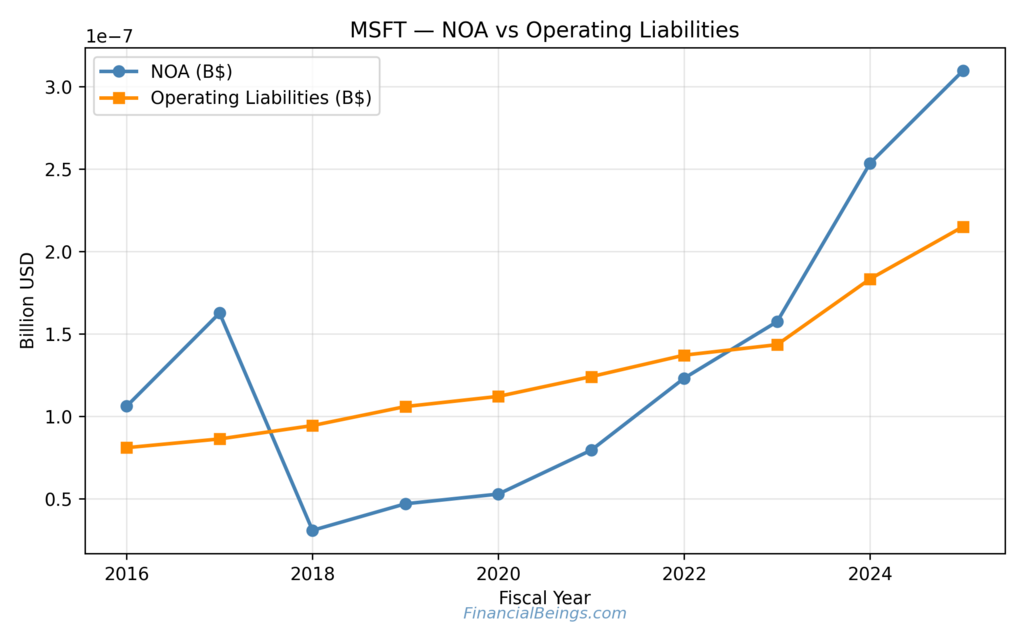
Figure 5: MSFT NOA vs Liabilities (2016-2024)
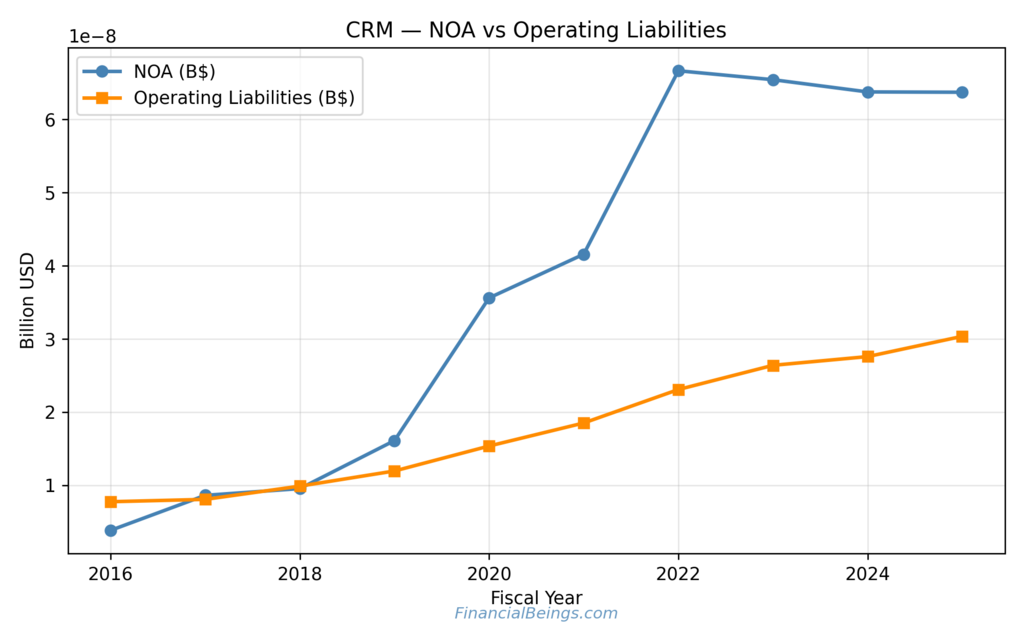
Figure 6: CRM NOA vs Liabilities (2016-2024)
The increase in assets is consistent (1.1B-3.1B) and so is the increase in liabilities (Moderate). Salesforce NOA rises until 2022 and is slightly steep as compared to liabilities that keep growing, signifying that there is another dependence on leverage.
| Balance Behaviour Check | Microsoft | Salesforce |
| NOA Pattern | Smooth upward | Peaked then stabilised |
| Liability Growth | Predictable | Faster relative to NOA |
| Risk of Capital Stress | Low | Noticeably Higher |
| Safety in Cash Buffer | Very High | Moderate |
CRM isn’t weak; it’s simply more growth-leveraged, less defensive.
Competitive Landscape Context
When purchasing technology, it is the competition and not the price.
Microsoft has product ecosystem lock-in. Windows → Office → Teams → Azure → AI add-ons. This is incredibly hard to get out of such a setting.
Salesforce happens to be the world leader in CRM, as well as the one that can be integrated with thousands of applications, but its moat does not lie in the control of the infrastructure, but in the functions that it offers to the customers. CRM platforms optimisation tends to be the first one in case of budget reduction.
| Industry View | MSFT Edge | CRM Edge |
| Switching friction | Very high | High, but still replaceable |
| AI rollout scale | Massive, enterprise-wide | Focused on CRM |
| Revenue diversity | Cloud + OS + Gaming + Office | Primarily CRM SaaS |
| Margin power | Strong historical proof | Improving trend |
Valuation Sensitivity & Risk Stress Test
What happens to these stocks when the market mood becomes sour? Which one is the safest tech stocks 2026?
| Stress Event | Impact on MSFT | Impact on CRM |
| Rate hikes | Mild decline due to cash strength | Sharper volatility |
| Recession talk | Slower but stable | Contracts more visibly |
| IT budget cuts | Sticky renewals keep revenue alive | Deal cycles may slow |
| AI spending boom | Huge leverage | Good, but smaller scale |
In a bull market, CRM can beat MSFT by a high margin, and in 9 out of 10 chances that the market has declined, MSFT would beat CRM due to its balance sheet and diversified revenue (Microsoft Annual Report 2024).
Further Reading : MSFT Stock After Q1 2026: Evaluating Growth, Valuation, and Future Profitability Drivers
Investment Strategy Framework for 2026 Buyers
Conservative (Low Volatility) Portfolio.
▶ 80% Microsoft, 20% Salesforce
The solution to the question of individuals who worry about the security of wealth is retirement accounts and constant compounding.
Balanced Growth Portfolio
▶ 60% Microsoft, 40% Salesforce
Good for investors who would enjoy swings to make better gains.
Aggressive Upside Portfolio.
▶ 30–40% Microsoft, 60–70% Salesforce
The higher risk, yet CRM benefits would be more effective in expansions.
It is not advice concerning money but one of the positioning thinking of behaviour that most long-term investors use.
Conclusion
Salesforce is getting better and offering more upsides annually, and can offer more upsides in comparison with the past. CRM suits such buyers who are not concerned with the cycles and want to be exposed to expansion.
Rather, Microsoft is a less risky growth asset that is predictable in terms of revenue, has immense reserves in terms of free cash, high RNOA, and is an industry-wide reliance that causes it to remain steady even during the crisis periods (Microsoft Investor Relations, 2024).
MSFT can be the anchor to a portfolio, and CRM can be the driver on top of the same in the case of long-term investment horizon.
All calculations and valuation estimates are FinancialBeings’ own, based on data sourced from SEC filings MSFT (10K and 10Q) and CRM (10K and 10Q), use or reproduction before prior approval is prohibited.
Frequently Asked Questions (FAQs)
Is CRM stock a strong buy?
Salesforce can be considered attractive in the context of its growth opportunities among investors because recent improvements in terms of free cash flow and RNOA have proven that the company has a robust operation over time. It is not risk-averse since the business is reliant on the enterprise spending cycle, which is prone to creating volatility due to economic slowdowns. CRM is purchased for growth-oriented portfolios, but position sizing matters for more conservative investors.
Which is better, Salesforce or Microsoft stock?
Microsoft can be regarded as the less risky option due to the larger revenue level, less fluctuating free cash flow and lesser balance-sheet risk. When the expenditure on the enterprise goes up, Salesforce has greater potential to gain, but it is also more susceptible to market cycles. Microsoft can serve as a stability and compounding investment, and Salesforce as a growth investment to most long-term investors.
Usama Ali
Usama Ali is the founder of Financial Beings and a self-taught investor who blends classic valuation study with insights from psychology. Inspired by works from Benjamin Graham, Aswath Damodaran, Stephen Penman, Daniel Kahneman, and Morgan Housel, he shares independent, data-driven research to help readers connect money, mind, and happiness.
Disclaimer
The content provided herein is for informational purposes only and should not be construed as financial, investment, or other professional advice. It does not constitute a recommendation or an offer to buy or sell any financial instruments. The company accepts no responsibility for any loss or damage incurred as a result of reliance on the information provided. We strongly encourage consulting with a qualified financial advisor before making any investment decisions.
