Introduction
OXY vs XOM Dividend comparison for 2025: Find out which oil stocks provide income-focused investors with greater yields, Wall Street price goals, and undervaluation possibilities. In 2025, dividend investors are closely monitoring the energy industry. For income-focused investors seeking both dependable yields and potential upside, the dividend comparison between Occidental Petroleum (OXY) and ExxonMobil (XOM) is particularly pertinent. Although both businesses are crucial to the global oil story, they take somewhat different approaches to shareholder returns, leverage, and capital allocation. Despite its shale-heavy business and Warren Buffett’s obvious support, OXY has a history of dividend cuts and offers cyclical upside.
This article’s dividend comparison of Oxy and XOM includes an in-depth analysis of yields, payout sustainability, valuation signals from proprietary models, and 2025 price targets.
Company Backgrounds
Occidental Petroleum (OXY).
Due to its extensive presence in the Permian Basin, Occidental Petroleum has established a dominant presence in the shale oil industry. Warren Buffett’s Berkshire Hathaway made a sizable investment in the company, indicating institutional confidence in its long-term prospects and increasing its visibility.
ExxonMobil (XOM).
In contrast, ExxonMobil is a major player in the global energy industry, operating in the petrochemical, downstream refining, and upstream exploration sectors. Compared to pure upstream companies like OXY, this integrated approach provides the corporation with a more stable profit base by diversifying revenue streams and offering natural hedges against fluctuations in oil prices. For a deeper valuation perspective, you can explore our detailed analysis of ExxonMobil’s fair value in 2025.
Dividend Comparison 2025
Current Dividend Yields (OXY vs XOM)
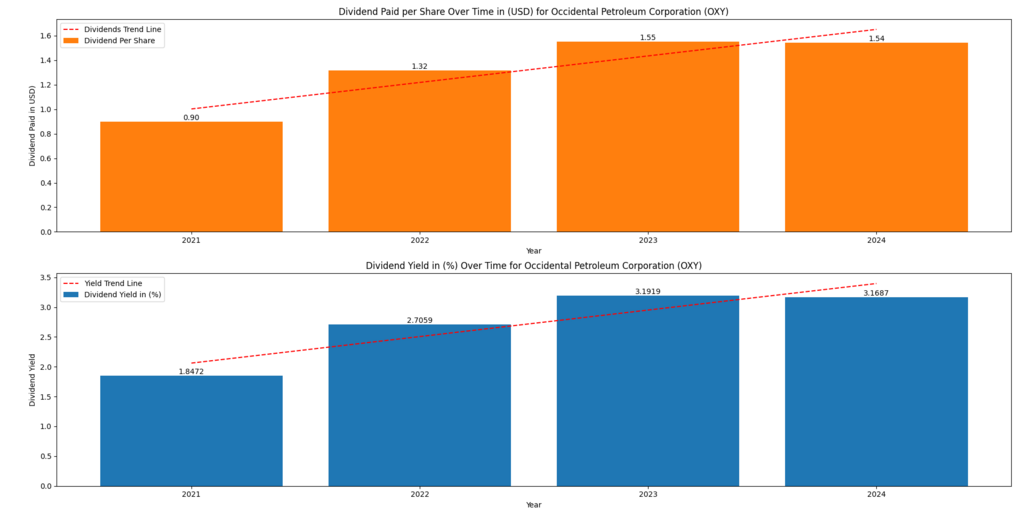
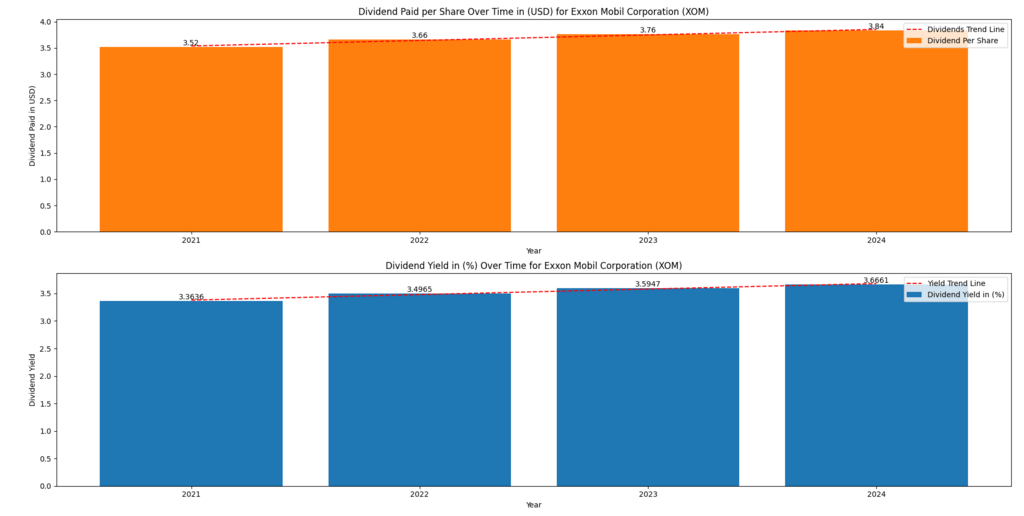
Occidental Petroleum’s conservative approach to recovering shareholder dividends following the 2020 decrease is reflected in its current dividend yield of approximately 1.3%. In comparison, ExxonMobil offers a significantly higher yield of roughly 3.2%, making it more appealing to conventional dividend investors seeking reliable sources of income.
Dividend Payout Ratios & Sustainability
By directing a significant portion of its free cash flow into lowering borrowing and financing expansion initiatives, OXY has purposefully maintained a conservative payout ratio (Occidental Petroleum Corporation, 2025).
Dividend Growth History & Consistency
OXY has had a more erratic dividend history. The 2020 oil crash caused harm to investor trust, but management has subsequently gradually increased rewards, albeit from a considerably lower starting point (ExxonMobil Corporation, 2025).
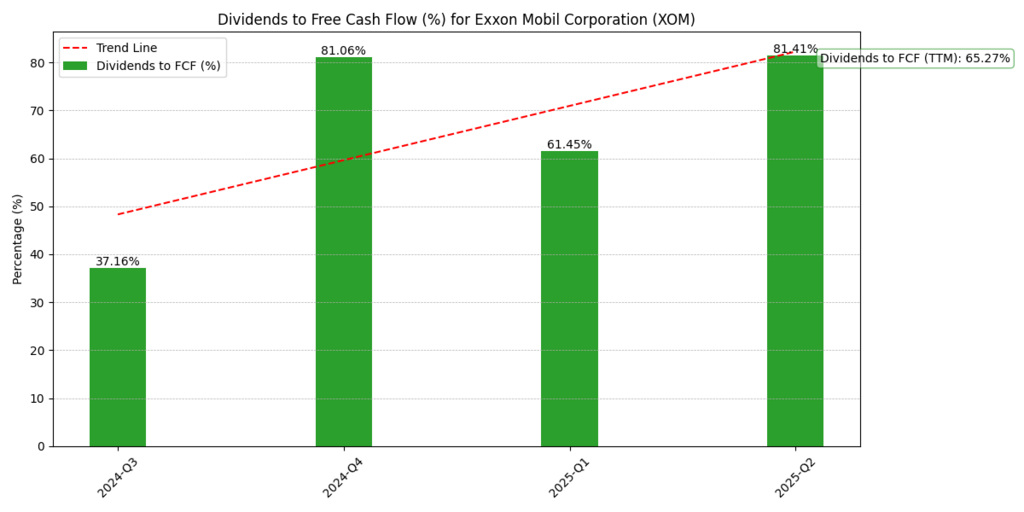
Yield-Adjusted Risk Profile
XOM is clearly the safer option when risk and yield are compared. It appeals to risk-averse, income-focused investors due to its greater yield and dividend dependability.
Table 1. Dividend Yield & Sustainability Snapshot (2025)
| Company | Yield (%) | Payout Ratio | Growth History | Dividend Risk |
| OXY | 3.1 | Conservative | Rebuilding since 2020 | Higher |
| XOM | 3.6 | Stable | Continuous record | Lower |
Price Targets For OXY nd XOM
Model-Based Price Targets
Occidental Petroleum (OXY) and ExxonMobil (XOM) have remarkably distinct valuation profiles. The current price of $47.5 indicates that OXY is fairly valued in the Bear and Moderate scenarios, but offers limited upside in the Bull case. The stock’s intrinsic value ranges between $34 and $49.70. ExxonMobil’s valuation, on the other hand, varies from $150.4 to $216.5 in relation to its current market price of $117.2, suggesting widespread undervaluation in all modelled scenarios.
Multiples Perspective (P/E, EV/EBITDA, and P/B)
Its greater debt, however, greatly inflates its EV/EBITDA, making the headline discount less alluring. Investors understand that a balanced sheet may provide a greater margin of safety than a low P/E in a highly leveraged organisation. In contrast, ExxonMobil’s price-to-book ratio is comparatively greater.
Analyst Undervaluation Signals.
An implicit analyst signal is the valuation discrepancy between model outputs and current prices. However, even at the lowest estimated value, ExxonMobil already appears inexpensive in conservative bear scenarios, with a potential upside of around +28%.
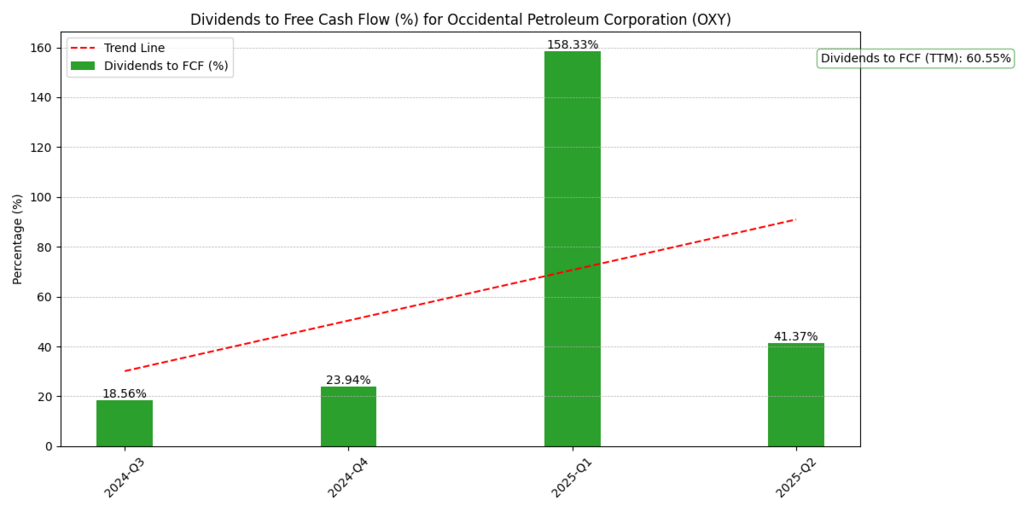
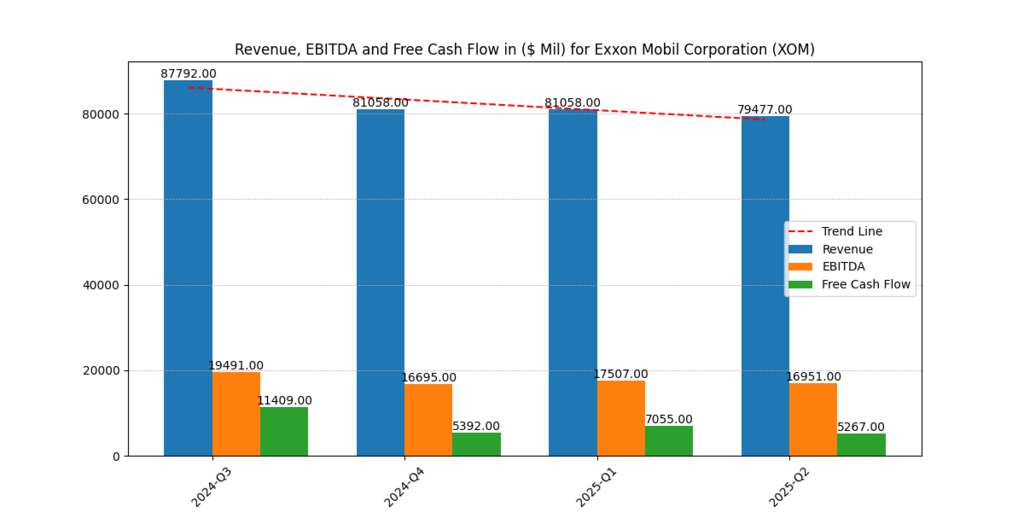
Free Cash Flow Strength and Dividend Coverage.
Due to its greater sensitivity to changes in commodities and leverage commitments, OXY’s free cash flow has been unstable, declining from around $2.0 billion in Q3 2024 to less than $1.0 billion by mid-2025. For a more detailed breakdown of recent performance, you can explore Occidental Petroleum’s Q1 2025 earnings and analysis.
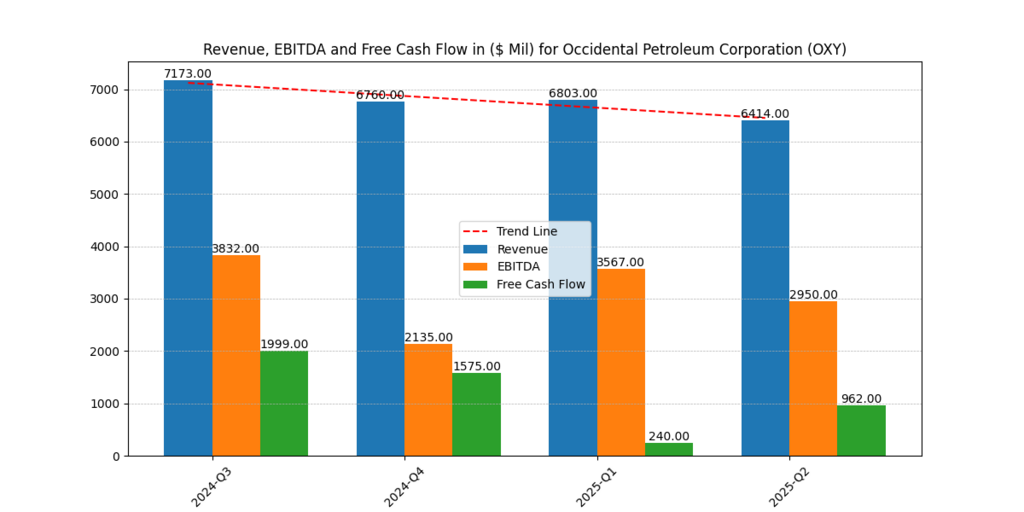
Figure 1: In contrast to more stable EBITDA trends, this chart illustrates Occidental’s decreasing free cash flow, which went from $2.0 billion in 2024-Q3 to $962 million in 2025-Q2.
2025 Price Targets & Analyst Forecasts
The scenario-based intrinsic values provided by the secret valuation models serve as a proxy for analyst projections, akin to those on Wall Street. These ranges show how each stock is priced in relation to its present market position in 2025.
Table 2. Price Target Ranges (2025)
| Scenario | OXY Intrinsic Value ($) | XOM Intrinsic Value ($) | Market Price ($, 2025) |
| Bear | 34.4–36.0 | 150.4–165.0 | OXY: 47.5, XOM: 117.2 |
| Moderate | 38.9–42.0 | 175.6–185.0 | |
| Bull | 49.7–50.0 | 185.0–216.5 |
OXY Price Targets (Consensus Style)
The Bear and Moderate scenarios for Occidental Petroleum fall substantially below the current market price of $ 47.50, ranging from $ 34.40 to $ 42.00. OXY only has modest upside potential under the Bull hypothesis, with targets ranging from $ 49.70 to $ 50.00.
XOM Prices (Analyst Forecast Style)
ExxonMobil presents an entirely different image. Intrinsic values range from $150.4 to $165.0, even in the bear scenario, which already suggests a 28% to 41% increase from the current market price of $117.2. This is further expanded by the Moderate and Bull ranges, which have potential prices between $ 175.60 and $ 216.50, or approximately +50% to +85% upside.
Upside vs Current Market Price
- Oxy: Limited potential. The current price implies a small margin of safety because it surpasses the Bear and Moderate values, and only approaches parity in the Bull case.
- XOM: Considerable upside in any situation. The stock is clearly undervalued as it is currently trading below even the most cautious Bear valuation.
Which Stock Has More Potential for Growth?
For 2025, ExxonMobil has much more upside potential. Due to its market price of $117.20, which is significantly lower than its intrinsic value range of $150–216, it presents a strong argument for investors seeking both capital appreciation and income. Conversely, Occidental Petroleum seems to be more of a tactical move that will only pay off for investors if both operational performance and favourable oil price conditions coincide.
Risks to Dividend Stability
OPEC and the volatility of oil prices.
OXY’s shale operations, especially in the Permian Basin, are a significant component of its business strategy. Because of this, its profits are extremely sensitive to changes in the price of crude oil; OXY gains disproportionately when prices rise, but its revenues and cash flows quickly decline when prices fall. For a more detailed breakdown, you can explore our in-depth analysis of Occidental Petroleum (OXY) stock and its 2025 price targets.
CapEx & Debt Levels.
Another critical consideration is leverage. With a debt-to-EBITDA ratio still close to 8.2x TTM, OXY’s debt load is very high, making it more vulnerable to financing concerns during times when credit becomes more stringent. High-interest debt limits the amount of money that may be used for dividends, especially if free cash flow declines (Occidental Petroleum Corporation, 2025).
Pressures from ESG and Transition.
Though the type of risk varies, both businesses are subject to growing environmental, social, and governance (ESG) scrutiny. Being one of the biggest oil companies, ExxonMobil is a target for decarbonization-related regulatory pressures and activist investors (ExxonMobil Corporation, 2025).
Long-Term Investment Outlook:
- OXY: Growth-oriented investors who are prepared to accept volatility will find Oxy appealing. As debt continues to decline, dividend potential increases.
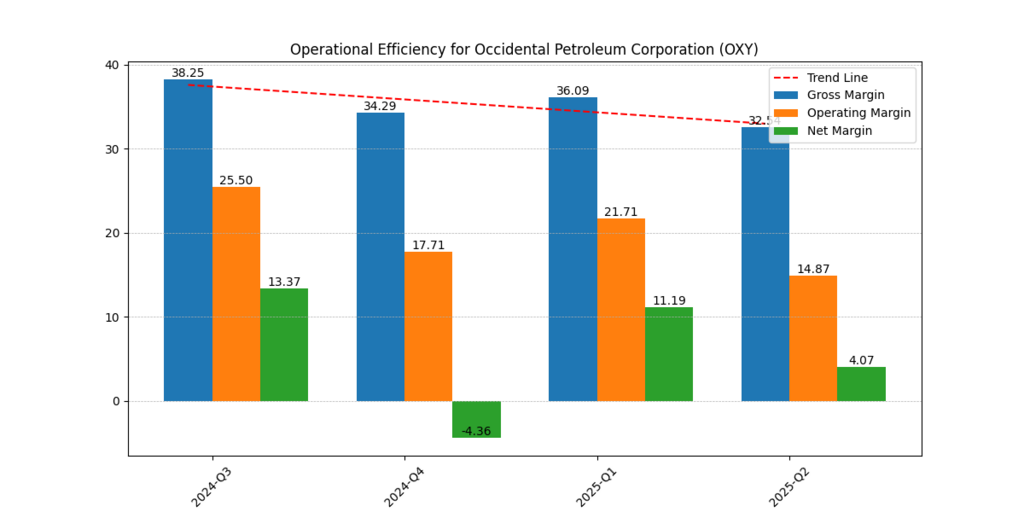
Figure 4: Operational Efficiency Margins for OXY (2024–2025) Over the course of four quarters, OXY’s gross margin decreased from approximately 38% to around 32%, while the operating and net margins exhibited notable volatility.
- XOM: Perfect for dependable income investors. As a business identity, dividends are safeguarded.
Figure 5. ROTC (Return on Total Capital) and ROE (Return on Equity) for OXY (2024–2025). Inconsistent profitability is demonstrated by ROE and ROTC, which range from negative in Q4 2024 to slightly positive by Q2 2025.
3–5 Year Viewpoint
- OXY: High risk/reward associated with deleveraging and oil cycles.
- XOM: Provides consistent dividend compounding with less volatility.
OXY attracts risk-takers due to contrarian bias, while retirees prefer XOM due to a status quo mentality.
Conclusion
Both Occidental Petroleum (OXY) and ExxonMobil (XOM) dividend comparisons appeal to different investor profiles, reflecting variations in their business models, risk exposures, and value signals.
- Occidental Petroleum, OXY. With intrinsic values ranging from $34.4 to $42.0 in relation to its current market price of $47.5, the valuation models indicate that OXY’s upside is constrained in the Bear and Moderate scenarios. The stock has significant potential for appreciation only in the bull case, with goals ranging from $49.7 to $50.0.
- XOM, or ExxonMobil. On the other hand, XOM’s valuation is firm in every situation. The stock appears to be undervalued overall, with intrinsic targets ranging from $ 150.40 to $ 216.50, compared to the current market price of $ 117.20. Even with cautious projections, this translates to a possible upside of 28% to 85%.
Balanced Portfolio Strategy
Investors seeking to balance growth potential with security may find that a hybrid strategy is the most suitable approach. While adding OXY in smaller amounts offers flexibility and potential upside if energy markets outperform, holding XOM as the anchor delivers a consistent yield and cheap entry points. This barbell approach helps strike a balance between the counterintuitive allure of cyclical growth and the psychological comfort of dividend predictability.
Usama Ali
Usama Ali is the founder of Financial Beings and a self-taught investor who blends classic valuation study with insights from psychology. Inspired by works from Benjamin Graham, Aswath Damodaran, Stephen Penman, Daniel Kahneman, and Morgan Housel, he shares independent, data-driven research to help readers connect money, mind, and happiness.
Disclaimer
The content provided herein is for informational purposes only and should not be construed as financial, investment, or other professional advice. It does not constitute a recommendation or an offer to buy or sell any financial instruments. The company accepts no responsibility for any loss or damage incurred as a result of reliance on the information provided. We strongly encourage consulting with a qualified financial advisor before making any investment decisions.
