Discover why to buy Microsoft stock now could be a smart move — with steady earnings, exciting AI growth, and dependable dividends for the long run. Microsoft Corporation (MSFT) always tops in terms of resilient investments, even in the volatile market witnessed today. The real question that many investors would ask is easy to answer: Why to buy Microsoft Stock in 2025? The solution is in an effective combination of financial stability, operational efficiency, AI-based development, and consistent dividend payments. As the world markets become more digitally transformed, Microsoft is at the centre of various growth trends – including cloud services and artificial intelligence – turning it into one of the most attractive investments by both risk-averse and risk-seeking investors (Morningstar, 2024).
Financial Strength & Balance Sheet Stability
The consistent balance sheet strength of Microsoft Stock is one of the reasons Why to Buy Microsoft Stock. The assets-to-liabilities ratio has remained at a comfortable level of 2x and 2.34 during Q3 2025. Also, Net Tangible Assets-to-Liabilities improved between 0.60 in Q1 2024 and 0.74 in Q3 2025.
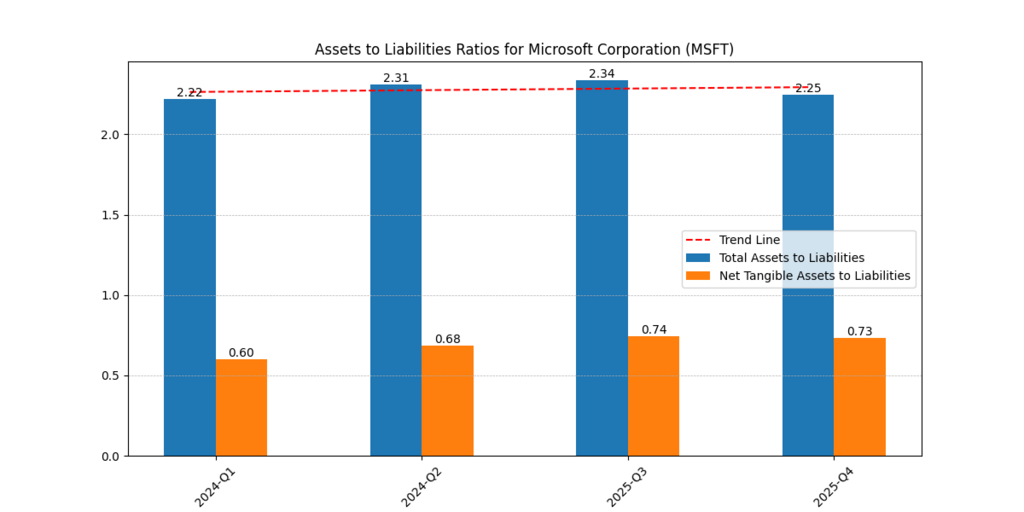
Figure 1: Assets to Liabilities in Microsoft’s ratios (2024–2025). Microsoft demonstrated balance sheet stability and investor protection by maintaining a strong Total Assets to Liabilities ratio of 2.2x in 2024–2025.
Crucially, the Cash Flow to Expenditures ratio has increased from 1.41 in Q2 2024 to 2.50 in Q4 2025, demonstrating Microsoft’s capacity to pay for projects using cash generated internally. This indicates to investors not only sound financial standing but also the capacity to reinvest in expansion plans without using excessive leverage.
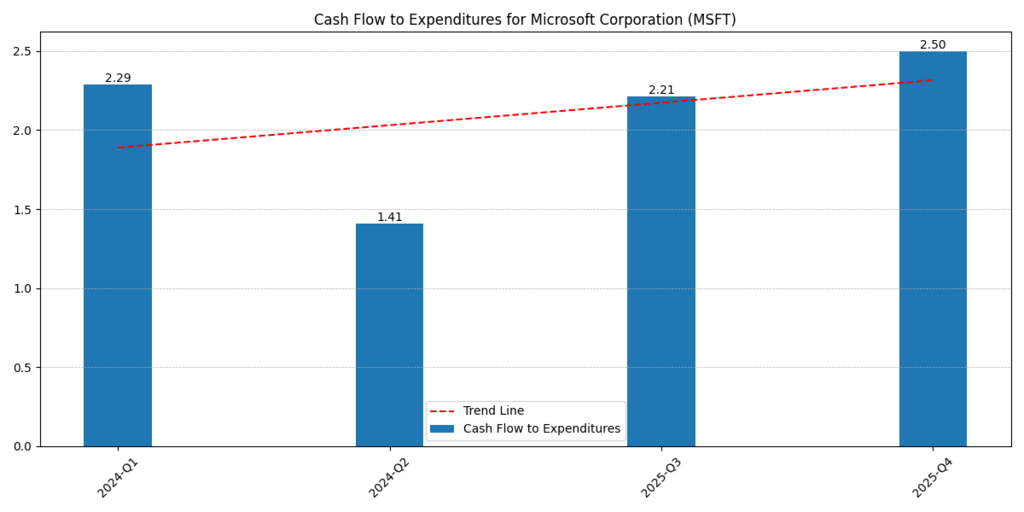
Figure 2: The ratio of cash flow to expenses (2024–2025). In Q4 2025, the cash flow to expenditure ratio rose to 2.5, demonstrating Microsoft’s capacity to finance its own expansion and investments.
Confidence is bred by stability. Businesses that can withstand downturns without experiencing financial hardship are typically valued by investors. Microsoft’s financial sheet is a quintessential illustration of resilience and safety.
Dividend Growth & Shareholder Returns
Microsoft is a dividend generator in addition to a growth corporation. While the Dividend Yield improved from 0.72% to over 0.97% within the same time period, the Dividend per Share increased consistently from $2.43 in 2022 to $3.24 in 2025.
| Year | Dividend per Share ($) | Dividend Yield (%) |
| 2022 | 2.43 | 0.73 |
| 2023 | 2.66 | 0.80 |
| 2024 | 2.93 | 0.87 |
| 2025 | 3.24 | 0.97 |
Dividends provide long-term investors with a buffer in erratic markets. They provide comfort—the knowledge that money will continue to come in even if stock prices change. Microsoft appeals to both cautious and aggressive portfolios because of its growth and income combination.
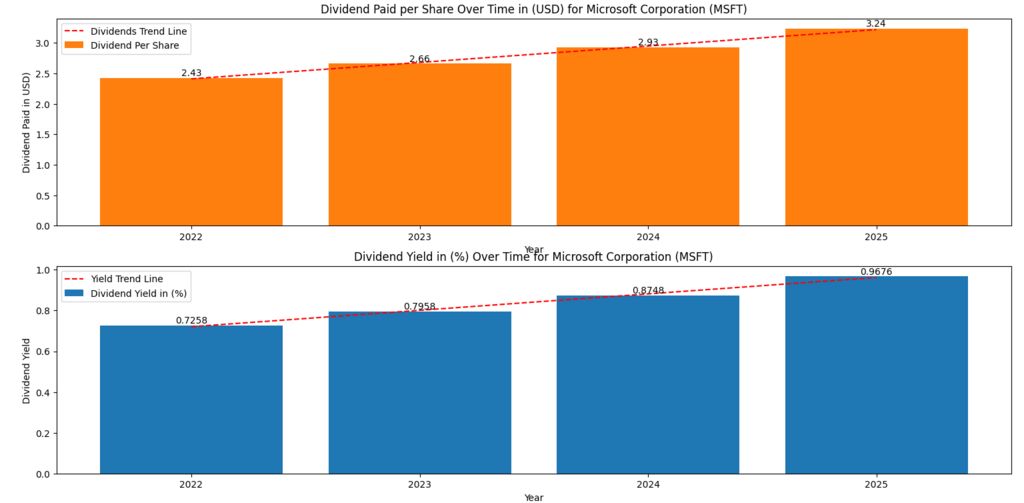
Figure 3: Dividend yield and dividend per share (2022–2025) are shown. The consistent increases in dividend payouts and yields demonstrate Microsoft’s dedication to shareholder returns, income stability, and efficiency & Margin
In the tech industry, Microsoft routinely produces some of the highest margins. In 2025, the operating margin was close to 45%, the net margin was between 35 and 37%, and the gross margin was approximately 69%.
These efficiency measures demonstrate Microsoft’s capacity to convert top-line growth into bottom-line profit and its discipline in cost management. This means that every dollar of revenue is extremely productive for investors, maintaining long-term profitability despite growing R&D and AI-related costs.
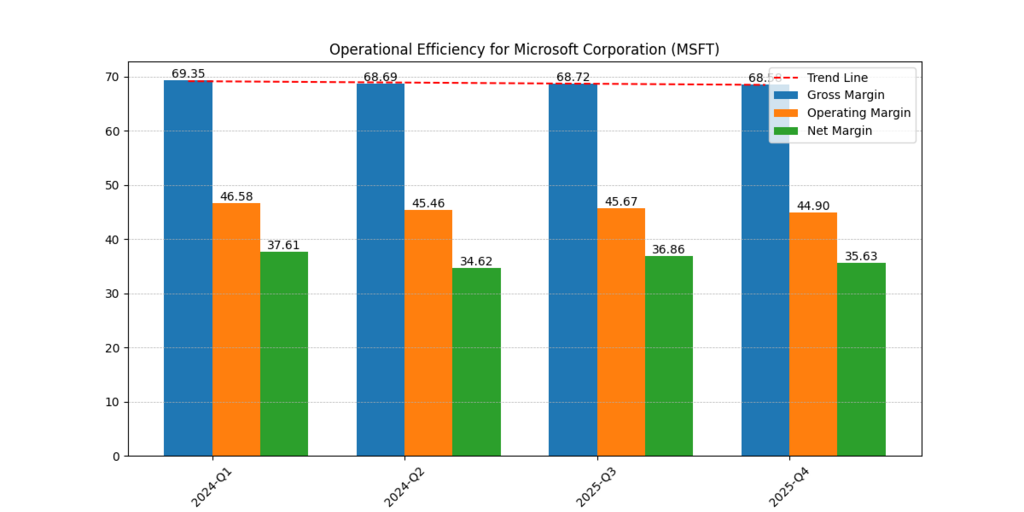
Figure 4: Microsoft’s 2024–2025 Gross, Operating, and Net Margins. Operating and net margins were consistently high, and gross margins remained close to 69%, indicating Microsoft’s cost-effectiveness.
Revenue, EBITDA & Free Cash Flow Trends
Microsoft’s quarterly revenue increased from $65.6 billion to $76.4 billion between 2024 and 2025, while its EBITDA increased from $38.2 billion to $44.4 billion. Most remarkably, in Q4 2025, Free Cash Flow increased from $19.2 billion in Q1 2024 to $25.6 billion.
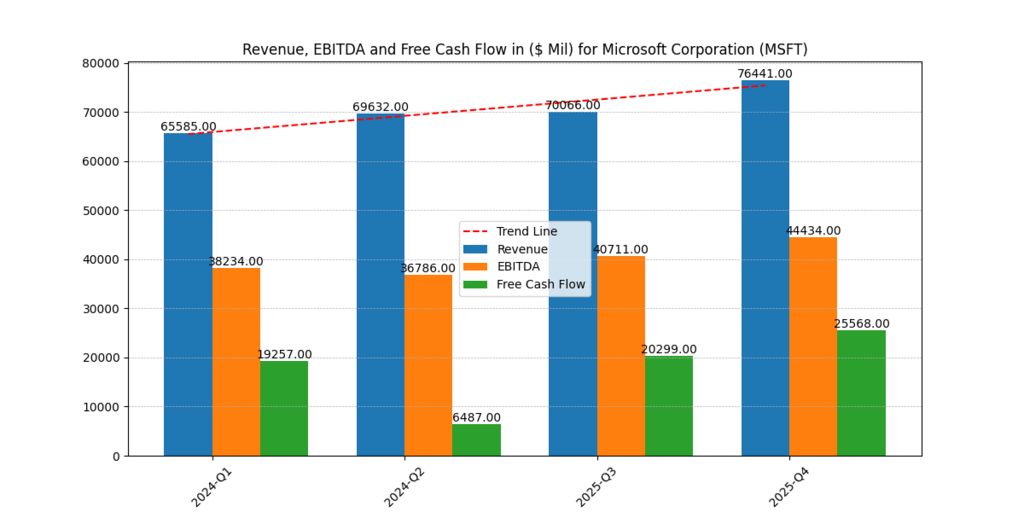
Figure 5: Revenue, EBITDA, and Free Cash Flow Growth (2024–2025) are shown. Microsoft’s financial health was reinforced by the expansion in free cash flow, which increased quarterly sales from $65.6 billion in Q1 2024 to $76.4 billion in Q4 2025.
| Quarter | Revenue ($B) | EBITDA ($B) | Free Cash Flow ($B) |
| 2024-Q1 | 65.6 | 38.2 | 19.3 |
| 2024-Q2 | 69.6 | 36.8 | 6.5 |
| 2025-Q3 | 70.1 | 40.7 | 20.3 |
| 2025-Q4 | 76.4 | 44.4 | 25.6 |
These numbers demonstrate why Microsoft is still seen by investors as a cash-generating powerhouse. The parameter that drives dividends, buybacks, and reinvestment in AI efforts is specifically free cash flow.
Further Reading : Is Microsoft a Good Stock to Buy After FY26 Earnings? A Comprehensive Price Prediction Analysis!
Value-Added Earnings (VAEs) & Growth Projections
Microsoft’s growth potential under different conditions is displayed using the proprietary Value-Added Earnings (VAE) model. Different growth assumptions result in different pricing forecasts:
| Scenario | No Growth Price/Share ($) | Growth Price/Share ($) | 2025 VAE ($) | 2026 VAE ($) | VAE Growth 2026 (%) |
| Base Case | 153.49 | 585.27 | 10.84 | 13.42 | 23.75% |
| Scenario 7.6% | 184.13 | 614.22 | 10.84 | 13.42 | 23.75% |
| Alternative | 153.49 | 487.86 | 10.84 | 13.42 | 23.75% |
Growth possibilities indicate upside potential exceeding $600 per share, while even under cautious assumptions, Microsoft offers strong downside protection (floor around $150).
This safety net and upside potential combination is very alluring from the standpoint of investor psychology. It strengthens the hope of significant rewards and lessens the fear of loss, two of the strongest emotional factors influencing financial decision-making.
Return on Equity (ROE) and Return on Total Capital (ROTC)
On a trailing twelve-month basis, Microsoft’s Return on Equity (ROE) is 32.49%, while its Return on Total Capital (ROTC) is 33.63%. These measures demonstrate the company’s capacity to extract high profitability from both shareholder equity and total capital invested, and they exceed peers in the industry.
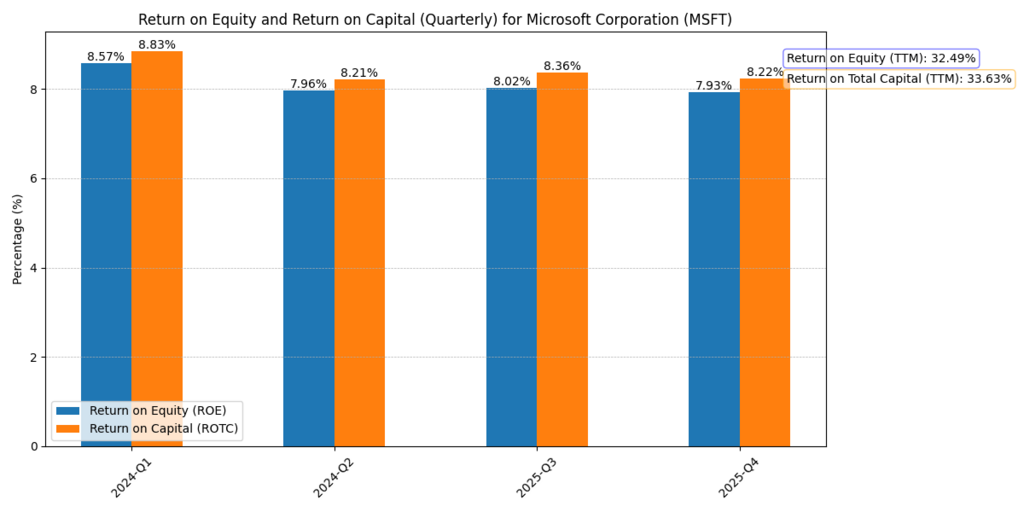
Figures 6: Return on Equity and Return on Total Capital (2024–2025). On a trailing twelve-month basis, ROE and ROTC remained above 30%, demonstrating Microsoft’s profitable and effective use of capital.
This effectiveness guarantees that investors’ funds are being used efficiently, which is still another important justification for purchasing Microsoft stock.
AI Growth as a Catalyst
In 2025, artificial intelligence will still be Microsoft’s major growth engine. With the incorporation of ChatGPT into GitHub Copilot, Office 365, and Azure AI services, Microsoft is not only facilitating AI but also making money on a number of platforms.
The AI drive guarantees that Microsoft’s revenue growth is linked to cutting-edge technologies that are influencing the future rather than being restricted to legacy items. Investors looking for growth with sustainability will find the company especially appealing due to its long-term positioning (Goldman Sachs, 2025).
Conclusion
In 2025, Microsoft will provide a unique combination of operational effectiveness, dividend consistency, financial stability, and rapid AI-driven development. Patient investors continue to be rewarded by free cash flow and dividend yield, while its value-added earnings analysis shows solid potential.
Why to buy Microsoft Stock, then? because it is a business that combines three important factors that long-term investors find compelling: safety, growth, and significance. Microsoft continues to be a vital component of any diversified portfolio due to its solid foundation and leadership in artificial intelligence.
Usama Ali
Usama Ali is the founder of Financial Beings and a self-taught investor who blends classic valuation study with insights from psychology. Inspired by works from Benjamin Graham, Aswath Damodaran, Stephen Penman, Daniel Kahneman, and Morgan Housel, he shares independent, data-driven research to help readers connect money, mind, and happiness.
Disclaimer
The content provided herein is for informational purposes only and should not be construed as financial, investment, or other professional advice. It does not constitute a recommendation or an offer to buy or sell any financial instruments. The company accepts no responsibility for any loss or damage incurred as a result of reliance on the information provided. We strongly encourage consulting with a qualified financial advisor before making any investment decisions.