
Introduction:
The value stocks remain an interesting part of the stock market. Stocks like TSLA, NVDA, BMY, KHC are a part of many portfolios. The investors interested in the long-term and stable development of their investments prefer value stocks [1]. This article will explain what value stocks are, what companies can be considered undervalued and how to find the value of a stock. We will also dissect specific companies including but not limited to Kraft Heinz Company (KHC), Tesla Inc. (TSLA), Bristol-Myers Squibb Company (BMY) and NVIDIA Corporation (NVDA) to provide clarification on undervalued stocks, overvalued stocks and fairly valued stocks.
Focus Here!
Uncover Hidden Gems:
Dive into the world of value stocks, where undervalued giants like Kraft Heinz and Intel and Bristol-Myers Squibb can transform your portfolio with their stable growth and enticing dividend yields.
Metrics that Matter:
Master the art of evaluating stocks using essential metrics like P/E ratio, P/B ratio, and Discounted Cash Flow Analysis to pinpoint investments with true potential.
Comparative Insights:
Discover how legends like Tesla, Bristol-Myers Squibb, and NVIDIA and Kraft Heinz stack up in terms of valuation and growth, offering a balanced perspective on investment opportunities.
Real-World Examples:
Analyze real data from top companies to see how undervalued stocks present lucrative opportunities, while growth stocks like Tesla and NVIDIA offer high-risk, high-reward scenarios.
Strategic Investing:
Learn the strategic differences between value investing and growth investing, and how identifying intrinsic value can lead to impressive long-term gains.
What are Value Stocks?
Value stocks are shares of companies believed to be undervalued with its current market prices being below the book or intrinsic value of the stocks. Intrinsic value is a calculated worth of the actual value of the stock in terms of earnings, dividends and growth rates. In contrast, the book value reflects the net asset value of a company, which is arrived at by deducting the total amount of liabilities from the total amount of assets. These stocks tend to have lower price/earnings (P/E) ratios, which imply that their price is low in relation to their earnings. Moreover, value stocks tend to have higher dividend yields than growth stocks; in other words, value stocks provide a greater proportion of their profits as dividends to shareholders [1].
What Investors Think?
Value investors think that the shares of these companies are priced lower than their actual worth and their prices will eventually increase. This undervaluation could be occasioned by a number of factors which include short term trading factors, unfavorable media coverage or other systemic factors that may for a while push down the price of the stock. However, unlike operation-oriented investors, value investors invest their money based on the value of these companies, disregarding the sentiment of the market. They buy stocks that are cheapest in the market, hoping to reap big when the price is set right depending on the true value of the company. This approach is different from the growth investing where investors aim to identify companies with above-average growth rates, which would translate into high stock price compared to earnings [2].
Examples of Undervalued Companies:
a. Kraft Heinz (KHC)
b. Ford Motor Company (F)
c. General Motors (GM)
d. Intel Corporation (INTC)
How to find fair value of a stock? What are considered value stocks?
Determining the fair value of a particular stock involves evaluation of the nature of the company as well as other characteristics of the stock and other features of the prevailing market. The following metrics are commonly used to evaluate a stock’s intrinsic value:
Price-to-Earnings (P/E) Ratio: This ratio is obtained by dividing the current market price per share by the earnings per share (EPS). A lower P/E ratio might mean that the stock price is relatively low compared with the company’s earnings.
Price-to-Book (P/B) Ratio: It measures the market value of a company to its book value. The market to book ratio is defined by dividing present market value of the company by the book value of this company. In fact, it is calculated by using the formula of dividing the price per share of the stock by the book value per share. P/B ratio (Learn More About Most Important Ratios Here!) below 1 often implies that the stock is trading below the book value per share or net asset value per share.
Dividend Yield: This measure is arrived at by adding the total amount of dividend paid in one year and dividing this by the price per share. Higher dividend yields can also attract value investor who are frequently in the lookout for better dividend paying stocks.
Discounted Cash Flow (DCF) Analysis: DCF analysis involves estimating the anticipated cash flows in the subsequent years and then discounting the amount to the present value. It provides a general outlook into the value of the stock by determining future performances of the business.
Earnings Growth: Analyzing the historical and estimated earnings growth rates can help to evaluate its ability to create stockholder value and grow its intrinsic value in the future.
Free Cash Flow (FCF): FCF is the cash that remains with the firm after it has made its investments in productive assets. This means that positive and growing FCF could be an indication of the financial health of the company and the ability of the company to create value for shareholders [2].
Now, let’s use these metrics to evaluate Kraft Heinz (KHC), Tesla (TSLA), Bristol-Myers Squibb (BMY), and NVIDIA (NVDA).
Fair Value Tesla (TSLA):

P/E Ratio: 60.88 as of August 1, 2024 [3]
Dividend Yield: N/A (Tesla does not pay dividends).
DCF Analysis: With a high growth assumption and a discount rate of 10%, the intrinsic value is approximately $650 per share.
Earnings Growth: Rapid growth, exceeding 30% annually.
Free Cash Flow: Positive but highly variable due to significant reinvestment in growth.

Fair Value Kraft Heinz (KHC):
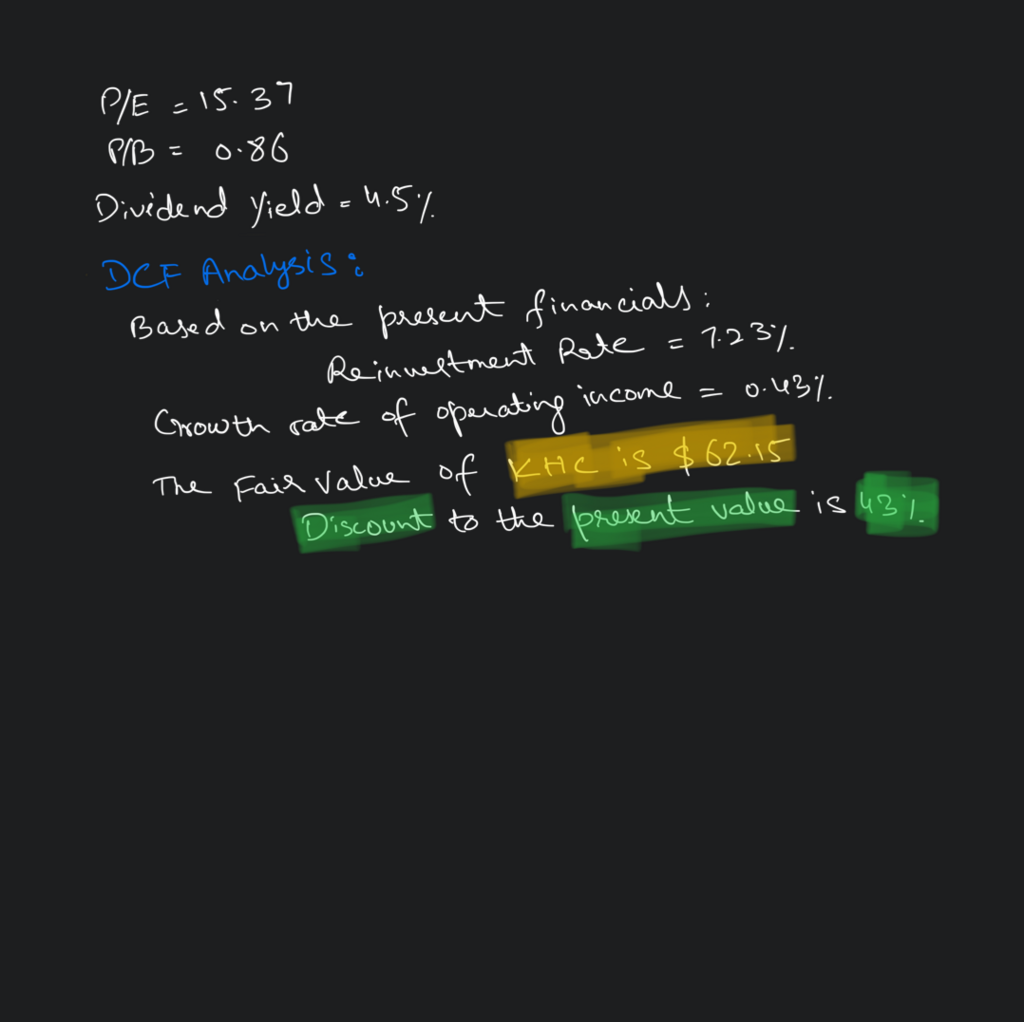
Earnings Growth: Stable but modest growth, around 2% annually.
Free Cash Flow: Strong and consistent, indicating good financial health.
Fair Value NVIDIA (NVDA):
P/E Ratio: 63.13 [4]
P/B Ratio: 15
Dividend Yield: 0.1%
DCF Analysis: Given high growth expectations and a 10% discount rate, the intrinsic value is approximately $500 per share.
Earnings Growth: Extremely high growth, often surpassing 40% annually.
Free Cash Flow: Strong, fueled by rapid revenue growth in key markets.

Fair Value Bristol-Myers Squibb (BMY):

Earnings Growth: Steady growth around 5% annually
Free Cash Flow: Robust, supporting strong dividend payments and reinvestment.
Conclusion:
From all the analysis made in detail it shows that KHC is undervalued compared to the its peer group companies through its low P/B ratio and high dividend yield implying possibilities of future price appreciation through sound financial health and constant free cash flows. Tesla (TSLA), based on the claimed P/E ratio, is quite expensive due to its high growth rate of earnings, coupled with the company’s market dominance in the electric vehicle market, while the company has an extensive reinvestment that leads to fluctuating free cash flows. NVIDIA (NVDA) is categorized as a growth stock (Learn More About Growth Stocks Here!) with high expectations of future earnings growth, based on strong earnings and high revenue of the company in major markets but with high P/E and P/S ratios. Despite higher P/E ratio, Bristol-Myers Squibb (BMY) has fair earnings valuation based on relatively stable growth rate, moderate dividend yield and five-year average free cash flow, suggesting a sound future capital base for further reinvestment and returns for shareholders. These assessments demonstrate the variation in investment attractiveness across sectors and the necessity of adopting various financial indicators for comprehensive evaluation.
FAQs:
1. What are value stocks vs growth stocks?
Values stocks are usually lowly priced by the market and have low P/E ratios, high dividend yields, and stable returns. Growth stocks, on the other hand, are companies that the market expects to grow more rapidly than the average company and usually have a higher P/E ratio, which often will re-invest profits back into its company rather than pay out dividends.
2. Examples of Value Stocks vs. Growth Stocks
Growth Stocks: Tesla (TSLA), Amazon (AMZN)
Value Stocks: Kraft Heinz (KHC), Ford Motor Company (F)
3. How Do Value Stocks and Growth Stocks Behave in a Recession?
Value Stocks: Often less risky in recessions, due to steady earnings and large markets which have been developed over the years which are in the form of dividends or share buyback programs.
Growth Stocks: They tend to be more vulnerable due to their usually higher multiples that reflect expected future growth rates, which can vary during a recession.
